Exam
Name___________________________________
SHORT ANSWER. Write the word or phrase that best completes each statement or answers the question.
Perform a Kruskal–Wallis test using the critical–value approach.
1)
Listed below are grade averages for randomly selected students with three different
categories of high–school background. At the 0.05 significance level, do the data provide
sufficient evidence to conclude that a difference exists in the three population means?
HIGH SCHOOL RECORD
Good
3.21
3.65
1.00
3.12
2.75
Fair
2.87
3.05
2.00
0.00
1.98
Poor
2.01
2.31
2.98
0.50
2.36
1)
Use Minitab to perform a Kruskal–Wallis test using the P–value approach.
2)
Listed below are grade averages for randomly selected students with three different
categories of high–school background. At the 0.05 significance level, do the data provide
sufficient evidence to conclude that a difference exists in the three population means?
HIGH SCHOOL RECORD
Good
3.21
3.65
1.00
3.12
2.75
Fair
2.87
3.05
2.00
0.00
1.98
Poor
2.01
2.31
2.98
0.50
2.36
2)
3)
A fire–science specialist tests three different brands of flares for their burning times (in
minutes) and the results are given below for the sample data. At the 0.05 significance level,
do the data provide sufficient evidence to conclude that a difference exists between the
mean burn times of the three different brands? Use the Kruskal–Wallis test.
Brand X 16.4 17.6 18.3 17.0 17.1 17.3
Brand Y 17.9 18.0 17.8 18.4 17.6 19.0 19.1
Brand Z 17.3 16.4 16.5 16.0 15.8 16.3 17.1
3)
4)
The table below shows the lifetimes (in hours) of random samples of light bulbs of three
different brands. At the 0.01 significance level, do the data provide sufficient evidence to
conclude that a difference exists between the three population means?
Brand A Brand B Brand C
190
220
230
215
224
231
182
170
203
175
178
181
203
210
199
200
196
197
4)
Provide an appropriate response.
5)
In the context of a one–way ANOVA, explain what is meant by variation between samples
and variation within samples.
5)

Conduct a Tukey multiple comparison. Display the confidence intervals in a table. State which population means can be
declared different.
6)
Use a 95% family confidence level.
Sample 1 Sample 2 Sample 3
5 9 5
4 8 6
910
3
6)
Preliminary data analyses indicate that it is reasonable to consider the assumptions for one–way ANOVA satisfied. Use
Minitab to perform the required hypothesis test using the p–value approach.
7)
At the 0.01 significance level, do the data provide sufficient evidence to conclude that a
difference exists between the population means of the three different brands ? The sample
data are given below.
Brand A
44
47
44
40
39
Brand B
30
32
34
36
38
40
42
Brand C
28
27
31
32
36
7)

Preliminary data analyses indicate that it is reasonable to consider the assumptions for one–way ANOVA satisfied.
Perform the required hypothesis test using the critical–value approach.
8)
At the 0.025 significance level, do the data provide sufficient evidence to conclude that a
difference exists between the population means of the four different brands? The sample
data are given below.
Brand A
17
20
21
22
21
Brand B
18
18
23
25
26
Brand C
21
24
25
26
29
29
Brand D
22
25
27
29
35
36
37
8)
Use Minitab to perform a Kruskal–Wallis test using the P–value approach.
9)
SAT scores for students selected randomly from three different schools are shown below.
At the 0.05 significance level, do the data provide sufficient evidence to conclude that a
difference exists between the three population means?
School A School C School B
550 480 670
400 600 520
500 620 700
550 760
460 580 620
380 600 470
450
9)

Preliminary data analyses indicate that it is reasonable to consider the assumptions for one–way ANOVA satisfied.
Perform the required hypothesis test using the critical–value approach.
10)
Random samples of four different models of cars were selected and the gas mileage of each
car was measured. The results are shown below.
Model A
23
25
24
26
Model B
28
26
29
30
Model C
30
28
32
27
Model D
25
26
25
28
Test the claim that the four different models have the same population mean. Use a
significance level of 0.05.
10)
11)
At the 0.01 significance level, do the data provide sufficient evidence to conclude that a
difference exists between the population means of the three different brands ? The sample
data are given below.
Brand A
44
47
44
40
39
Brand B
30
32
34
36
38
40
42
Brand C
28
27
31
32
36
11)
Perform a Kruskal–Wallis test using the critical–value approach.
12)
A medical researcher wishes to try three different techniques to lower blood pressure of
patients with high blood pressure. The subjects are randomly selected and assigned to one
of three groups. Group 1 is given medication, Group 2 is given an exercise program, and
Group 3 is assigned a diet program. At the end of six weeks, the reduction in each subject’s
blood pressure is recorded. Use the Kruskal–Wallis test to test the claim that there is no
difference in the distribution of the populations. Use = 0.05.
Group 1 Group 2 Group 3
16 13 11
17 10 17
14 7 9
20 813
18 914
13 5 9
12)
Provide an appropriate response.
13)
Describe the null and alternate hypotheses for one–way ANOVA. Give an example.
13)
14)
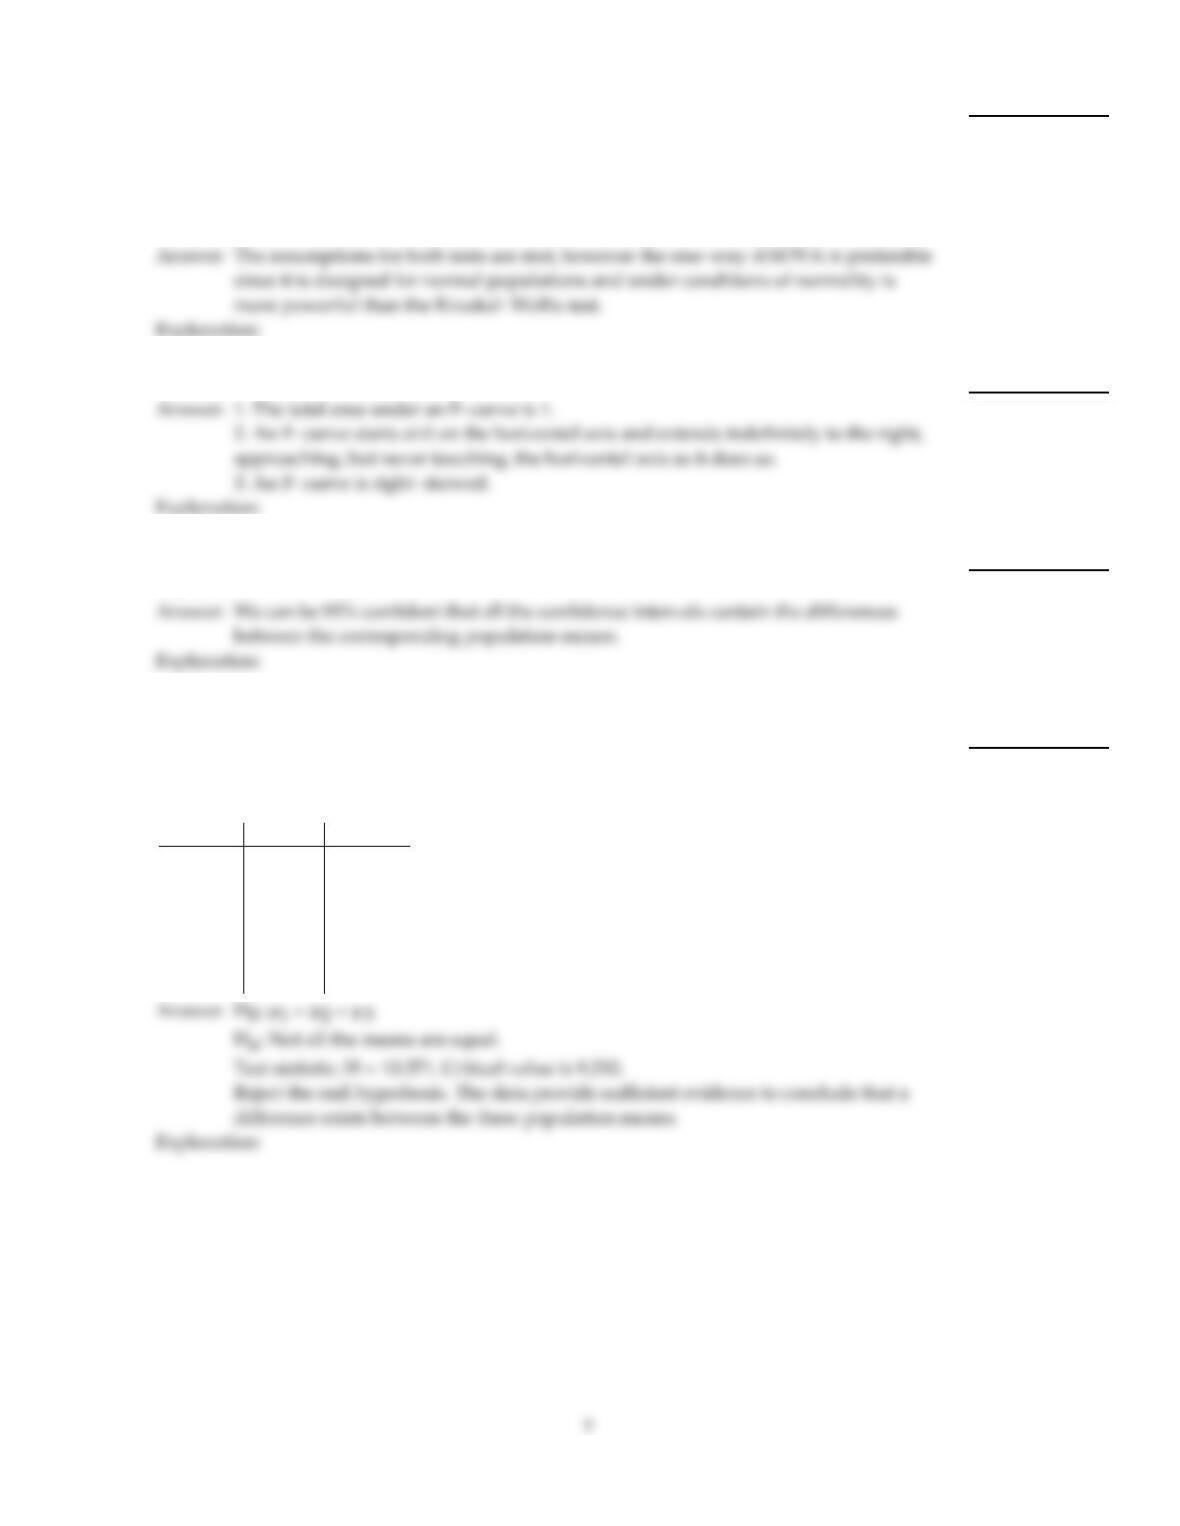
A one–way ANOVA is to be performed. Independent random samples are taken from two
populations. The sample data are depicted in the dotplot below. Is it reasonable to
conclude that the difference between the sample means is due to a difference between the
population means and not to variation within the populations? Do you think the null
hypothesis would be rejected? Explain your thinking.
14)
15)
A researcher wants to perform either a Kruskal–Wallis test or a one–way ANOVA to
compare four population means. Independent samples of sizes 7, 6, 10, and 8 are selected
from the four populations. The variable under consideration is normally distributed on
each of the four populations and the population standard deviations are equal. Are the
assumptions for the one–way ANOVA met? Are the assumptions for the Kruskal–Wallis
test met? Which test is preferable? Why?
15)
16)
List the basic properties of F–curves.
16)
17)
A Tukey multiple comparison is being performed to compare the means of three
populations. If the family confidence level is 95%, of what can we be 95% confident?
17)
Perform a Kruskal–Wallis test using the critical–value approach.
18)
The table below shows the lifetimes (in hours) of random samples of light bulbs of three
different brands. At the 0.01 significance level, do the data provide sufficient evidence to
conclude that a difference exists between the three population means?
Brand A Brand B Brand C
190
220
230
215
224
231
182
170
203
175
178
181
203
210
199
200
196
197
18)

Preliminary data analyses indicate that it is reasonable to consider the assumptions for one–way ANOVA satisfied. Use
Minitab to perform the required hypothesis test using the p–value approach.
19)
A consumer magazine wants to compare the lifetimes of ballpoint pens of three different
types. The magazine takes a random sample of pens of each type in the following table.
Brand 1
260
218
184
219
Brand 2
181
240
162
218
Brand 3
238
257
241
213
Do the data indicate that there is a difference in mean lifetime for the three brands of
ballpoint pens? Use = 0.01.
19)
Preliminary data analyses indicate that it is reasonable to consider the assumptions for one–way ANOVA satisfied.
Perform the required hypothesis test using the critical–value approach.
20)
The data below represent the weight losses for people on three different exercise programs.
Exercise A
2.5
8.8
7.3
9.8
5.1
Exercise B
5.8
4.9
1.1
7.8
1.2
Exercise C
4.3
6.2
5.8
8.1
7.9
At the 1% significance level, does it appear that a difference exists in the true mean weight
loss produced by the three exercise programs?
20)
21)
A consumer magazine wants to compare the lifetimes of ballpoint pens of three different
types. The magazine takes a random sample of pens of each type in the following table.
Brand 1
260
218
184
219
Brand 2
181
240
162
218
Brand 3
238
257
241
213
Do the data indicate that there is a difference in mean lifetime for the three brands of
ballpoint pens? Use = 0.01.
21)
Provide an appropriate response.
22)
A one–way ANOVA is performed to compare the means of four populations. If the null
hypothesis is not rejected, would it make sense to then perform a Tukey multiple
comparison? If the null hypothesis is rejected, would it make sense to then perform a
Tukey multiple comparison? Explain your reasoning. What can be determined from a
Tukey multiple comparison that cannot be determined from a one–way ANOVA?
22)
Perform a Kruskal–Wallis test using the critical–value approach.
23)
The time (in minutes) it takes to assemble a computer component for 3 different machines
is listed below. Workers are randomly selected. Use the Kruskal–Wallis test to test the
claim that there is no difference in the distribution of the populations. Use = 0.05.
Machine 1 Machine 2 Machine 3
36 44 32
35 33 29
36 42 33
34 37 35
37 39 34
35 36 31
36 40 41
23)
24)
The table below shows the weights (in pounds) of 6 randomly selected women in each of
three different age groups. At the 0.01 significance level, do the data provide sufficient
evidence to conclude that a difference exists between the three population means?
18–34 35–55 56 and older
119
134
114
125
153
138
123
147
135
110
154
163
140
128
159
134
120
116
24)
Provide an appropriate response.
25)
When performing a Tukey multiple comparison, the population means are compared
pairwise. How do you decide whether to declare two population means µi and µj
different? Why does this make sense?
25)
Conduct a Tukey multiple comparison. Display the confidence intervals in a table. State which population means can be
declared different.
26)
Perform a Tukey multiple comparison to compare the breaking strengths of four different
kinds of thread. Use a 95% family confidence level. Independent random samples of the
four different kinds of thread yielded the following breaking strengths in ounces.
Thread A Thread B Thread C Thread D
14 18 21 19
16 19 22 17
16 19 21 18
15 20 23 19
15 23
26)
Perform a Kruskal–Wallis test using the critical–value approach.
27)
A realtor wishes to compare the square footage of houses in 4 different cities, all of which
are priced approximately the same. The data are listed below. Use the Kruskal–Wallis test
to test the claim that there is no difference in the distribution of the populations. Use =
0.05.
City 1 City 2 City 3 City 4
2190 1820 1570 2440
2020 1580 1710 2390
2040 1730 1620 2640
2250 1690 1640 2190
1940 1740 1540 2040
2090 1790 2240
1690 2390
2290
27)
Preliminary data analyses indicate that it is reasonable to consider the assumptions for one–way ANOVA satisfied. Use
Minitab to perform the required hypothesis test using the p–value approach.
28)
At the 0.025 significance level, do the data provide sufficient evidence to conclude that a
difference exists between the population means of the four different brands? The sample
data are given below.
Brand A
15
25
21
23
22
20
Brand B
20
17
22
23
Brand C
21
22
20
19
18
Brand D
15
15
14
23
22
28
28
28)
Provide an appropriate response.
29)
When performing a one–way ANOVA, two of the assumptions required are that the
populations be normally distributed and that the populations have equal standard
deviations. What rule of thumb can be used to assess the equal–standard deviations
assumption? What other method can be used to assess the normality and equal–standard
deviations assumptions?
29)
Conduct a Tukey multiple comparison. Display the confidence intervals in a table. State which population means can be
declared different.
30)
Perform a Tukey multiple comparison to compare the lifetimes of flashlight batteries of
three different brands. Use a family confidence level of 0.95. Independent random samples
of batteries of the three different brands yielded the following lifetimes in hours.
Brand A Brand B Brand C
38 32 24
36 27 25
31 28 29
42 26
29
30)
Preliminary data analyses indicate that it is reasonable to consider the assumptions for one–way ANOVA satisfied.
Perform the required hypothesis test using the critical–value approach.
31)
Four different types of fertilizers are used on raspberry plants. The number of raspberries
on each randomly selected plant is given below. Test the claim that the type of fertilizer
makes no difference in the mean number of raspberries per plant. Use = 0.01.
Fertilizer 1 Fertilizer 2 Fertilizer 3 Fertilizer 4
6 5 6 3
7 8 3 5
6 5 2 3
5 5 4 4
7 5 3 5
6 6 3 4
31)
Provide an appropriate response.
32)
Explain the rationale behind the Kruskal–Wallis test. Explain, in particular, why a large
value of the test statistic suggests that the population means are not equal.
32)
Perform a Kruskal–Wallis test using the critical–value approach.
33)
A fire–science specialist tests three different brands of flares for their burning times (in
minutes) and the results are given below for the sample data. At the 0.05 significance level,
do the data provide sufficient evidence to conclude that a difference exists between the
mean burn times of the three different brands? Use the Kruskal–Wallis test.
Brand X 16.4 17.6 18.3 17.0 17.1 17.3
Brand Y 17.9 18.0 17.8 18.4 17.6 19.0 19.1
Brand Z 17.3 16.4 16.5 16.0 15.8 16.3 17.1
33)
Provide an appropriate response.
34)
A one–way ANOVA is being performed. Suppose that SST =87.6 and SSTR =54.7. Find
the value of the third sum of squares, give its notation, state its name and the source of
variation it represents.
34)
Preliminary data analyses indicate that it is reasonable to consider the assumptions for one–way ANOVA satisfied. Use
Minitab to perform the required hypothesis test using the p–value approach.
35)
Random samples of four different models of cars were selected and the gas mileage of each
car was measured. The results are shown below.
Model A
23
25
24
26
Model B
28
26
29
30
Model C
30
28
32
27
Model D
25
26
25
28
Test the claim that the four different models have the same population mean. Use a
significance level of 0.05.
35)
Perform a Kruskal–Wallis test using the critical–value approach.
36)
Four different types of fertilizers are used on raspberry plants. The number of raspberries
on each randomly selected plant is given below. Use the Kruskal–Wallis test to test the
claim that there is no difference in the distribution of the populations. Use = 0.05.
Fertilizer 1 Fertilizer 2 Fertilizer 3 Fertilizer 4
9 8 9 6
811 6 8
9 8 7 6
10 8 6 7
10 8 5 8
9 9 6 7
36)
Preliminary data analyses indicate that it is reasonable to consider the assumptions for one–way ANOVA satisfied.
Perform the required hypothesis test using the critical–value approach.
37)
At the 0.025 significance level, do the data provide sufficient evidence to conclude that a
difference exists between the population means of the four different brands? The sample
data are given below.
Brand A
15
25
21
23
22
20
Brand B
20
17
22
23
Brand C
21
22
20
19
18
Brand D
15
15
14
23
22
28
28
37)
Use Minitab to perform a Kruskal–Wallis test using the P–value approach.
38)
The table below shows the weights (in pounds) of 6 randomly selected women in each of
three different age groups. At the 0.01 significance level, do the data provide sufficient
evidence to conclude that a difference exists between the three population means?
18–34 35–55 56 and older
119
134
114
125
153
138
123
147
135
110
154
163
140
128
159
134
120
116
38)
Conduct a Tukey multiple comparison. Display the confidence intervals in a table. State which population means can be
declared different.
39)
Use a 95% family confidence level.
Sample 1 Sample 2 Sample 3 Sample 4 Sample 5
6 5 9 2 12
710 4 3 9
5 6 5 3 9
8 8 2
4 5
39)
16

Preliminary data analyses indicate that it is reasonable to consider the assumptions for one–way ANOVA satisfied.
Perform the required hypothesis test using the critical–value approach.
40)
At the 0.025 significance level, do the data provide sufficient evidence to conclude that a
difference exists between the population means of the three different brands? The sample
data are given below.
Brand A
32
34
37
33
36
39
Brand B
27
24
33
30
Brand C
22
25
32
22
21
40)
Preliminary data analyses indicate that it is reasonable to consider the assumptions for one–way ANOVA satisfied. Use
Minitab to perform the required hypothesis test using the p–value approach.
41)
The data below represent the weight losses for people on three different exercise programs.
Exercise A
2.5
8.8
7.3
9.8
5.1
Exercise B
5.8
4.9
1.1
7.8
1.2
Exercise C
4.3
6.2
5.8
8.1
7.9
At the 1% significance level, does it appear that a difference exists in the true mean weight
loss produced by the three exercise programs?
41)
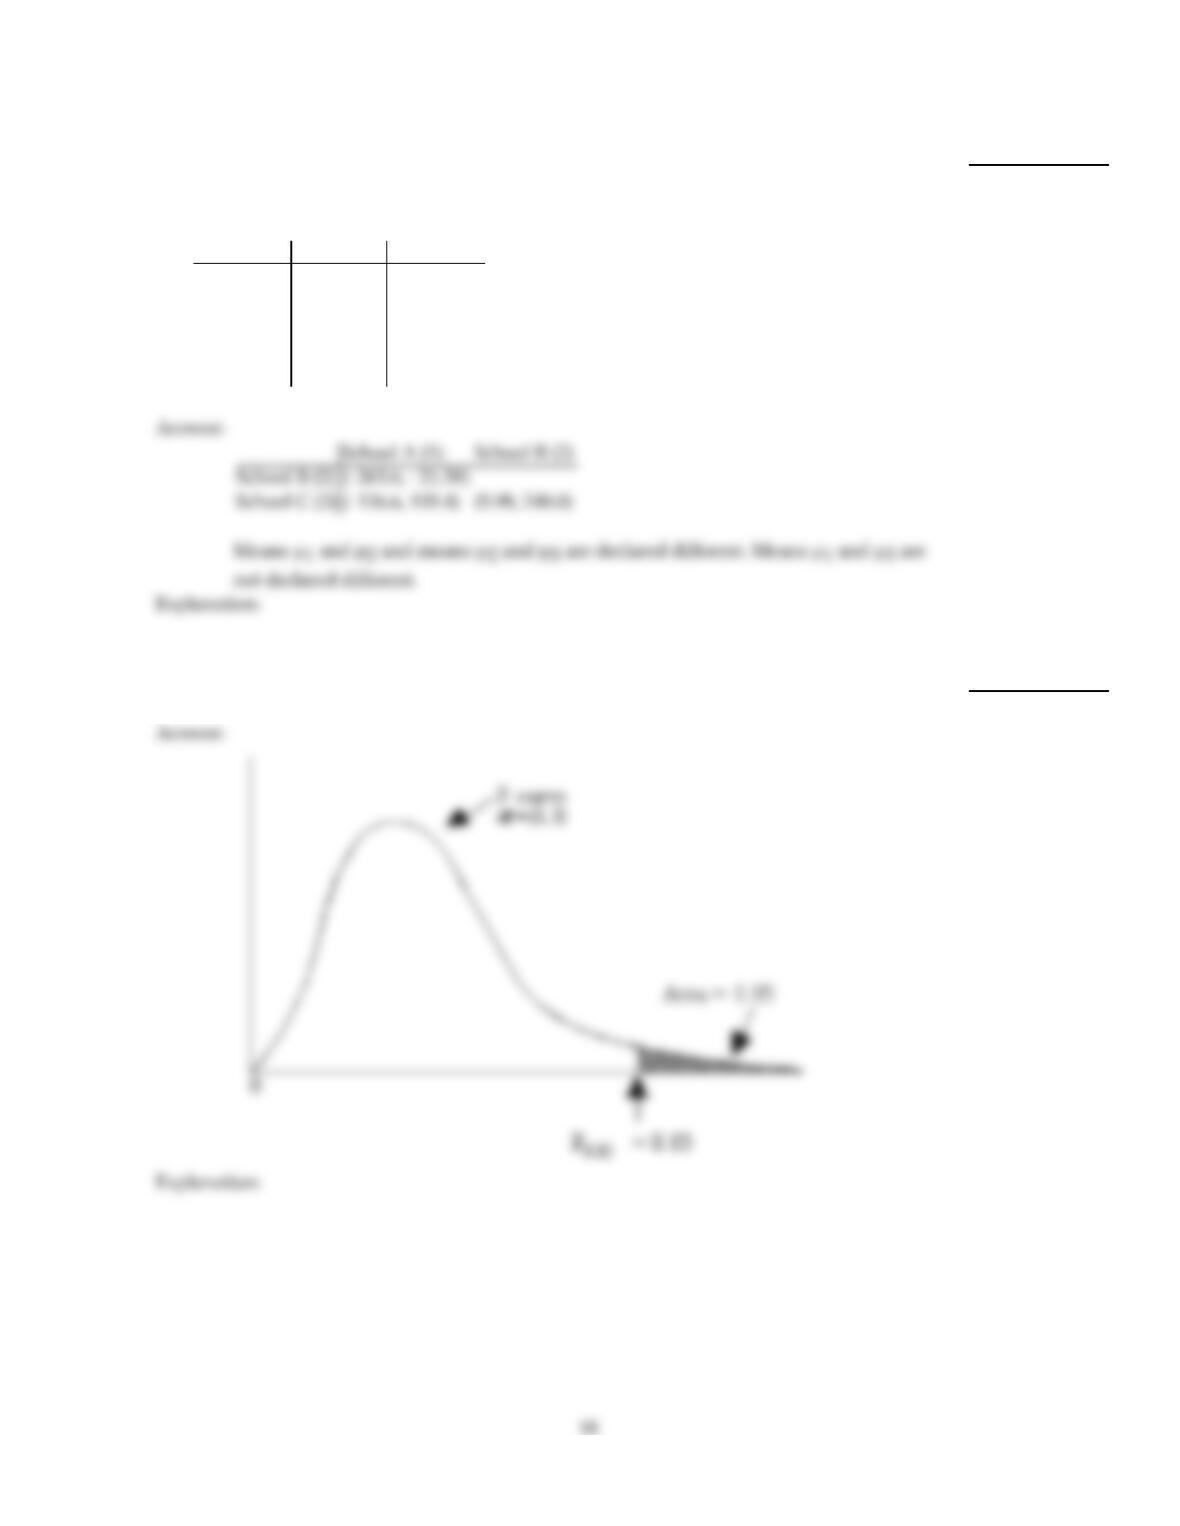
Conduct a Tukey multiple comparison. Display the confidence intervals in a table. State which population means can be
declared different.
42)
Perform a Tukey multiple comparison to compare the SAT math scores of students at three
different schools. Use a 99% family confidence level. Independent random samples of
students from the three different schools yielded the following SAT math scores.
School A School B School C
420 600 454
390 540 385
365 665 400
462 510 490
480 515 466
42)
Provide an appropriate response.
43)
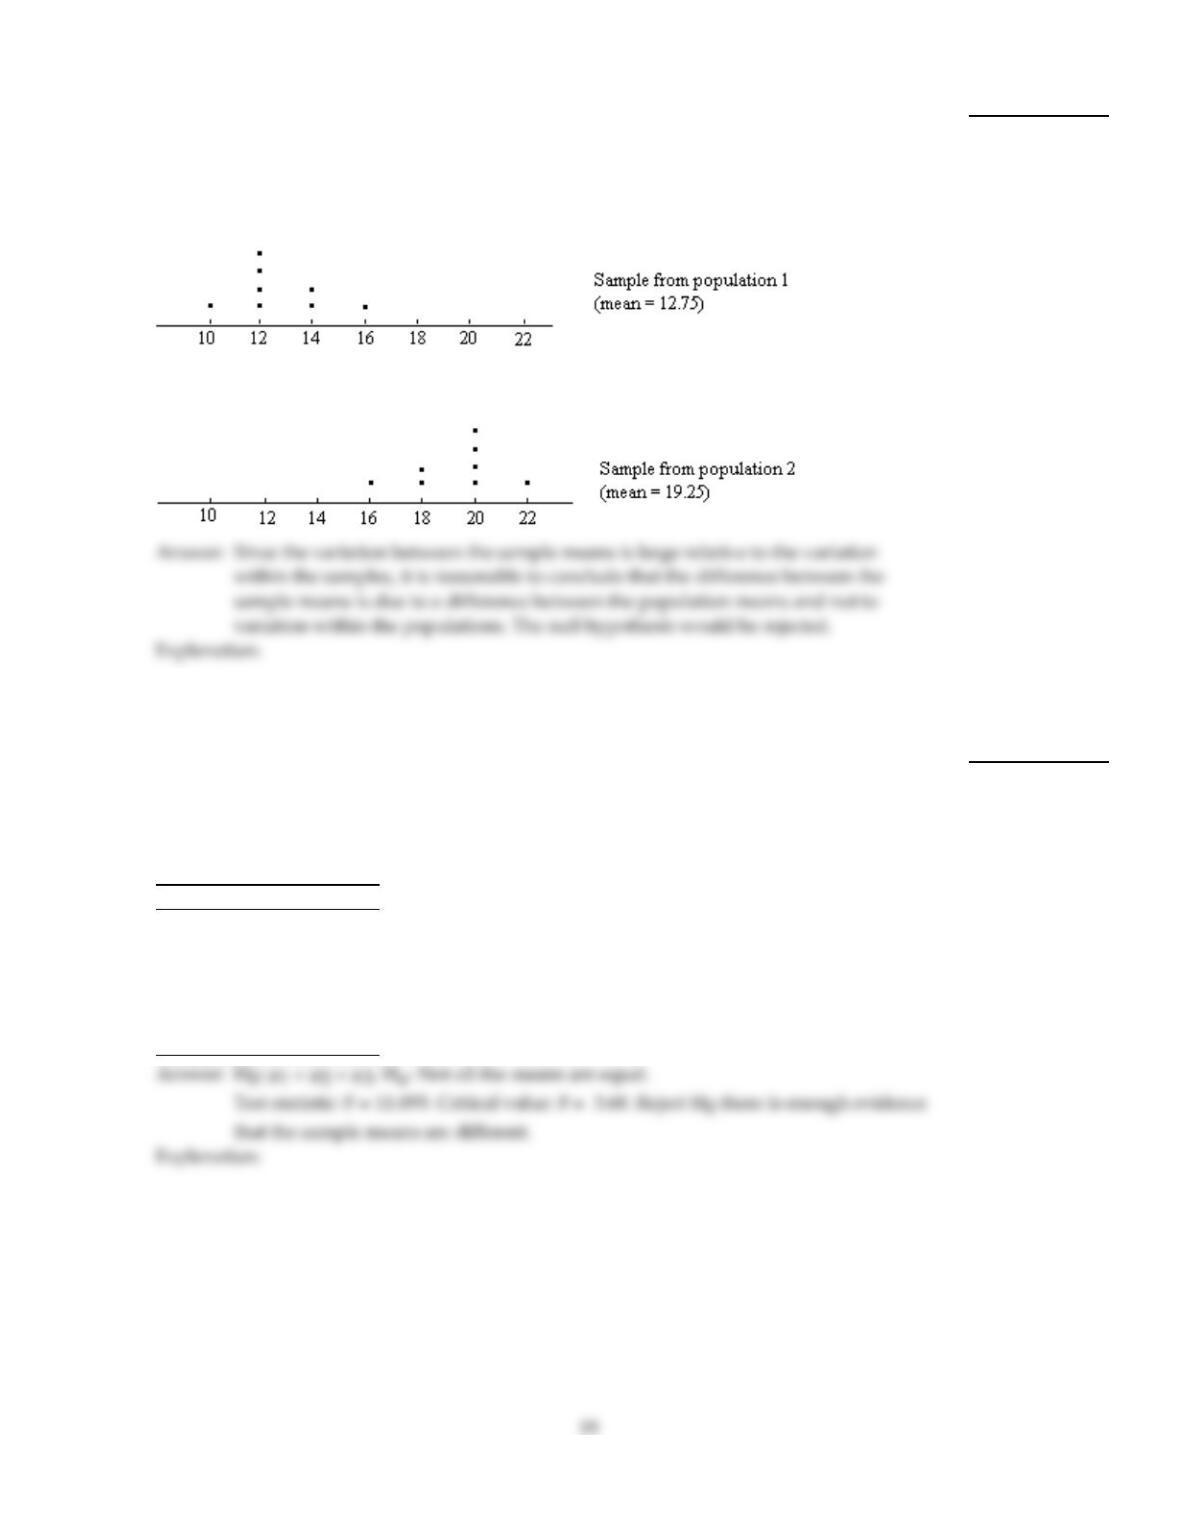
For an F–curve with df = (8, 3), find the F–value having area 0.05 to its right and illustrate
your answer with a sketch.
43)
44)
A one–way ANOVA is to be performed. Independent random samples are taken from two
populations. The sample data are depicted in the dotplot below. Is it reasonable to
conclude that the difference between the sample means is due to a difference between the
population means and not to variation within the populations? Do you think the null
hypothesis would be rejected? Explain your thinking.
44)
Preliminary data analyses indicate that it is reasonable to consider the assumptions for one–way ANOVA satisfied.
Perform the required hypothesis test using the critical–value approach.
45)
A medical researcher wishes to try three different techniques to lower blood pressure of
patients with high blood pressure. The subjects are randomly selected and assigned to one
of three groups. Group 1 is given medication, Group 2 is given an exercise program, and
Group 3 is assigned a diet program. At the end of six weeks, each subject’s blood pressure
is recorded. Test the claim that there is no difference among the means. Use = 0.05.
Group 1 Group 2 Group 3
13 8 6
12 212
11 3 4
15 5 4
9 4 9
8 0 8
45)
Provide an appropriate response.
46)
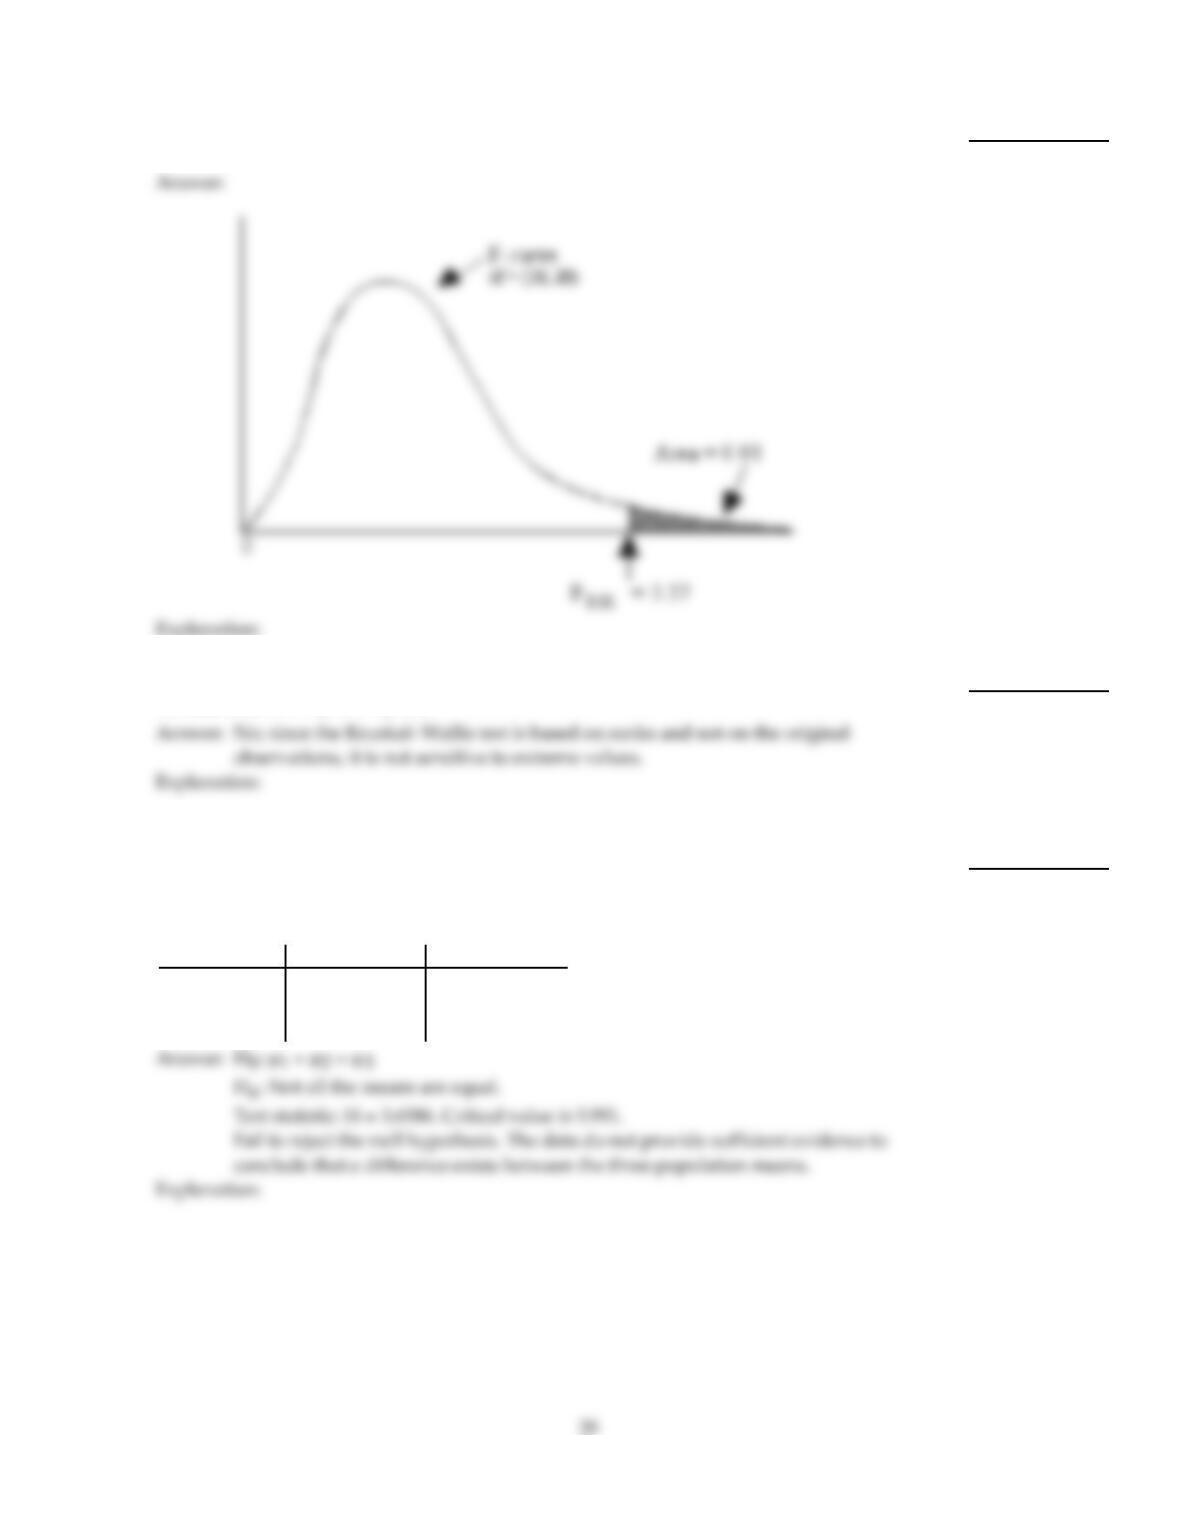
For an F–curve with df = (10, 20), find the F–value having area 0.01 to its right and
illustrate your answer with a sketch.
46)
47)
Do you think that the Kruskal–Wallis test is likely to be sensitive to extreme
values/outliers? Why or why not?
47)
Perform a Kruskal–Wallis test using the critical–value approach.
48)
SAT scores for students selected randomly from three different schools are shown below.
At the 0.05 significance level, do the data provide sufficient evidence to conclude that a
difference exists between the three population means?
School A School C School B
550 480 670
400 600 520
500 620 700
550 760
460 580 620
380 600 470
450
48)