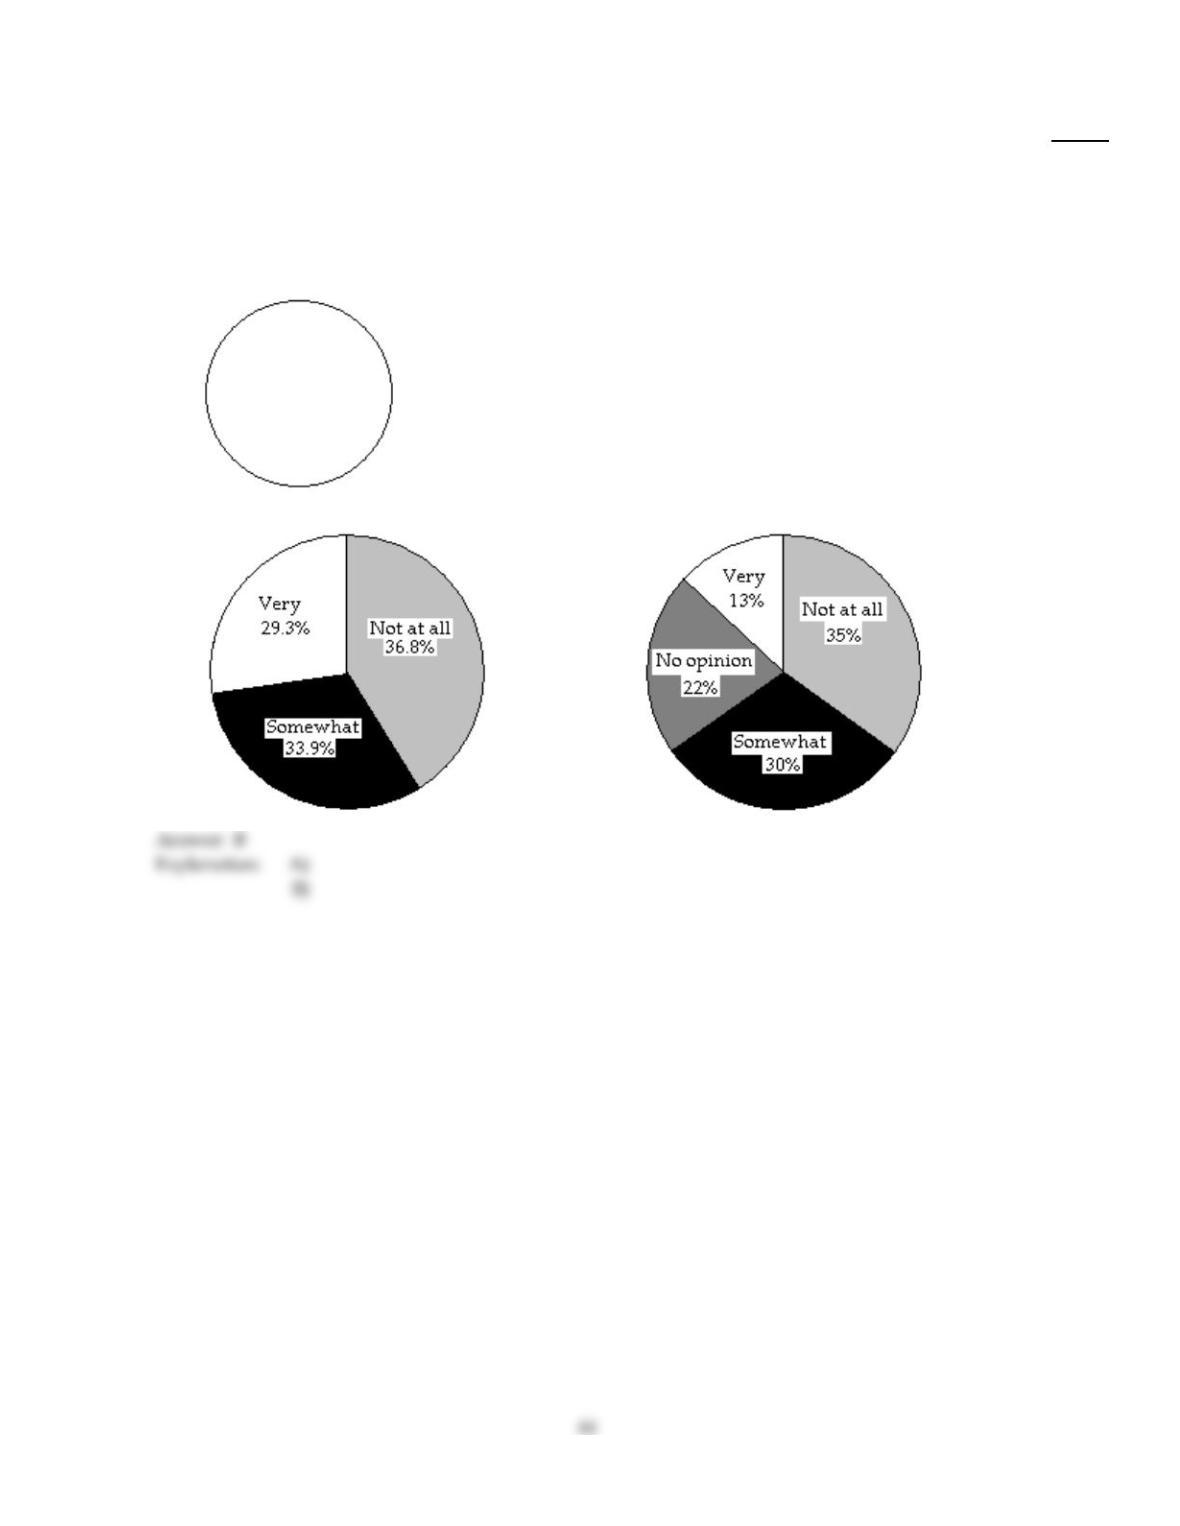
Construct a pie chart representing the given data set.
116)
The data below represent the results of a poll in which the following question was asked: “To what
degree are you satisfied with your current health insurance?”
Very 13%
Somewhat 30%
Not at All 35%
No opinion 22%
116)
A)
B)
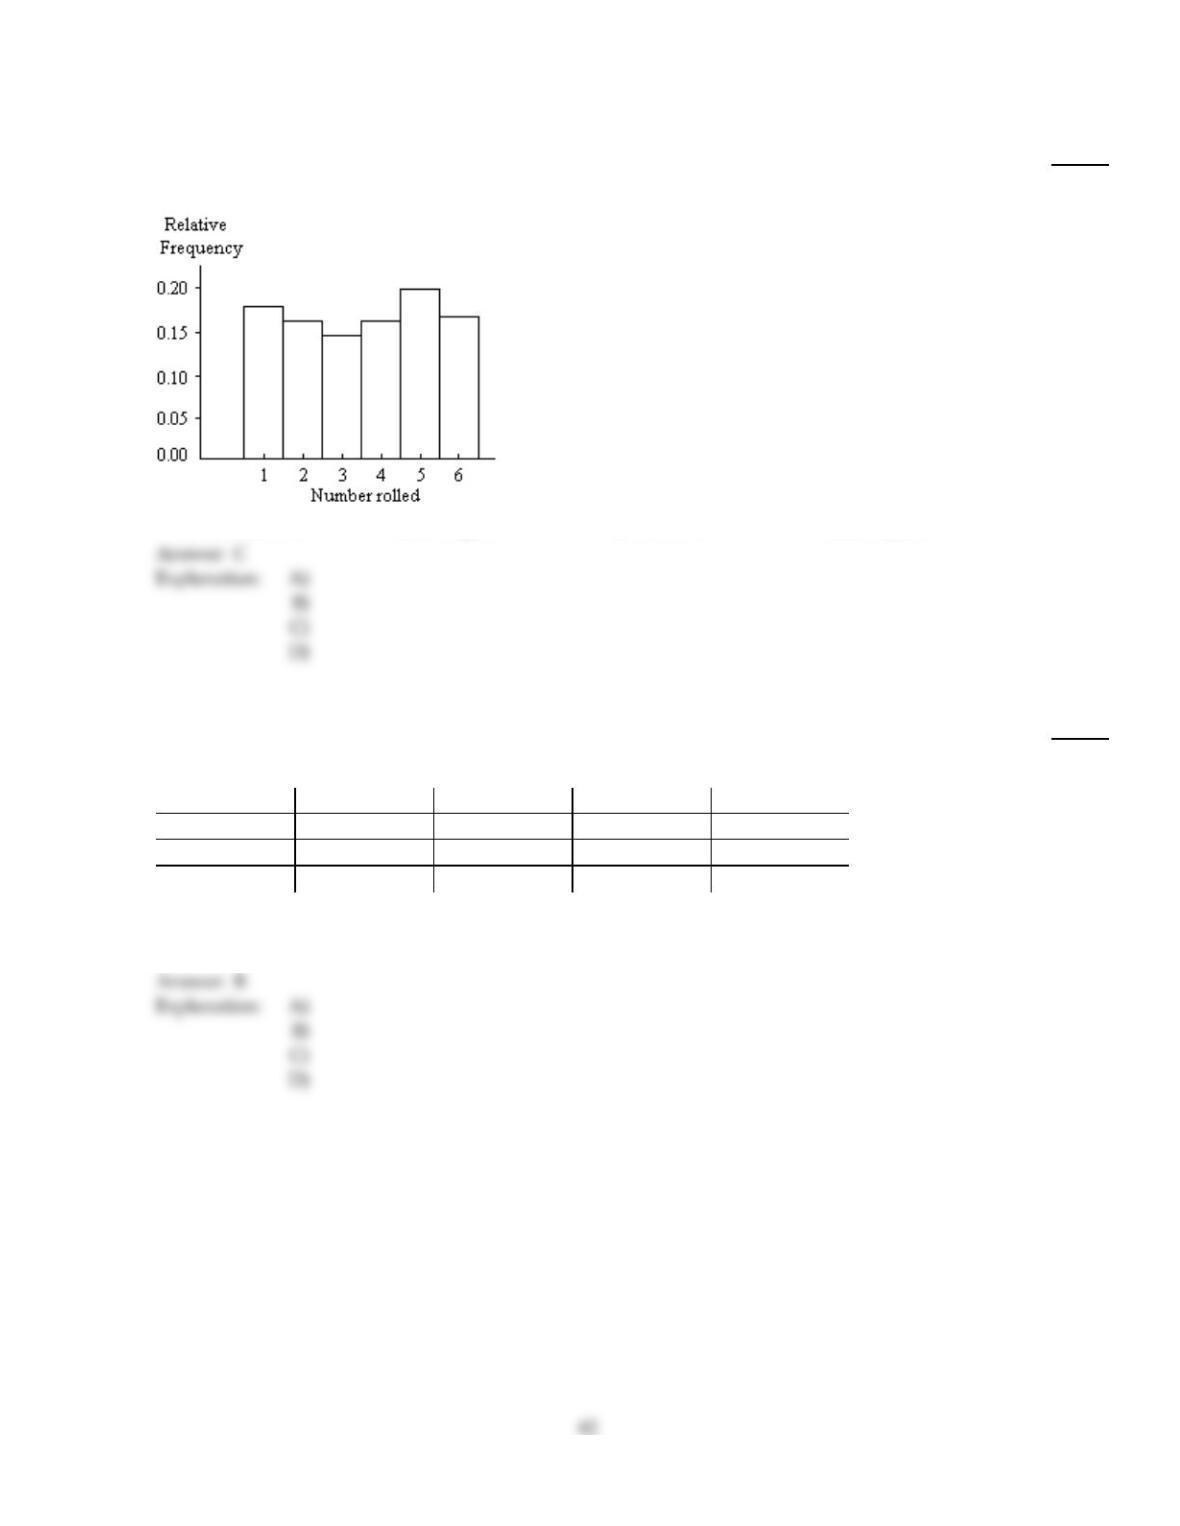
A graphical display of a data set is given. Identify the overall shape of the distribution as (roughly) bell–shaped,
triangular, uniform, reverse J–shaped, J–shaped, right skewed, left skewed, bimodal, or multimodal.
117)
A die was rolled 200 times and a record was kept of the numbers obtained. The results are shown
in the relative frequency histogram below.
117)
A)
Left skewed
B)
Triangular
C)
Uniform
D)
J–shaped
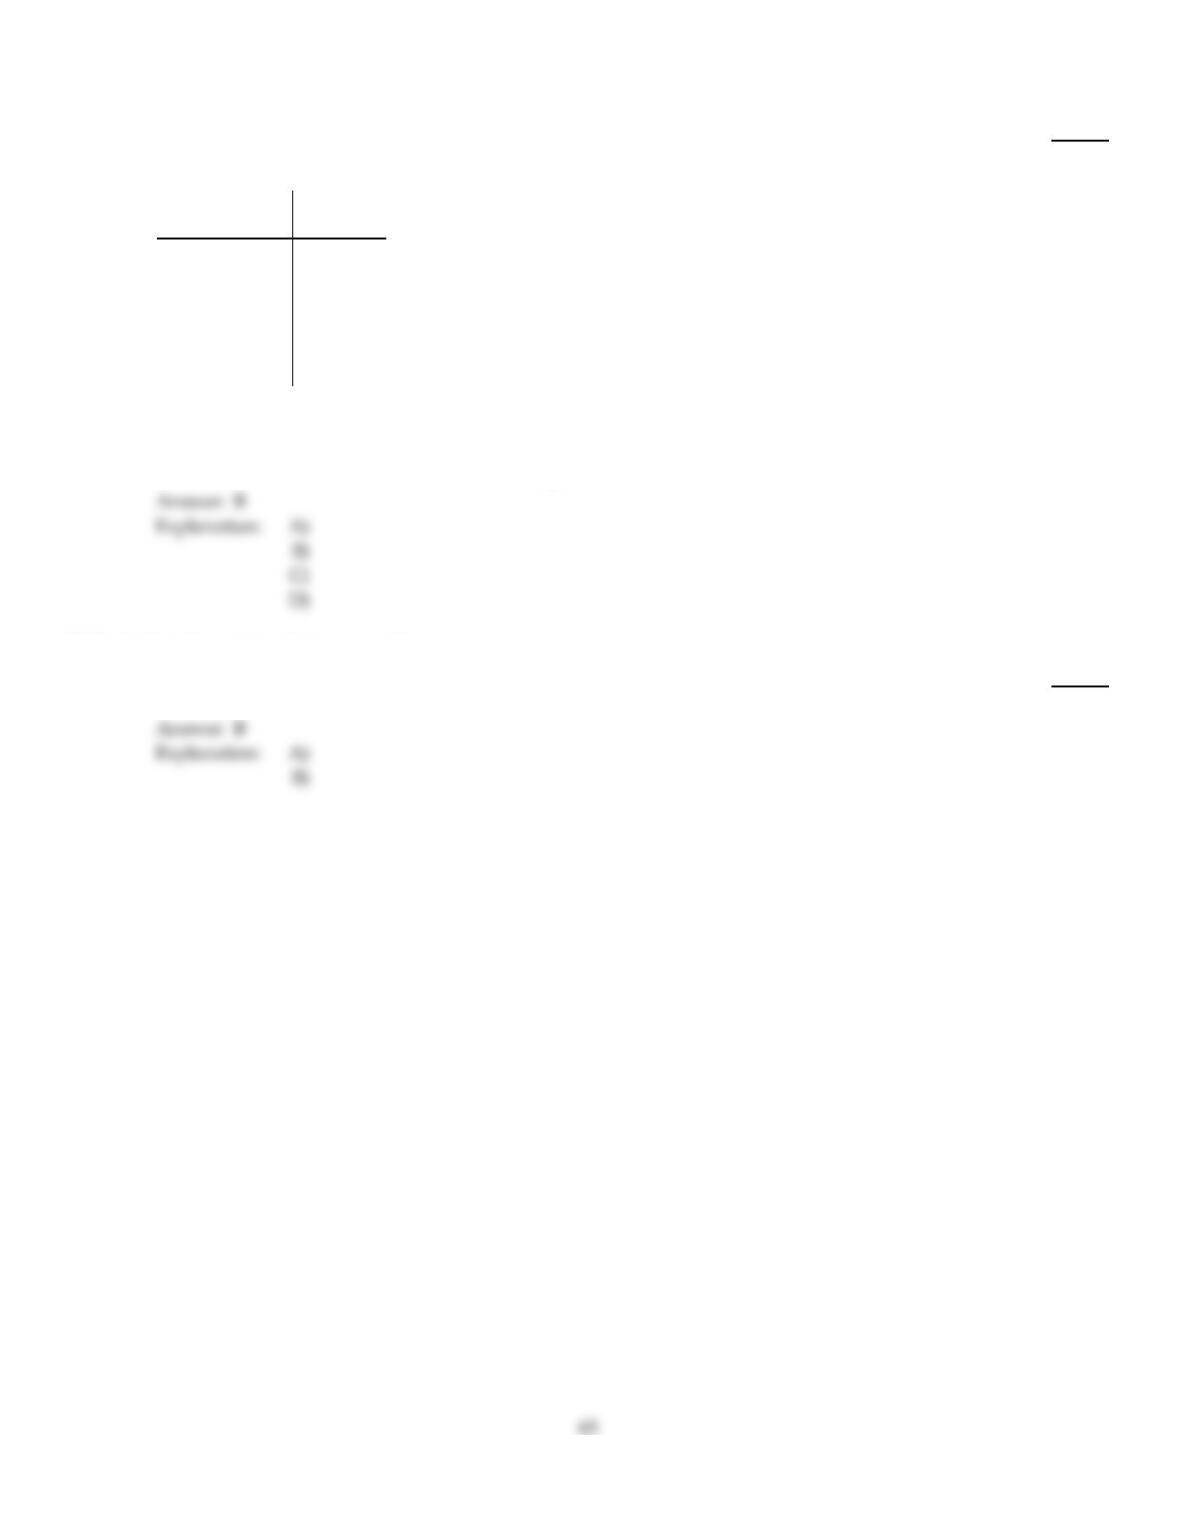
Complete the contingency table and use it to solve the problem.
118)
The partially filled contingency table gives the frequencies of the data on age (in years) and sex
from the residents of a retirement home.
Age (yrs)
60–69 70–79 Over 79 Total
Male 3 8 5
Female 17 3 4
Total
What percentage of residents are female ?
118)
A)
60.4%
B)
60%
C)
59.5%
D)
61%
Provide the requested table entry.
119)
The data in the following table represent heights of students at a highschool. Find the value of the
missing entry.
Height
(centimeters)
Relative
frequency
142–under 152 0.03
152–under 162 0.21
162–under 172 0.27
172–under 182 0.28
182–under 192
192–under 202 0.02
119)
A)
0.21
B)
0.19
C)
19%
D)
The value cannot be determined from the given data.
Tell whether the statement is true or false.
120)
The set of possible values that a variable can take constitutes the data.
120)
A)
True
B)
False
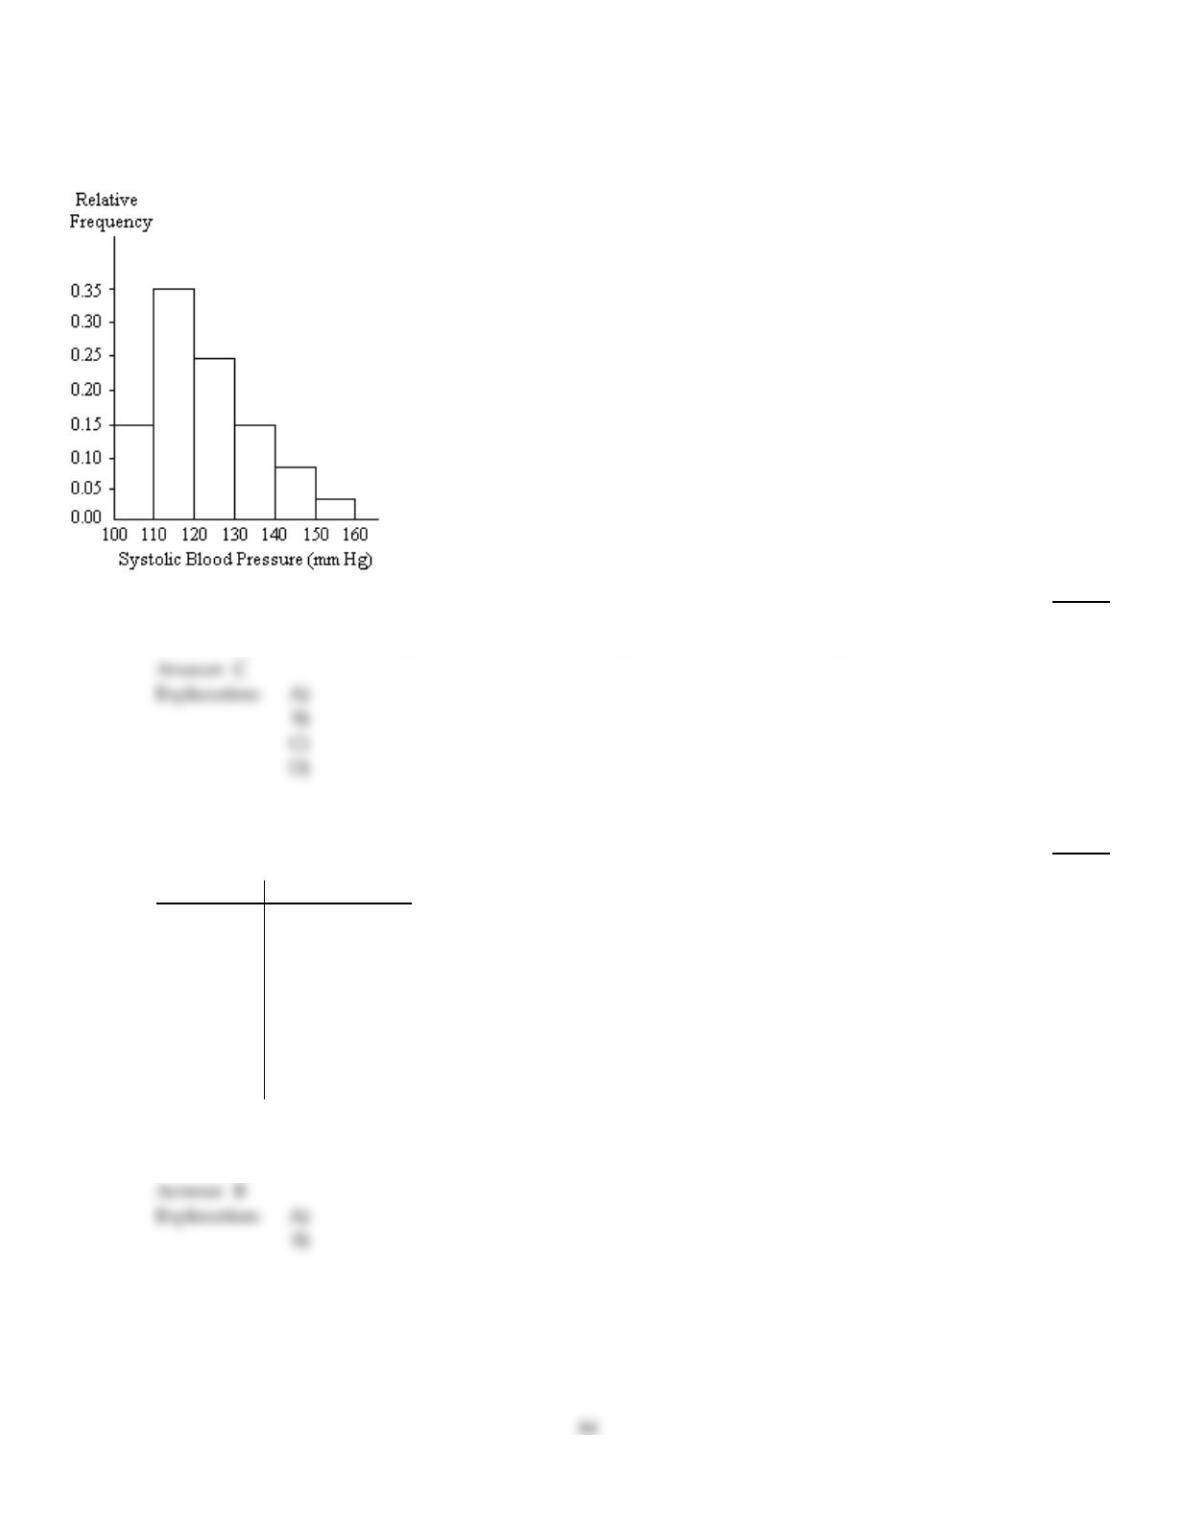
A nurse measured the blood pressure of each person who visited her clinic. Following is a relative–frequency histogram
for the systolic blood pressure readings for those people aged between 25 and 40. Use the histogram to answer the
question. The blood pressure readings were given to the nearest whole number.
121)
Given that 700 people were aged between 25 and 40, approximately how many had a systolic blood
pressure reading between 140 and 149 inclusive?
121)
A)
6
B)
560
C)
56
D)
8
Classify the data as either qualitative or quantitative.
122)
A large record company reported the following sales figures for various music media last year.
Media Sales ($ millions)
CD 1477.3
CD single 1.8
MP3 65.9
Vinyl 2.6
Music video 531.4
Mini Disc 0.3
DVD 108.2
Cassette 3.4
What kind of data is provided by the information in the second column?
122)
A)
Qualitative
B)
Quantitative
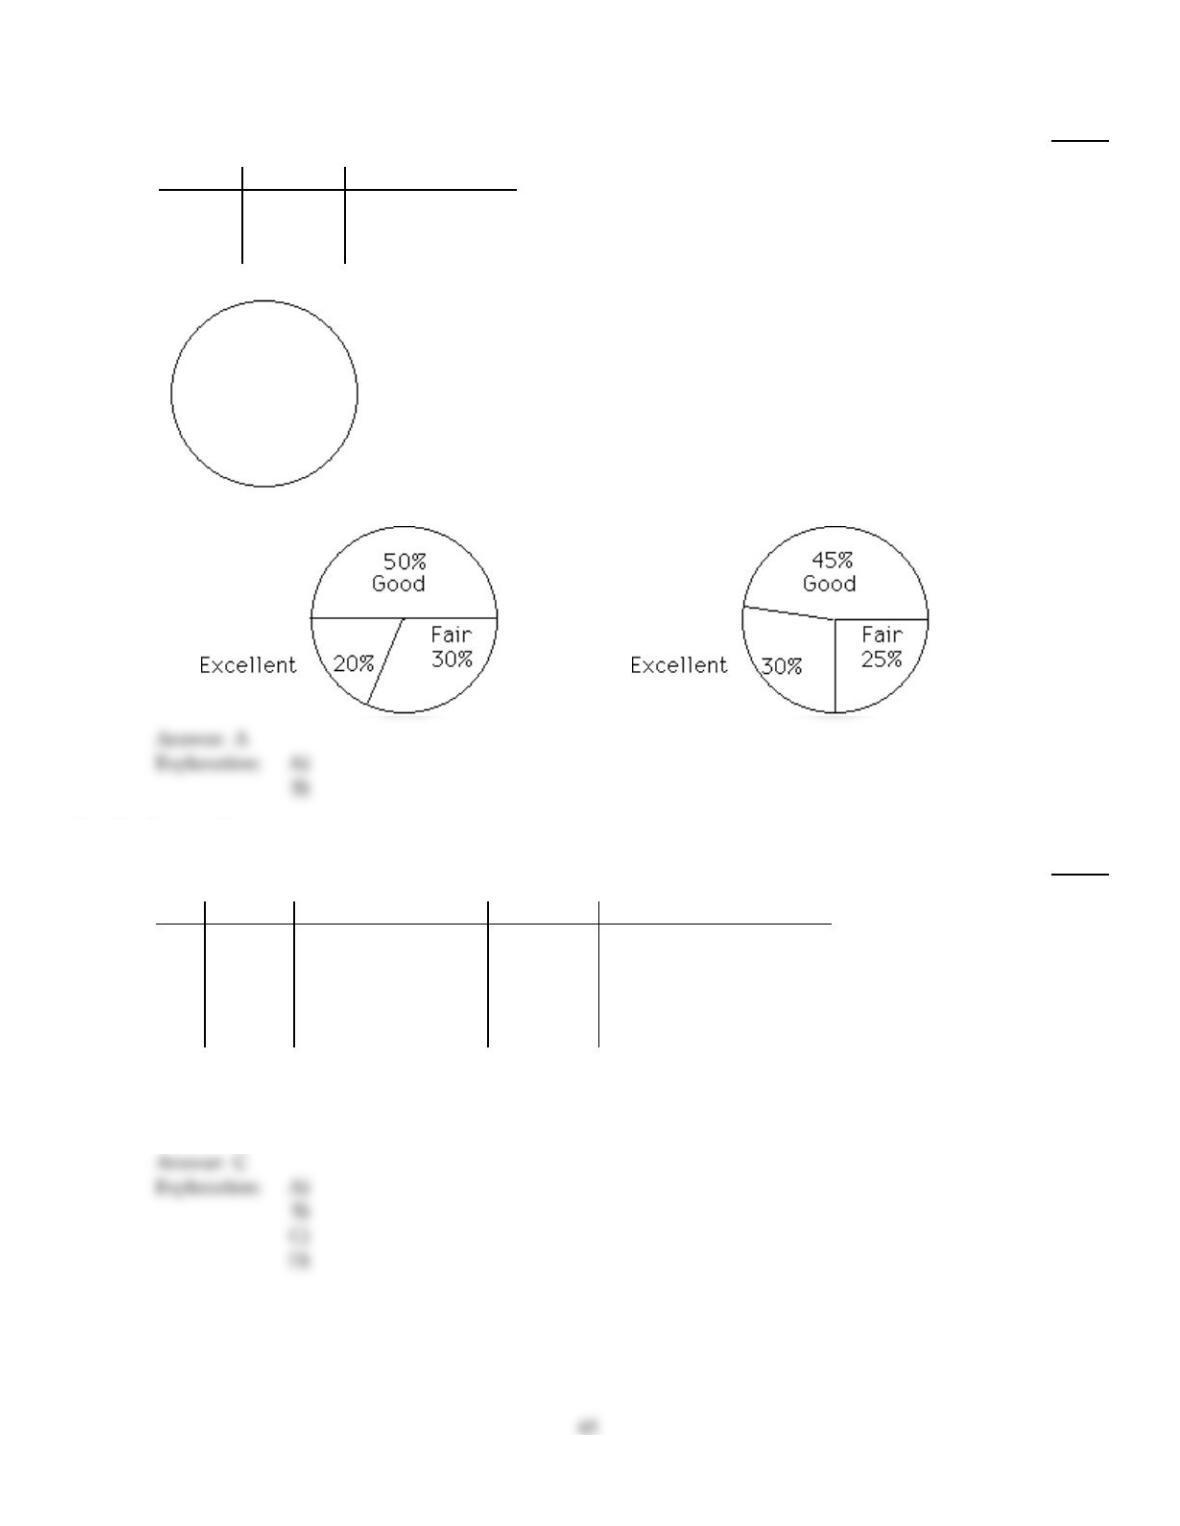
Construct a pie chart representing the given data set.
123)
1000 movie critics rated a movie. The following data give the rating distribution.
Rating Frequency Relative Frequency
Excellent 200 0.20
Good 500 0.50
Fair 300 0.30
123)
A)
B)
Identify the variable.
124)
The following table gives the top five movies at the box office this week.
Rank Last week Movie title Studio Box office sales ($ millions)
1N/A Pirate Adventure Movie Giant 35.2
2 2 Secret Agent Files G.M.G. 19.5
3 1 Epic Super Hero Team 21st Century 14.3
4 5 Reptile Ride Movie Giant 10.1
5 4 Must Love Cats Dreamboat 9.9
Identify the variable under consideration in the first column?
124)
A)
movie title
B)
Pirate Adventure
C)
rank this week
D)
last week’s rank
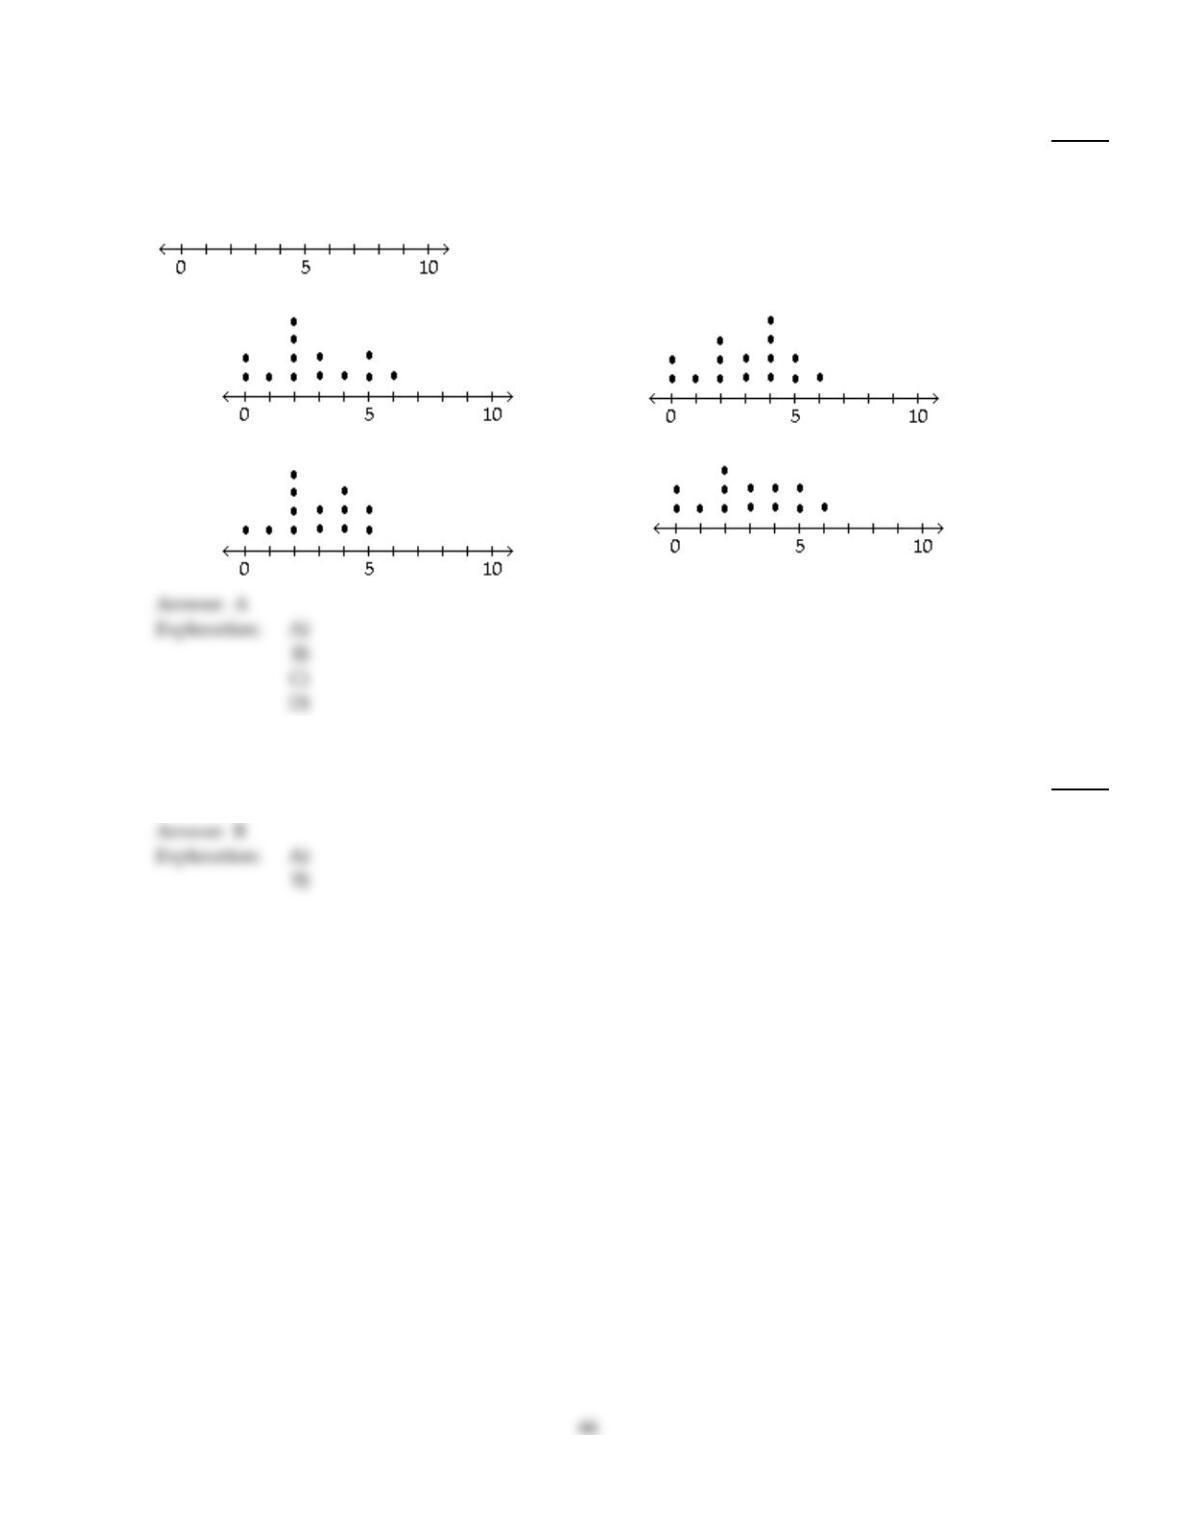
Construct a dotplot for the given data.
125)
A manufacturer records the number of errors each work station makes during the week. The data
are as follows.
6 3 2 3 5 2 0 2 5 4 2 0 1
125)
A)
B)
C)
D)
Classify the data as either discrete or continuous.
126)
The temperature in Manhattan at 1 p.m. on New Year‘s Day was 34.1°F.
126)
A)
Discrete
B)
Continuous
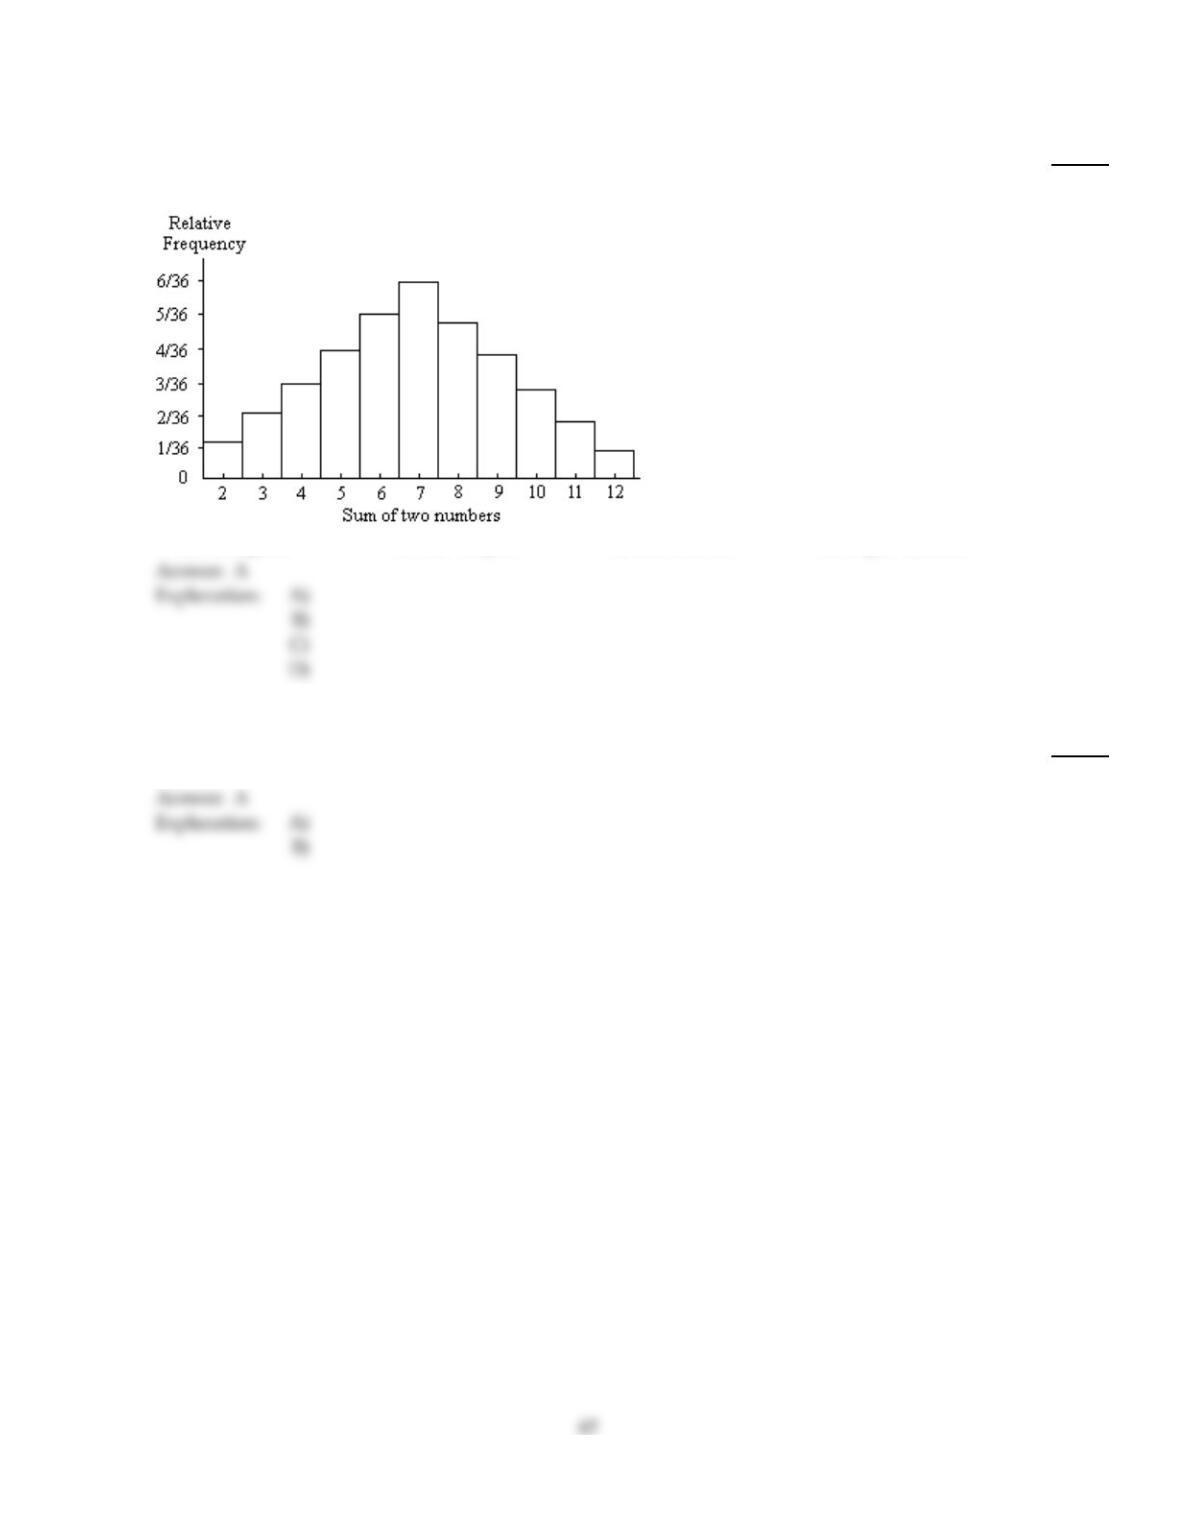
A graphical display of a data set is given. Identify the overall shape of the distribution as (roughly) bell–shaped,
triangular, uniform, reverse J–shaped, J–shaped, right skewed, left skewed, bimodal, or multimodal.
127)
Two dice were rolled and the sum of the two numbers was recorded. This procedure was repeated
400 times. The results are shown in the relative frequency histogram below.
127)
A)
Triangular
B)
Bell–shaped
C)
Left skewed
D)
Right–skewed
Classify the data as either discrete or continuous.
128)
The number of freshmen entering college in a certain year is 621.
128)
A)
Discrete
B)
Continuous
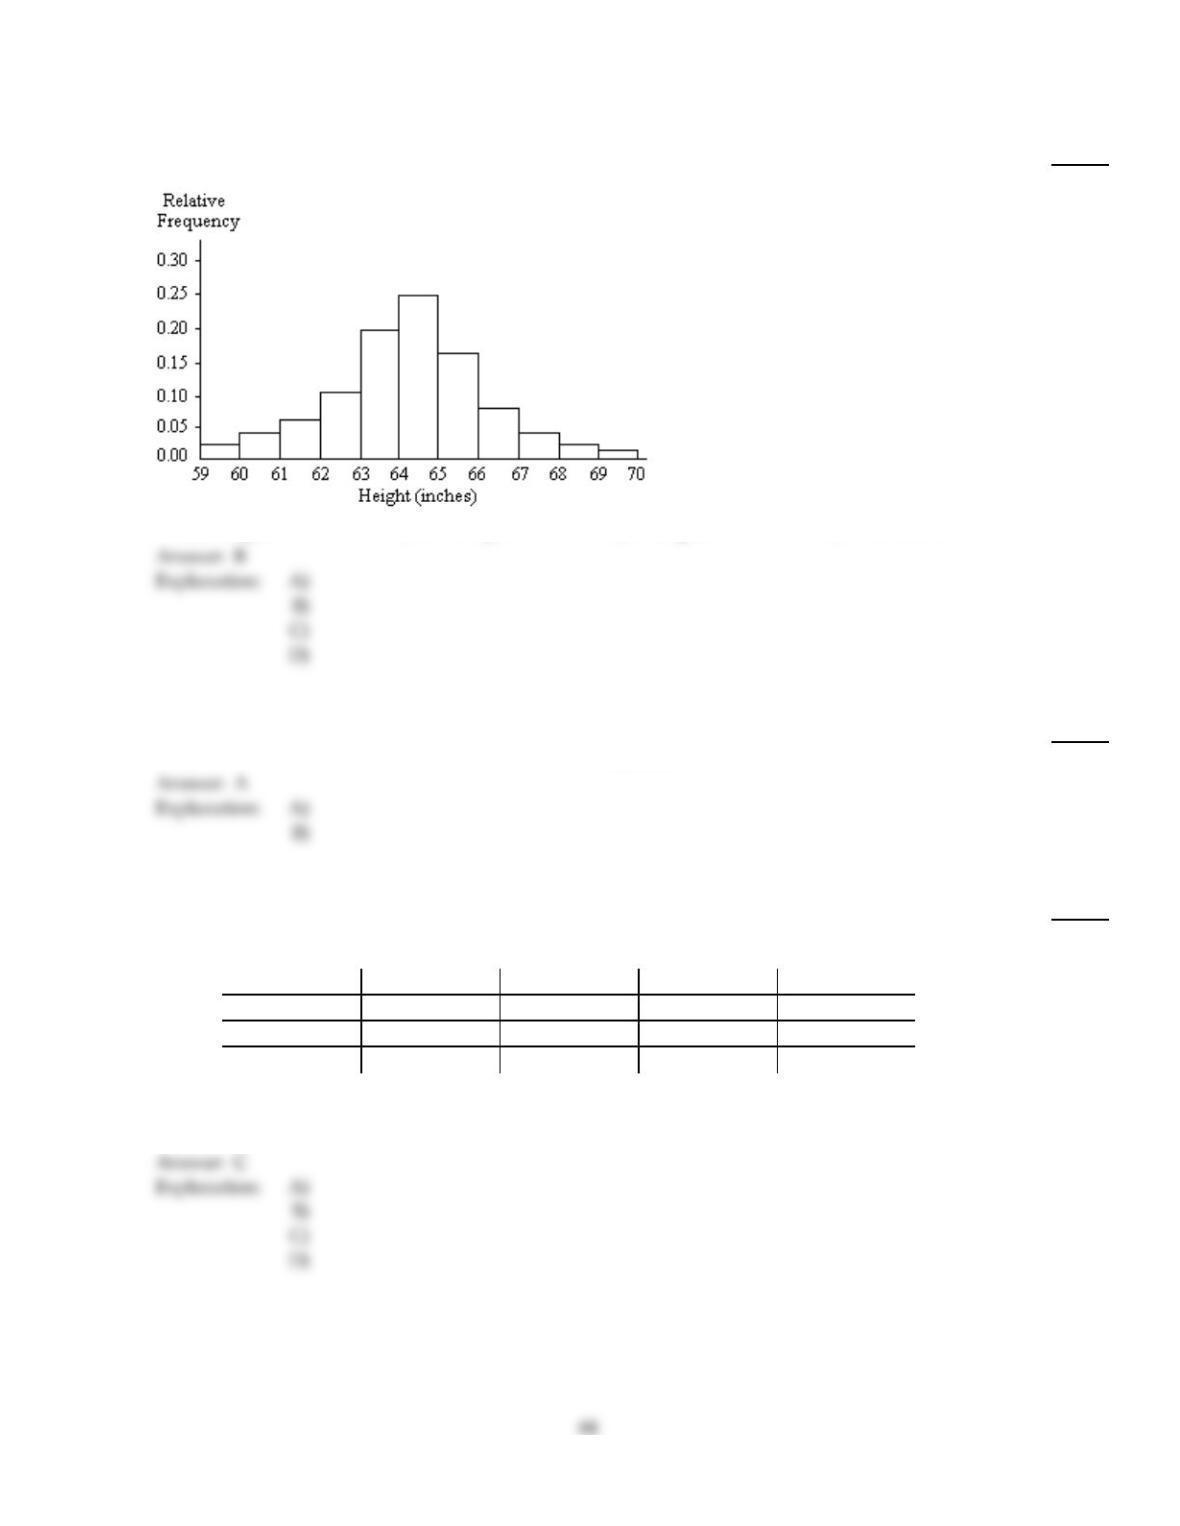
A graphical display of a data set is given. Identify the overall shape of the distribution as (roughly) bell–shaped,
triangular, uniform, reverse J–shaped, J–shaped, right skewed, left skewed, bimodal, or multimodal.
129)
A relative frequency histogram for the heights of a sample of adult women is shown below.
129)
A)
J–shaped
B)
Bell–shaped
C)
Triangular
D)
Left skewed
Tell whether the statement is true or false.
130)
Arranging the age of students in a class in from youngest to oldest yields ordinal data.
130)
A)
True
B)
False
Complete the contingency table and use it to solve the problem.
131)
The partially filled contingency table gives the relative frequencies of the data on age (in years) and
sex from the residents of a retirement home.
Age (yrs)
60–69 70–79 Over 79 Total
Male 0.18 0.1 0.12
Female 0.2 0.2 0.2
Total 1
What percentage of residents are males over 79?
131)
A)
6.6%
B)
14%
C)
12%
D)
11.5%
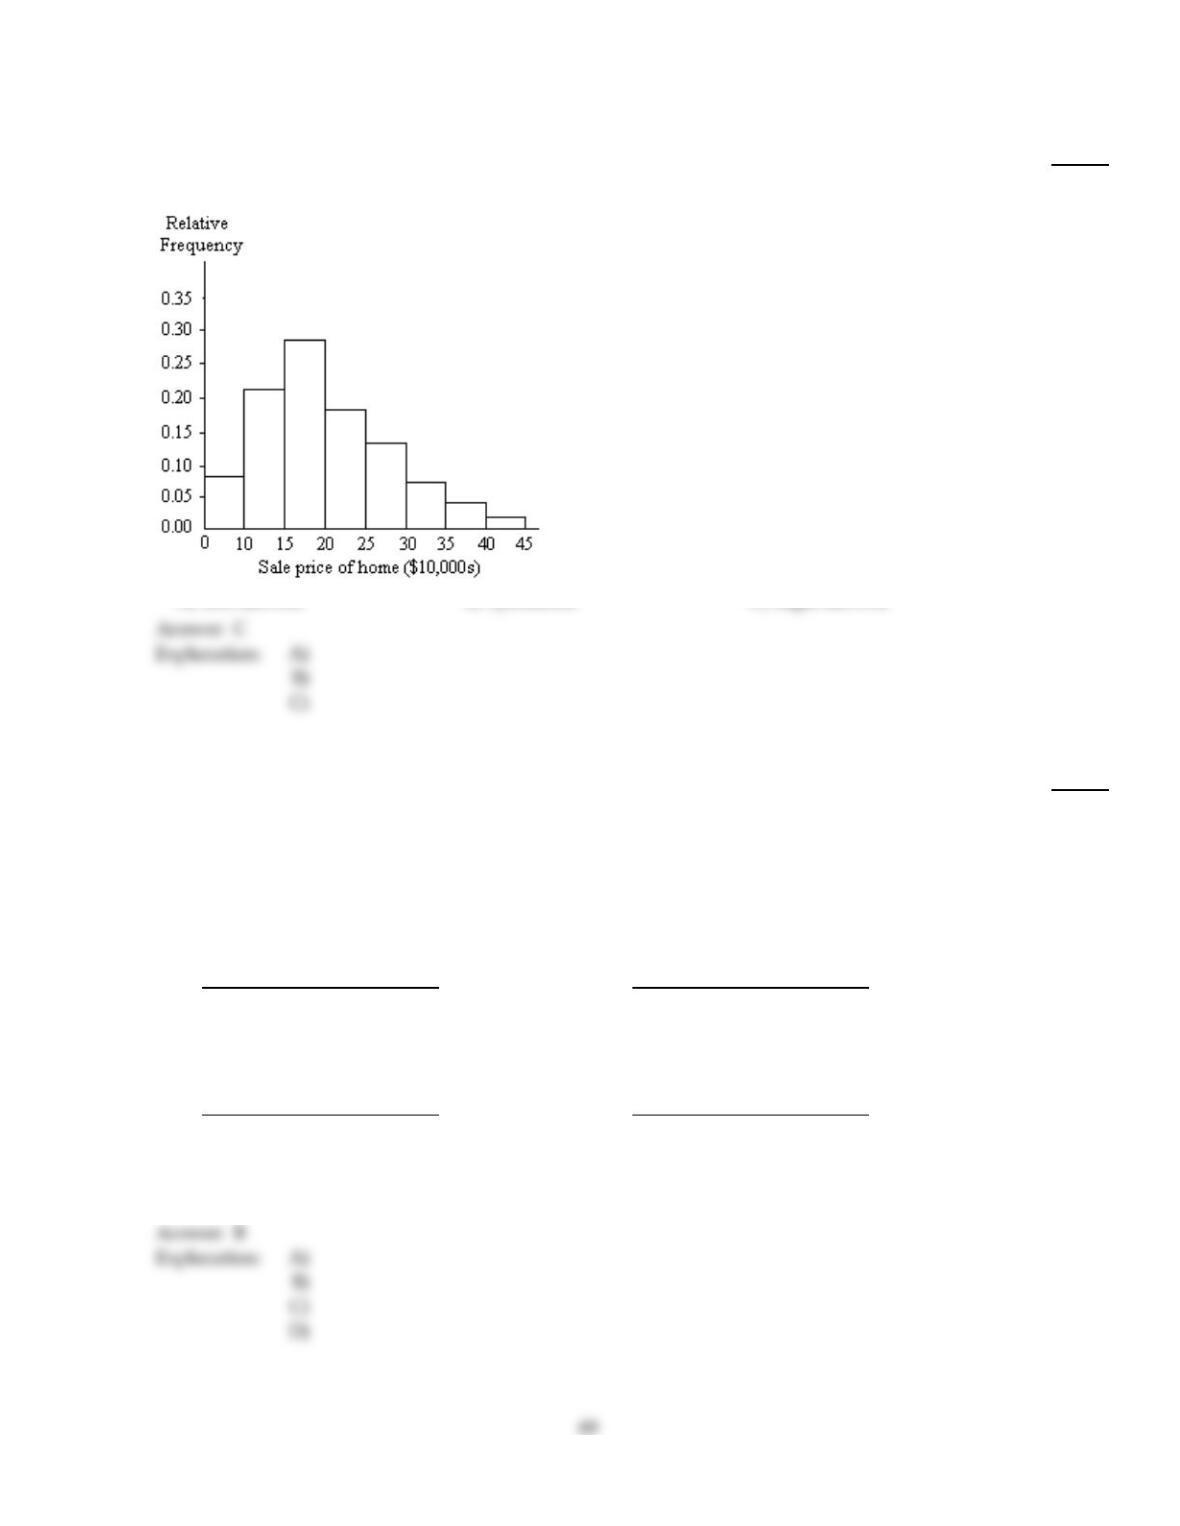
A graphical display of a data set is given. State whether the distribution is (roughly) symmetric, right skewed, or left
skewed.
132)
A relative frequency histogram for the sale prices of homes sold in one city during 2006 is shown
below.
132)
A)
Left skewed
B)
Symmetric
C)
Right skewed
Construct a frequency distribution for the given qualitative data.
133)
The blood types for 40 people who agreed to participate in a medical study were as follows.
O A A O O AB O B A O
A O A B O O O AB A A
A B O A A O O B O O
O A O O A B O O A AB
Construct a frequency distribution for the data.
133)
A)
Blood type Frequency
O20
A13
B 4
AB 3
B)
Blood type Frequency
O19
A13
B 5
AB 3
C)
Blood type Frequency
O18
A14
B 5
AB 3
D)
Blood type Frequency
O19
A11
B 5
AB 2
Identify the variable.
134)
A large record company reported the following sales figures for various music media last year.
Media Sales ($ millions)
CD 1477.3
CD single 1.8
MP3 65.9
Vinyl 2.6
Music video 531.4
Mini Disc 0.3
DVD 108.2
Cassette 3.4
Identify the variable under consideration in the second column?
134)
A)
sales
B)
$ millions
C)
CD single
D)
media
Use single–value grouping to organize these data into a frequency distribution.
135)
A car insurance company conducted a survey to find out how many car accidents people had been
involved in. They selected a sample of 32 adults between the ages of 30 and 70 and asked each
person how many accidents they had been involved in the past ten years. The following data were
obtained.
0 1 0 3 2 1 0 2
1 1 1 0 2 0 4 1
2 0 0 1 0 2 1 3
1 3 0 0 1 0 5 4
Construct a frequency distribution for the number of car accidents.
135)
A)
Number of
accidents Frequency
012
1 9
2 5
3 3
4 2
5 1
B)
Number of
accidents Frequency
011
110
2 5
3 3
4 2
5 1
C)
Number of
accidents Frequency
011
110
2 5
3 3
4 1
5 1
D)
Number of
accidents Frequency
110
2 5
3 3
4 2
5 1
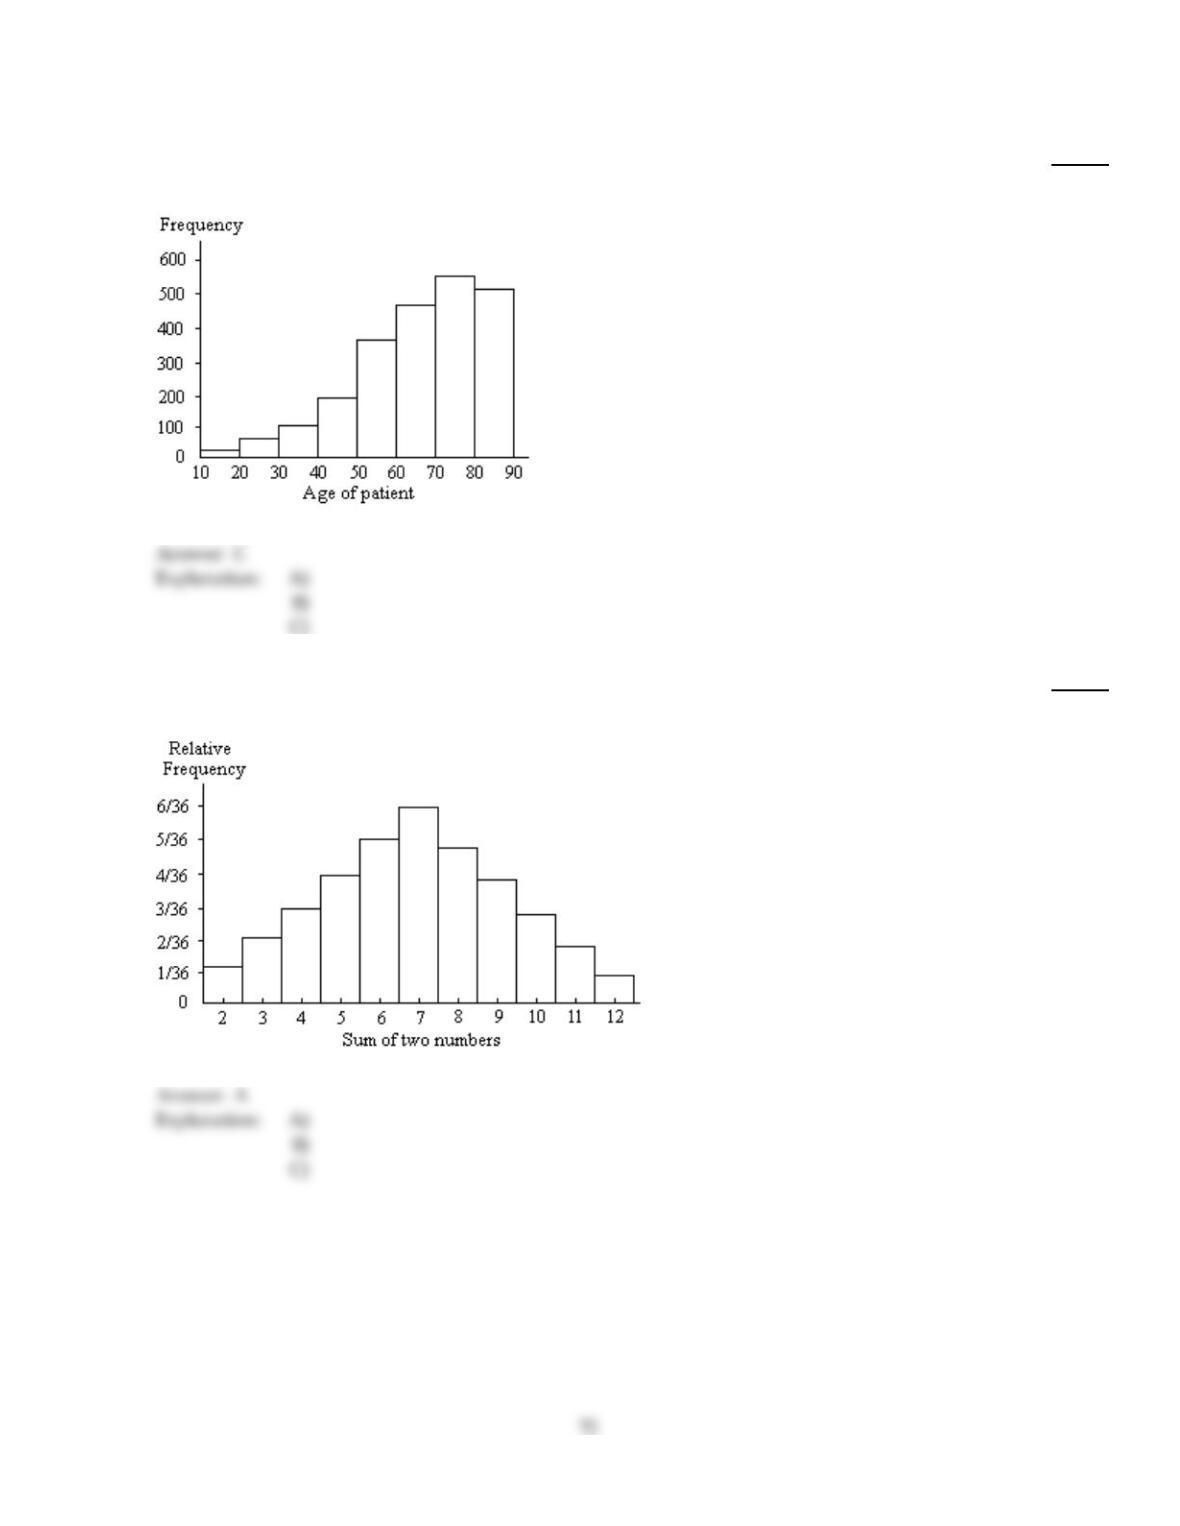
A graphical display of a data set is given. State whether the distribution is (roughly) symmetric, right skewed, or left
skewed.
136)
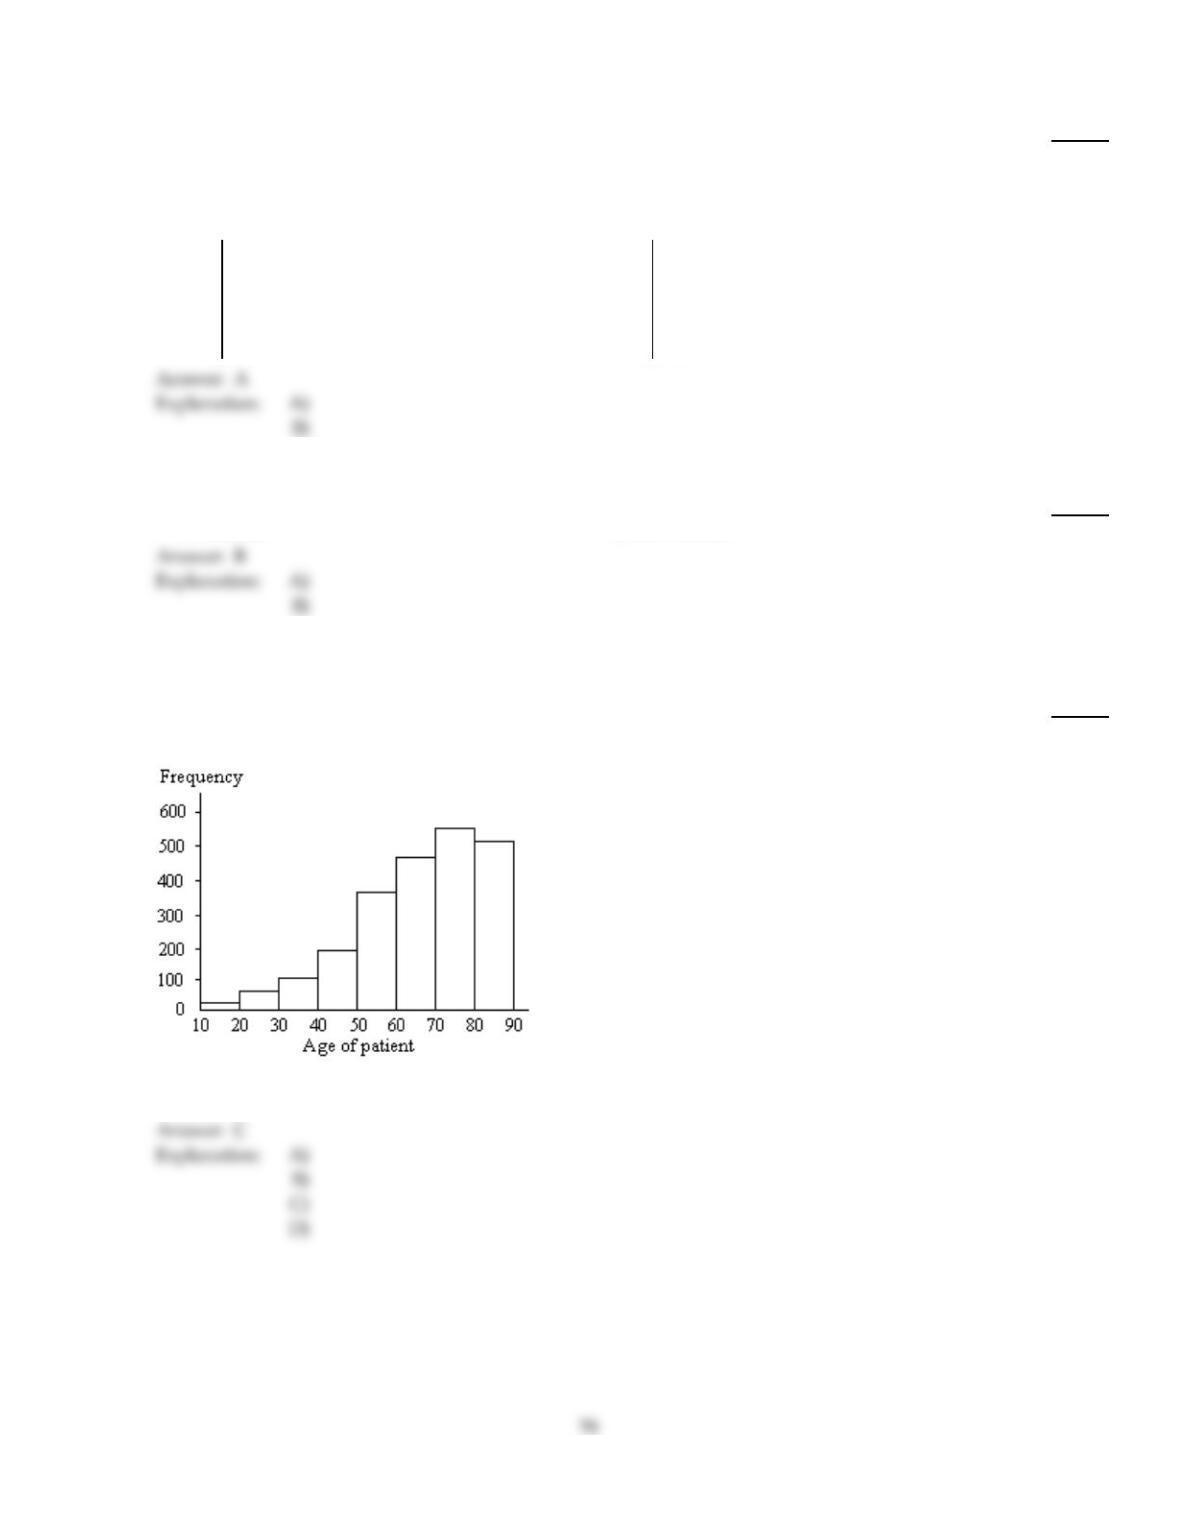
The ages of a group of patients being treated at one hospital for osteoporosis are summarized in the
frequency histogram below.
136)
A)
Right skewed
B)
Symmetric
C)
Left skewed
137)
Two dice were rolled and the sum of the two numbers was recorded. This procedure was repeated
400 times. The results are shown in the relative frequency histogram below.
137)
A)
Symmetric
B)
Right skewed
C)
Left skewed
138)
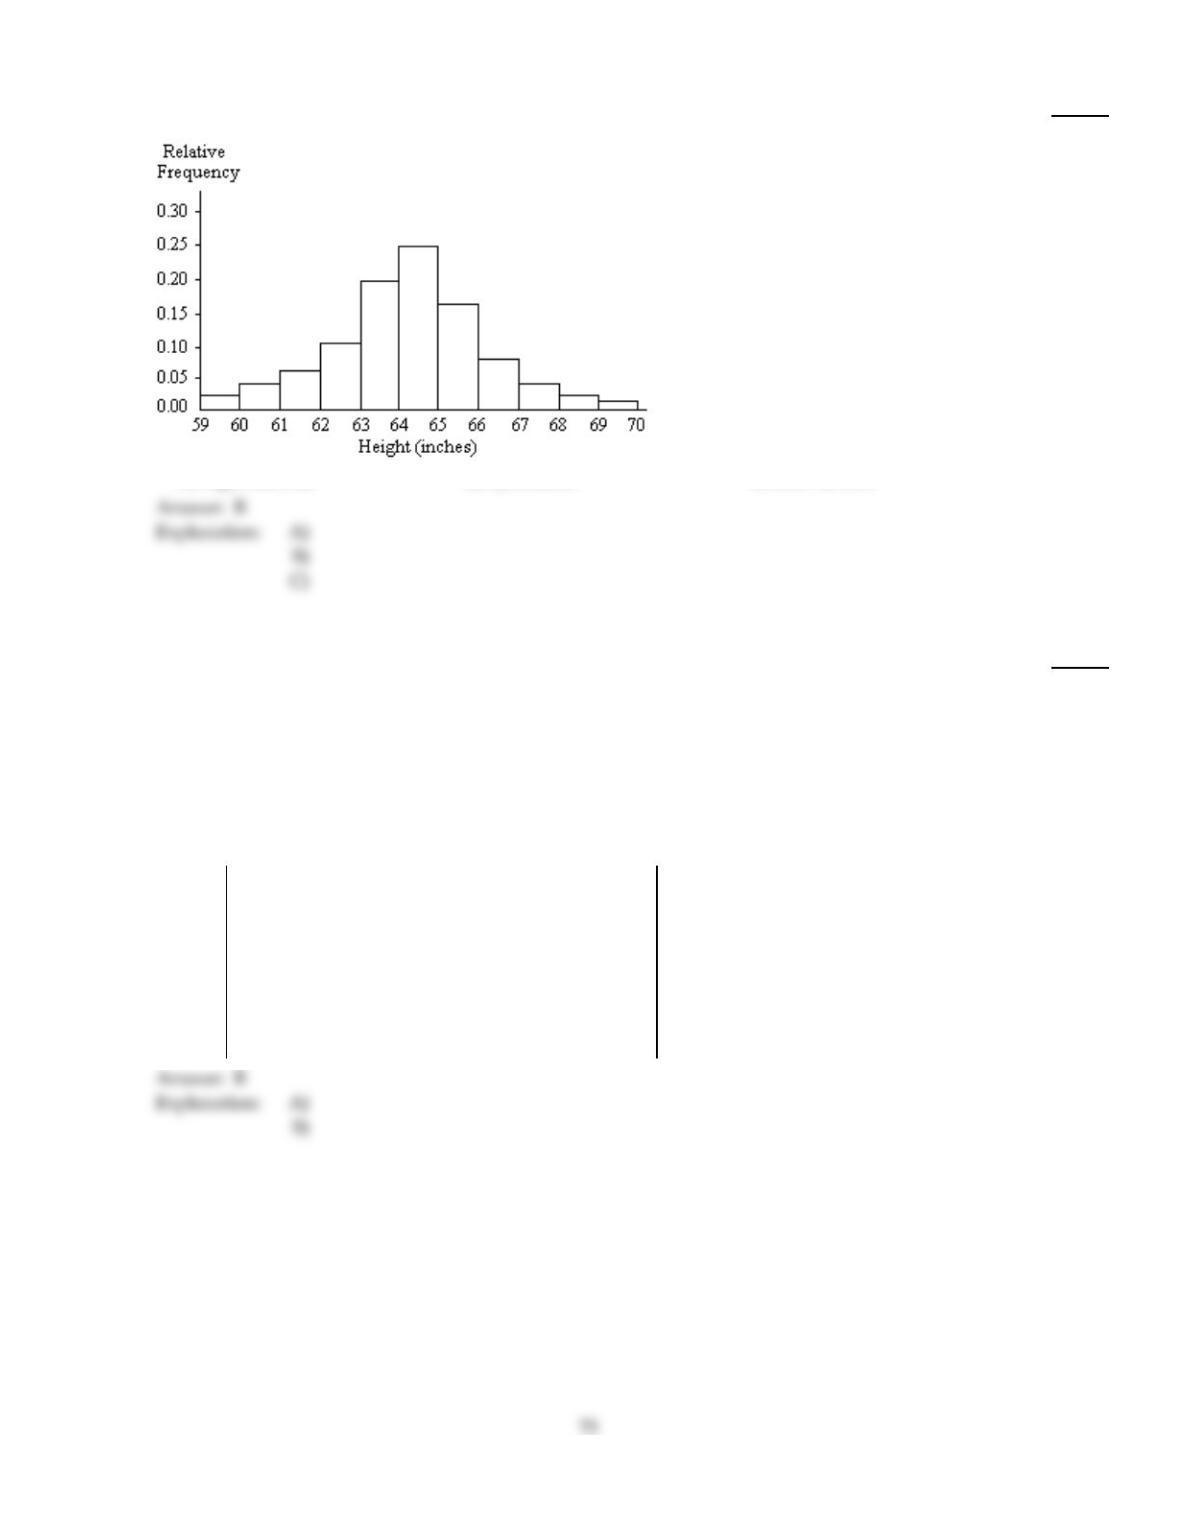
A relative frequency histogram for the heights of a sample of adult women is shown below.
138)
A)
Right skewed
B)
Symmetric
C)
Left skewed
Construct a stem–and–leaf diagram for the given data.
139)
The ages of the 45 members of a track and field team are listed below. Construct an ordered
stem–and–leaf diagram using two lines per stem.
21 18 42 35 32 21 44 25 38
48 14 19 23 22 28 32 34 27
31 17 16 41 37 22 24 33 32
21 26 30 22 27 32 30 20 18
17 21 15 26 36 31 40 16 25
139)
A)
1
1
2
2
3
3
4
4
4 5
5 6 6 7 7 8 8 9
0 1 1 1 1 2 2 2 3 4 5 5
5 5 6 6 7 7 8
0 0 1 1 2 2 2 2 3 4 5
5 6 7 8
0 1 2 4
8
B)
1
1
2
2
3
3
4
4
4
5 6 6 7 7 8 8 9
0 1 1 1 1 2 2 2 3 4
5 5 6 6 7 7 8
0 0 1 1 2 2 2 2 3 4
5 6 7 8
0 1 2 4
8
A graphical display of a data set is given. Identify the overall shape of the distribution as (roughly) bell–shaped,
triangular, uniform, reverse J–shaped, J–shaped, right skewed, left skewed, bimodal, or multimodal.
140)
A stem–and–leaf diagram is given below for the ages of the patients at a hospital.
0
1
2
3
4
5
6
7
8
9
4 0
4 2
0 2 0 3
0 1 5 8 2 9
3 4 5 1 7 1 8 2
3 6 2 6 8 9 3 3 0 6 3 6 3
6 2 8 1 8 3 3 6 2 6 9 0 5 0 3 6 7 5
2 5 3 7 8 9 5 3 6 7 8 4 8 9 3 6 7 8 5 5
4 6 0 8 5 3 2 6 2 7 8 9 0
1 4 6 7 3
140)
A)
Left skewed
B)
Reverse J–shaped
C)
J–shaped
D)
Right skewed
Identify the variable.
141)
The following table gives the top five movies at the box office this week.
Rank Last week Movie title Studio Box office sales ($ millions)
1N/A Pirate Adventure Movie Giant 35.2
2 2 Secret Agent Files G.M.G. 19.5
3 1 Epic Super Hero Team 22nd Century 14.3
4 5 Reptile Ride Movie Giant 10.1
5 4 Must Love Cats Dreamboat 9.9
Identify the variable under consideration in the fifth column?
141)
A)
rank
B)
box office sales
C)
studio
D)
movie title
B
A
Classify the data as either qualitative or quantitative.
142)
The following table gives the top five movies at the box office this week.
Rank Last week Movie title Studio Box office sales ($ millions)
1N/A Pirate Adventure Movie Giant 35.2
2 2 Secret Agent Files G.M.G. 19.5
3 1 Epic Super Hero Team 21st Century 14.3
4 5 Reptile Ride Movie Giant 10.1
5 4 Must Love Cats Dreamboat 9.9
What kind of data is provided by the information in the fourth column?
142)
A)
Qualitative
B)
Quantitative
143)
The following table gives the top five movies at the box office this week.
Rank Last week Movie title Studio Box office sales ($ millions)
1N/A Pirate Adventure Movie Giant 35.2
2 2 Secret Agent Files G.M.G. 19.5
3 1 Epic Super Hero Team 22nd Century 14.3
4 5 Reptile Ride Movie Giant 10.1
5 4 Must Love Cats Dreamboat 9.9
What kind of data is provided by the information in the fifth column?
143)
A)
Qualitative
B)
Quantitative
Identify the variable.
144)
The following table gives the top five movies at the box office this week.
Rank Last week Movie title Studio Box office sales ($ millions)
1N/A Pirate Adventure Movie Giant 35.2
2 2 Secret Agent Files G.M.G. 19.5
3 1 Epic Super Hero Team 21st Century 14.3
4 5 Reptile Ride Movie Giant 10.1
5 4 Must Love Cats Dreamboat 9.9
Identify the variable under consideration in the second column?
144)
A)
box office sales
B)
movie title
C)
last week’s rank
D)
Secret Agent Files
Construct a stem–and–leaf diagram for the given data.
145)
The lengths (in inches) of a random sample of bottlenose dolphins are given below. Truncate each
observation by dropping the decimal part, then construct a stem–and–leaf diagram of the
truncated data using two lines per stem.
97.7 142.2 105.2 110.5 115.8 112.4
136.7 99.9 101.2 124.3 121.9 98.8
121.8 132.7 128.9 117.8 141.9 108.2
118.0 127.3 133.4 116.9 104.4 132.0
145)
A)
9
10
11
12
13
14
7 8 9
1 4 5 8
0 2 5 6 7 8
1 1 4 7 8
2 2 3 6
1 2
B)
9
10
11
12
13
14
8 9
0 1 4 5 8
1 2 6 7 8 8
2 2 4 7 9
2 3 3 7
2 2
A graphical display of a data set is given. Identify the overall shape of the distribution as (roughly) bell–shaped,
triangular, uniform, reverse J–shaped, J–shaped, right skewed, left skewed, bimodal, or multimodal.
146)
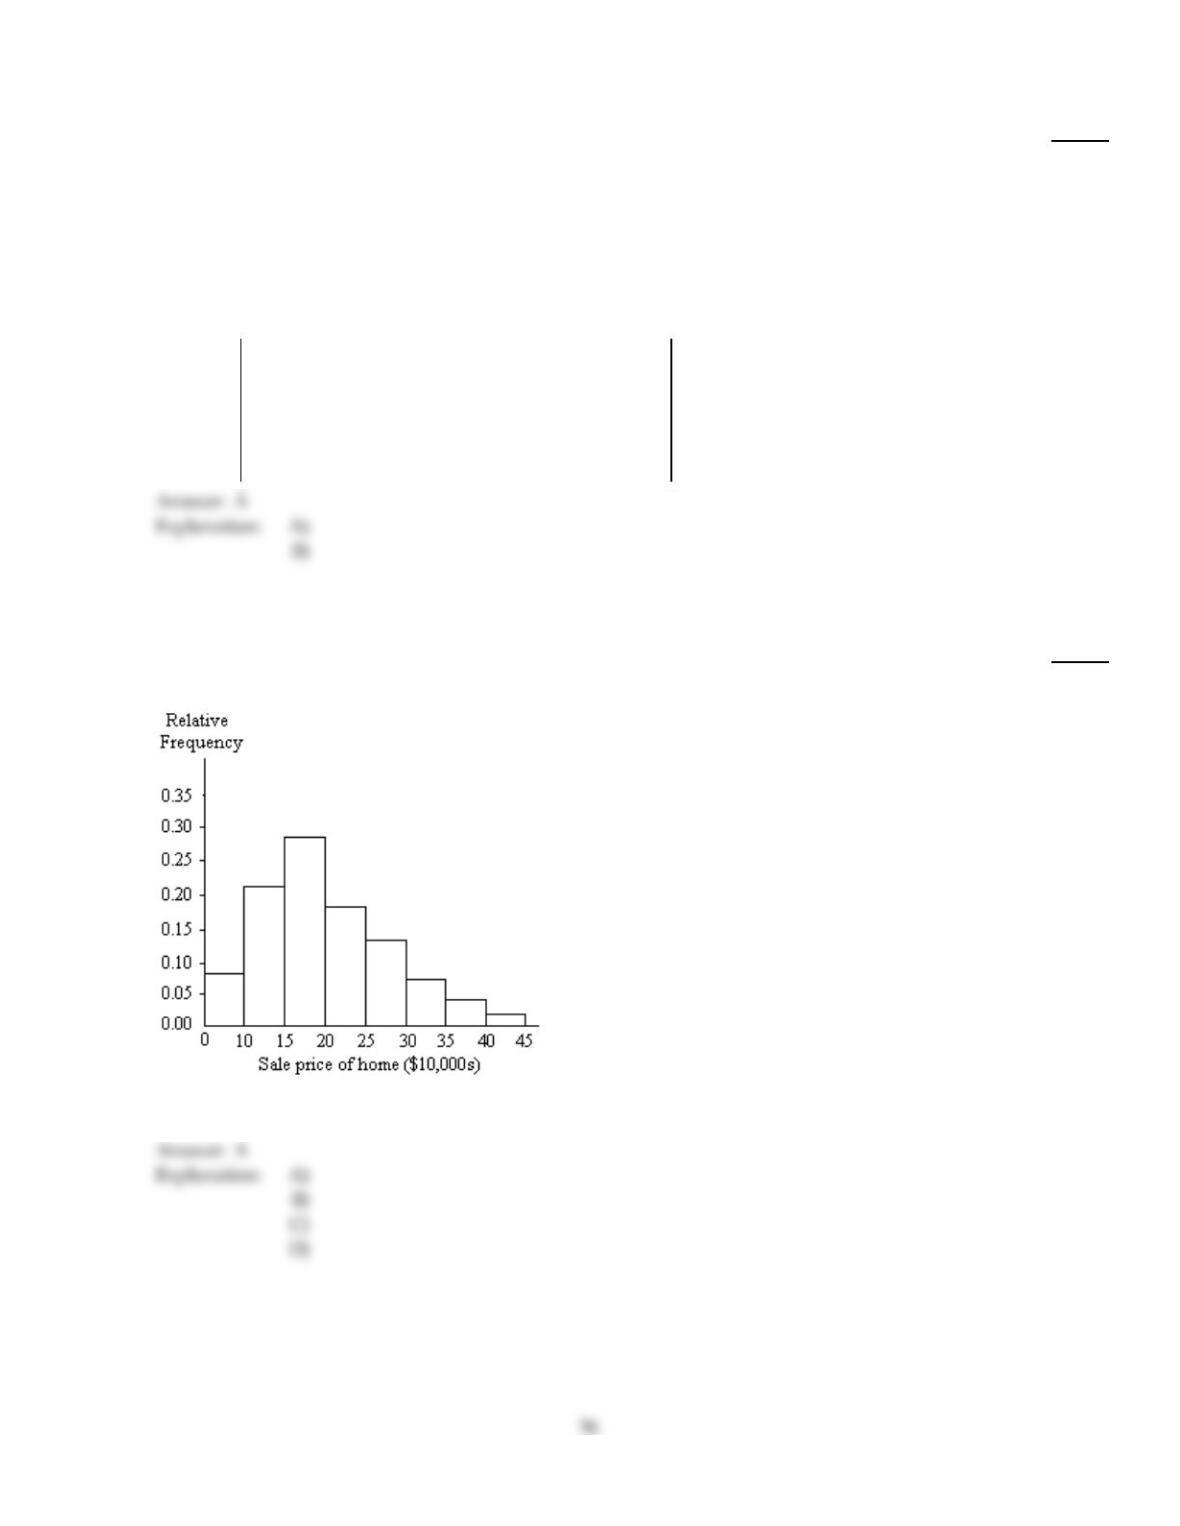
A relative frequency histogram for the sale prices of homes sold in one city during 2006 is shown
below.
146)
A)
Right skewed
B)
Reverse J–shaped
C)
Left skewed
D)
J–shaped
A
A
Construct a stem–and–leaf diagram for the given data.
147)
The diastolic blood pressures for a sample of patients at a clinic were as follows. The measurements
are in mmHg.
78 87 91 85 97 102 73 90 102 105
94 85 81 95 77 106 84 101 83 92
79 81 96 88 100 85 89 87 83 90
88 95 78 74 108 85 87 92 97 83
Construct a stem–and–leaf diagram using two lines per stem.
147)
A)
7
7
8
8
9
9
10
10
8 3 7
9 8 4
7 5 5 1 4 3 1 8
5 9 7 3 8 5 7 3
1 7 0 4 5 2
6 0 5 2 7
2 2 5 6
1 0 8
B)
7
7
8
8
9
9
10
10
3 4
8 7 9 8
1 4 3 1 3 3
7 5 5 8 5 9 7 8 5 7
1 0 4 2 0 2
7 5 6 5 7
2 2 1 0
5 6 8
Complete the contingency table and use it to solve the problem.
148)
The partially filled contingency table gives the frequencies of the data on age (in years) and sex
from the residents of a retirement home.
Age (yrs)
60–69 70–79 Over 79 Total
Male 7 7 5
Female 13 4 4
Total
What is the relative frequency for females in the age group 60–69?
148)
A)
13
40
B)
11
40
C)
13
20
D)
7
20
Use single–value grouping to organize these data into a frequency distribution.
149)
The following data represent the total number of years of formal education for 40 employees of a
bank.
13 17 13 14 12 17 19 13 15 13
16 18 13 11 19 19 12 14 13 13
14 15 13 15 17 18 17 14 13 17
12 17 17 16 16 17 15 13 13 14
Construct a frequency distribution for the number of years of education.
149)
77
A)
Number of
years of
education Frequency
11 1
12 3
13 12
14 5
15 4
16 3
17 8
18 2
19 2
B)
Number of
years of
education Frequency
11 1
12 3
13 11
14 6
15 4
16 3
17 7
18 2
19 3
C)
Number of
years of
education Frequency
12 3
13 11
14 5
15 4
16 3
17 8
18 2
19 3
D)
Number of
years of
education Frequency
11 1
12 3
13 11
14 5
15 4
16 3
17 8
18 2
19 3
Tell whether the statement is true or false.
150)
A discrete variable always yields numerical values.
150)
A)
True
B)
False
Construct a stem–and–leaf diagram for the given data.
151)
The midterm test scores for the seventh–period typing class are listed below.
85 77 93 91 74 65 68 97
88 59 74 83 85 72 63 79
151)
A)
5
6
7
8
9
9
5 8 3
7 4 4 2 9
5 8 3 5
3 1 7
B)
5
6
7
8
9
9
3 5 8
3 5 5 8
2 4 4 7 9
1 3 7
Classify the data as either discrete or continuous.
152)
An athlete runs 100 meters in 10.7 seconds.
152)
A)
Discrete
B)
Continuous
A graphical display of a data set is given. Identify the overall shape of the distribution as (roughly) bell–shaped,
triangular, uniform, reverse J–shaped, J–shaped, right skewed, left skewed, bimodal, or multimodal.
153)
The ages of a group of patients being treated at one hospital for osteoporosis are summarized in the
frequency histogram below.
153)
A)
Right skewed
B)
Bell–shaped
C)
Left skewed
D)
Reverse J–shaped
Provide the requested table entry.
154)
The data in the following table reflect the amount of time 40 students in a section of Statistics 101
spend on homework each day. Find the value of the missing entry.
Homework time
(minutes)
Relative
frequency
0–14 0.05
15–29 0.10
30–44 0.25
45–59
60–74 0.15
75–89 0.05
154)
A)
16
B)
0.40
C)
40%
D)
The value cannot be determined from the given data.
A graphical display of a data set is given. Identify the overall shape of the distribution as (roughly) bell–shaped,
triangular, uniform, reverse J–shaped, J–shaped, right skewed, left skewed, bimodal, or multimodal.
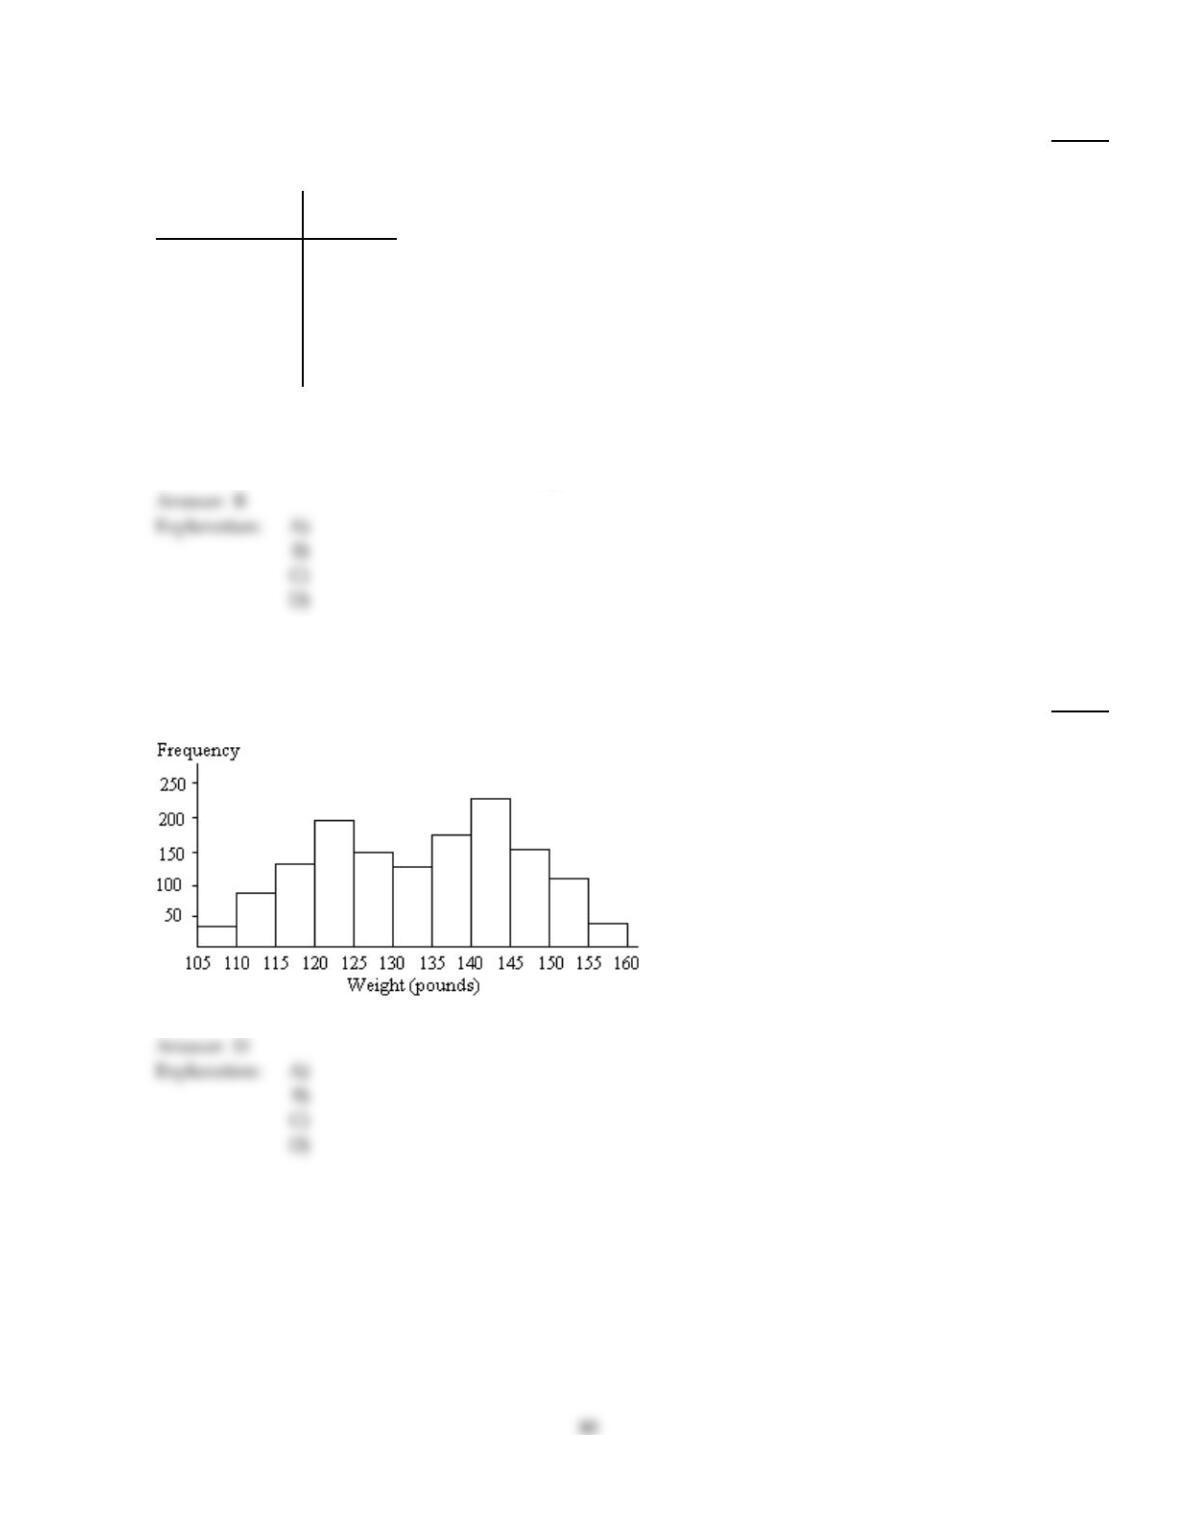
155)
A frequency histogram is given below for the weights of a sample of college students.
155)
A)
Multimodal
B)
Uniform
C)
Bell–shaped
D)
Bimodal