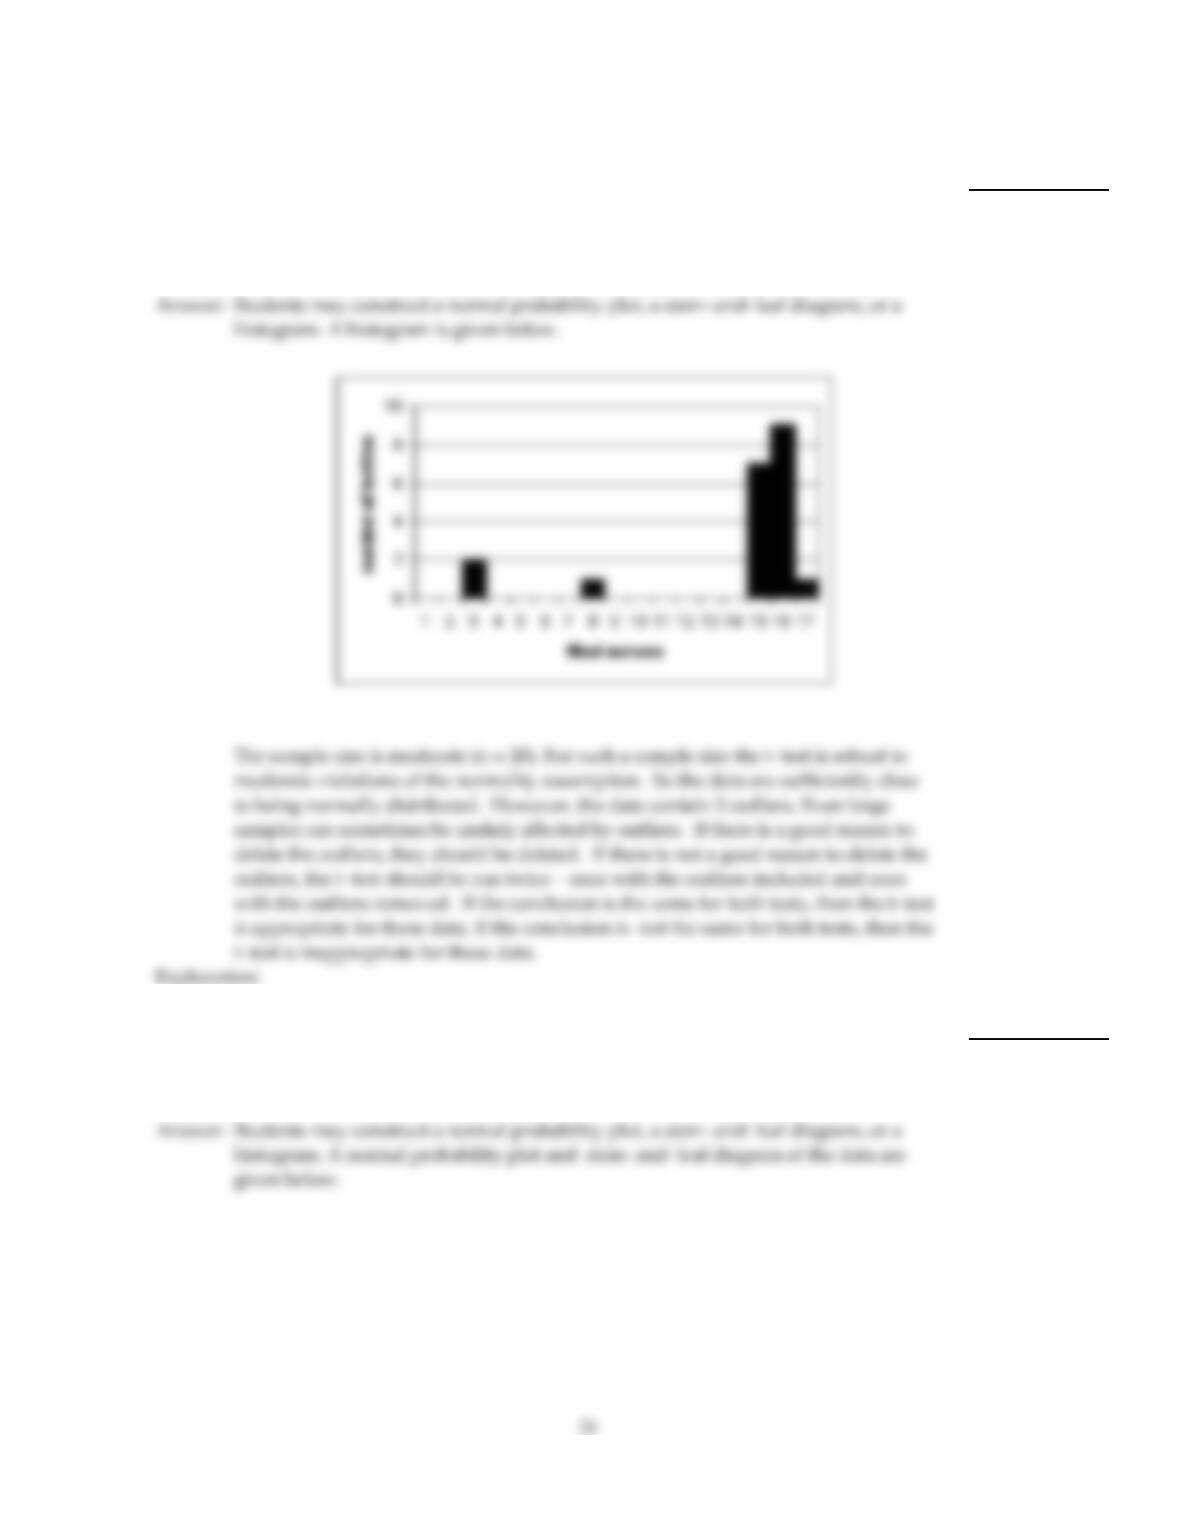
Decide whether it appears reasonable to use a t–test to perform a hypothesis test for the mean in question. Explain your
answer and include any relevant graphs, such as a normal probability plot, histogram, or stem–and–leaf diagram. If there
are outliers, explain how to proceed.
42)
A machine that fills soda bottles is supposed to fill them to a mean volume of 16.2 fluid
ounces. A random sample of 20 filled bottles produced the following volumes in fluid
ounces:
16.3 15.9 16.7 15.3 17.1 16.4 3.9 15.9 16.2 3.4
16.4 8.2 15.5 16.5 16.0 16.3 15.8 16.7 16.5 15.5
42)
43)
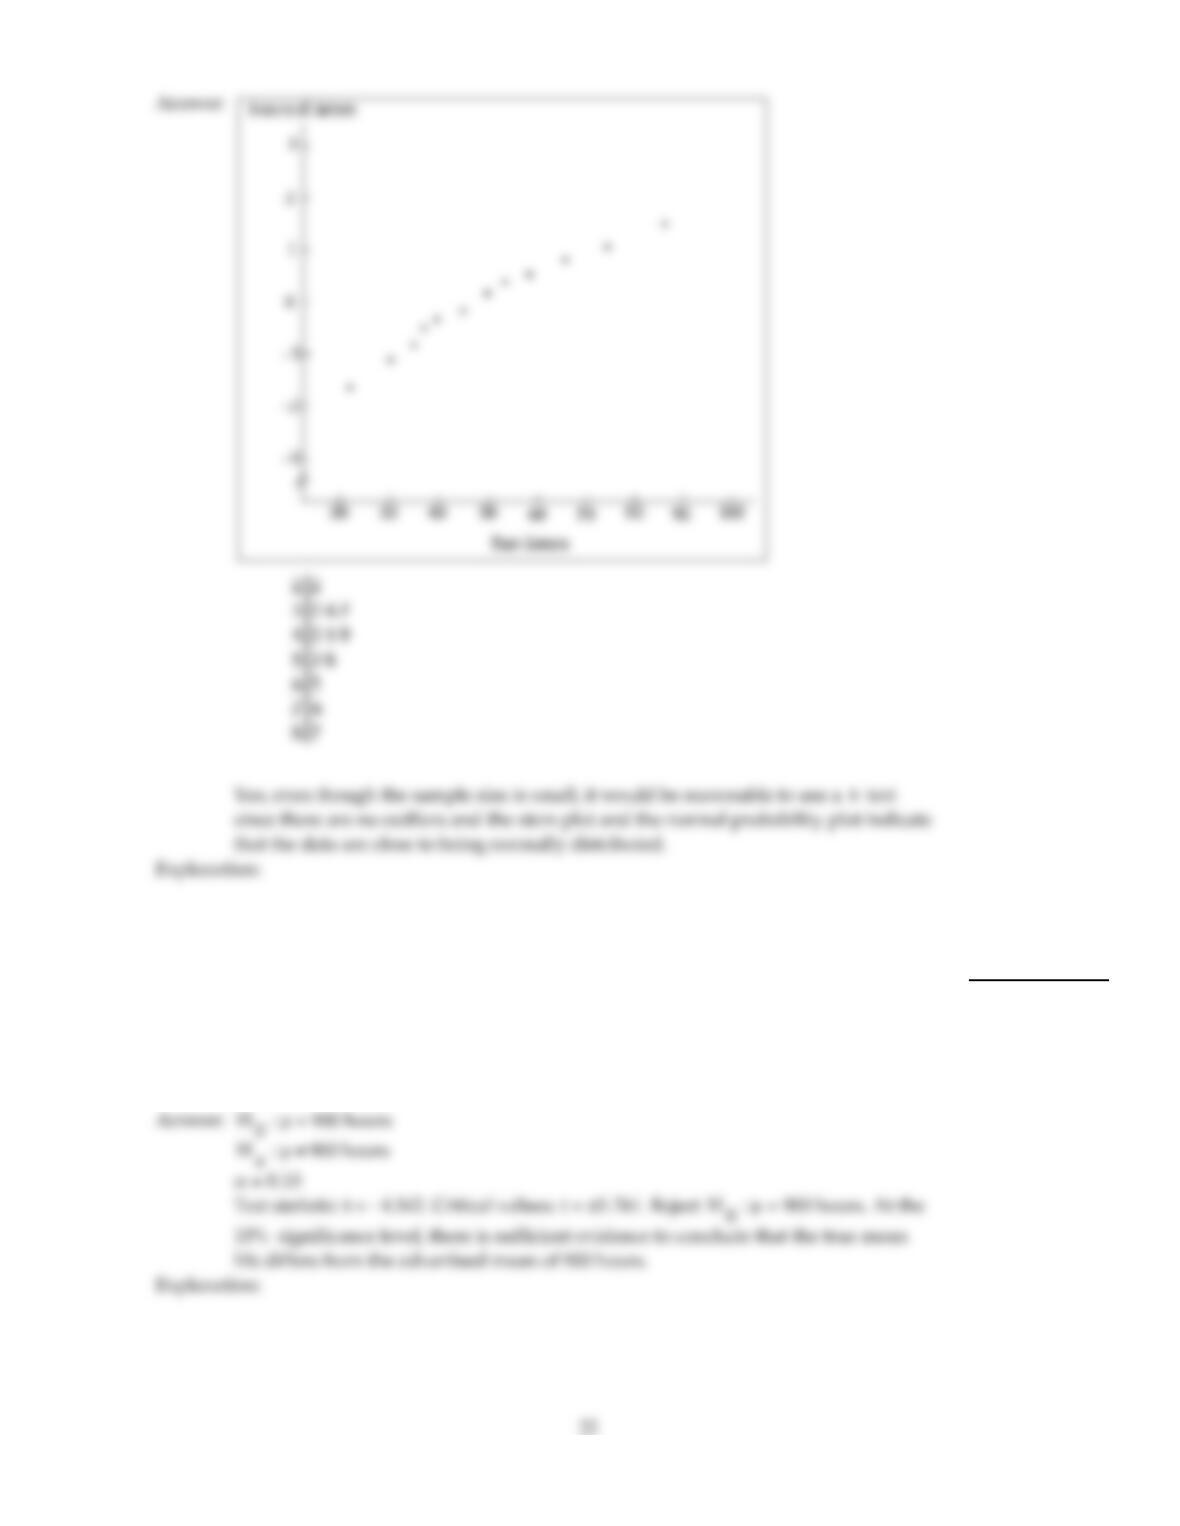
Test scores for a random sample of 12 students were as follows:
22 30 34 37 40 45
49 53 58 65 74 87
43)
Preliminary data analyses indicate that it is reasonable to use a t–test to carry out the specified hypothesis test. Perform
the t–test using the critical–value approach.
44)
A light–bulb manufacturer advertises that the average life for its light bulbs is 900 hours. A
random sample of 15 of its light bulbs resulted in the following lives in hours.
995 590 510 539 739 917 571 555
916 728 664 693 708 887 849
At the 10% significance level, do the data provide evidence that the mean life for the
company’s light bulbs differs from the advertised mean?
44)

Provide an appropriate response.
45)
Explain the difference between a Type I error and a Type II error.
45)
Preliminary data analyses indicate that it is reasonable to use a t–test to carry out the specified hypothesis test. Perform
the t–test using the P–value approach.
46)
Last year, the mean annual salary for adults in one town was $35,000. A researcher wants
to perform a hypothesis test to determine whether the mean annual salary for adults in this
town has changed. The mean annual salary for a random sample of 17 adults from the
town was x= $27,298 with a standard deviation, s, of $14,200. Use a significance level of
= 0.05.
46)
Provide an appropriate response.
47)
Give an example of a situation in which you might wish to conduct a two–tailed
hypothesis test concerning a population mean. State in words what you wish to determine
and write the null and alternative hypotheses in words and symbolically.
47)
Construct a graph portraying the decision criterion for the specified hypothesis test.
48)
A hypothesis test for a population mean is conducted. The hypotheses are:
H0: µ=µ0
Ha: µ>µ0
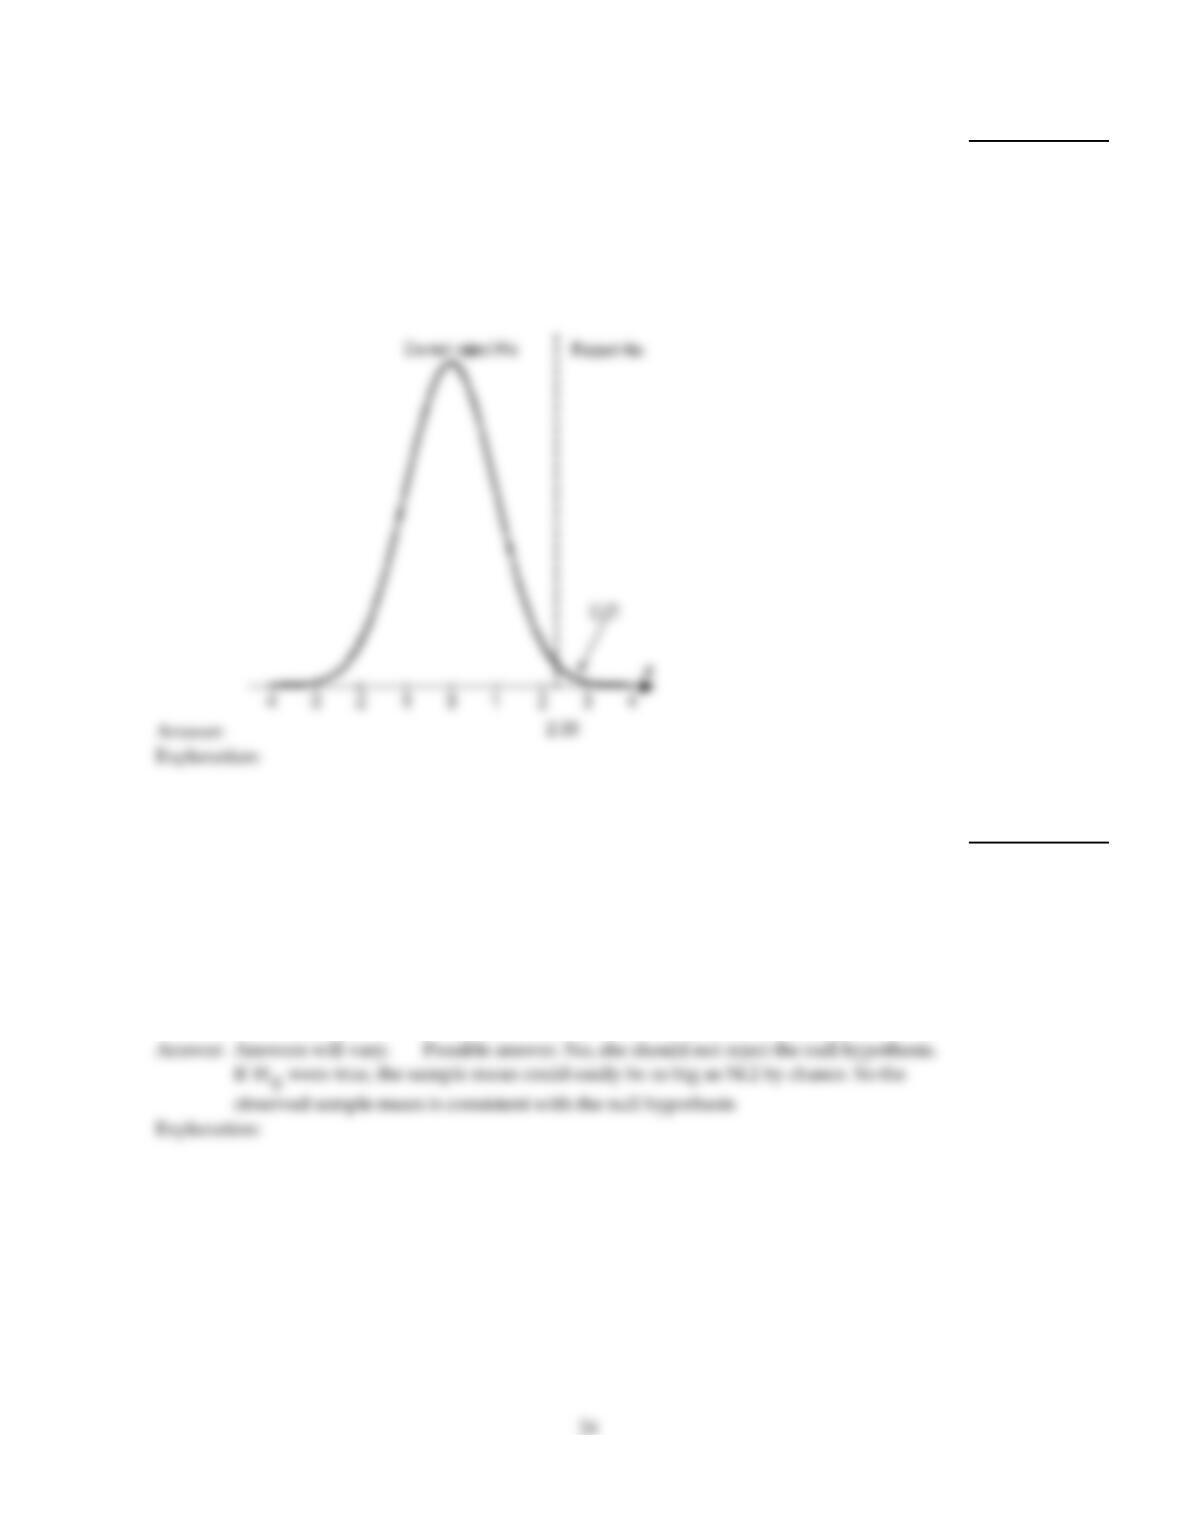
The significance level is 0.01 and the critical value is 2.33. Sketch a normal curve
displaying the decision criterion. This curve will represent the normal curve for the test
statistic under the assumption that the null hypothesis is true. On your graph indicate the
area in the tail, the critical value, the rejection region, and the nonrejection region.
48)
Provide an appropriate response.
49)
Jenny is conducting a hypothesis test concerning a population mean. The hypotheses are
as follows.
H0: µ= 50
Ha: µ> 50
She selects a sample and finds that the sample mean is 54.2. She then does some
calculations and is able to make the following statement:
If H0were true, the chance that the sample mean would have come out as big ( or bigger)
than 54.2 is 0.3. Do you think that she should reject the null hypothesis? Why or why not?
49)
Preliminary data analyses indicate that it is reasonable to use a t–test to carry out the specified hypothesis test. Perform
the t–test using the critical–value approach.
50)
Use a 5% significance level to test the claim that µ 32.6. The sample data consists of
15 scores for which x=43.3 and s =7.4.
50)
Provide an appropriate response.
51)
A hypothesis test for a population mean is to be performed. The hypotheses are
H0: µ= 60
Ha: µ> 60.
The significance level is 0.05, = 4 and n = 40. Assume that the true mean is greater than
60 (i.e., the null hypothesis is false). If you are given the value of the true mean, µ, how
would you find the power of the test? Outline the steps involved.
51)
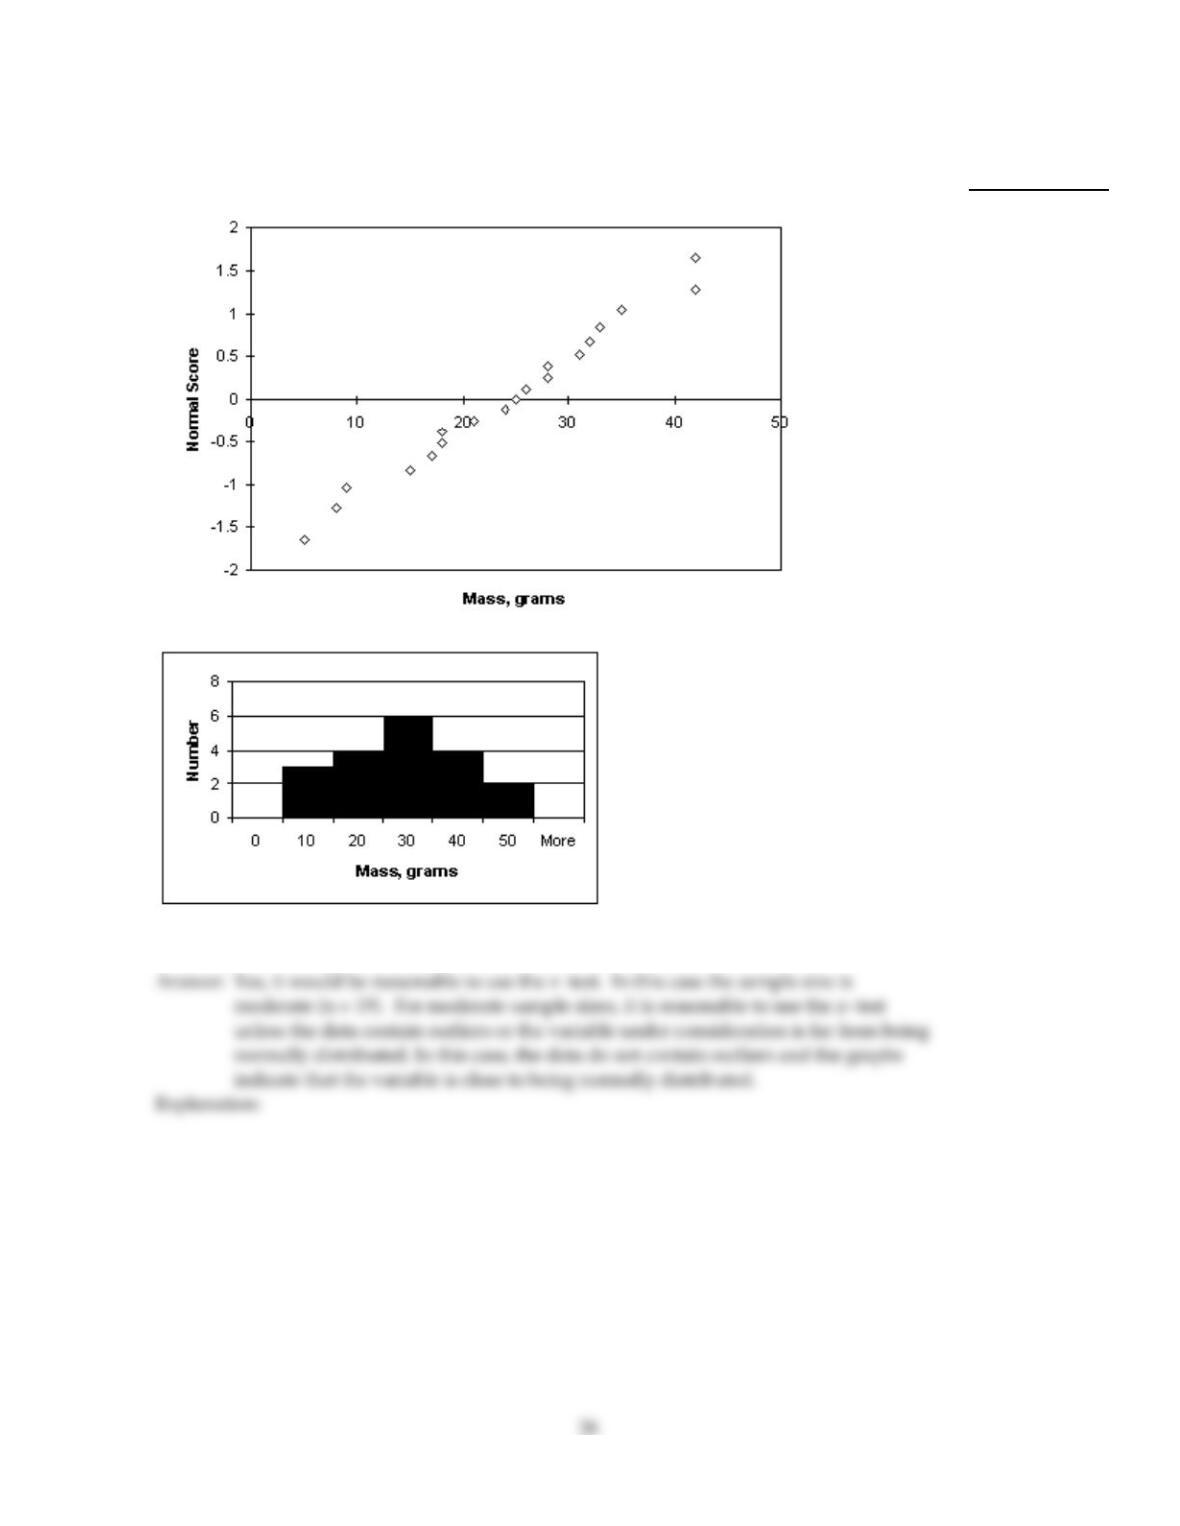
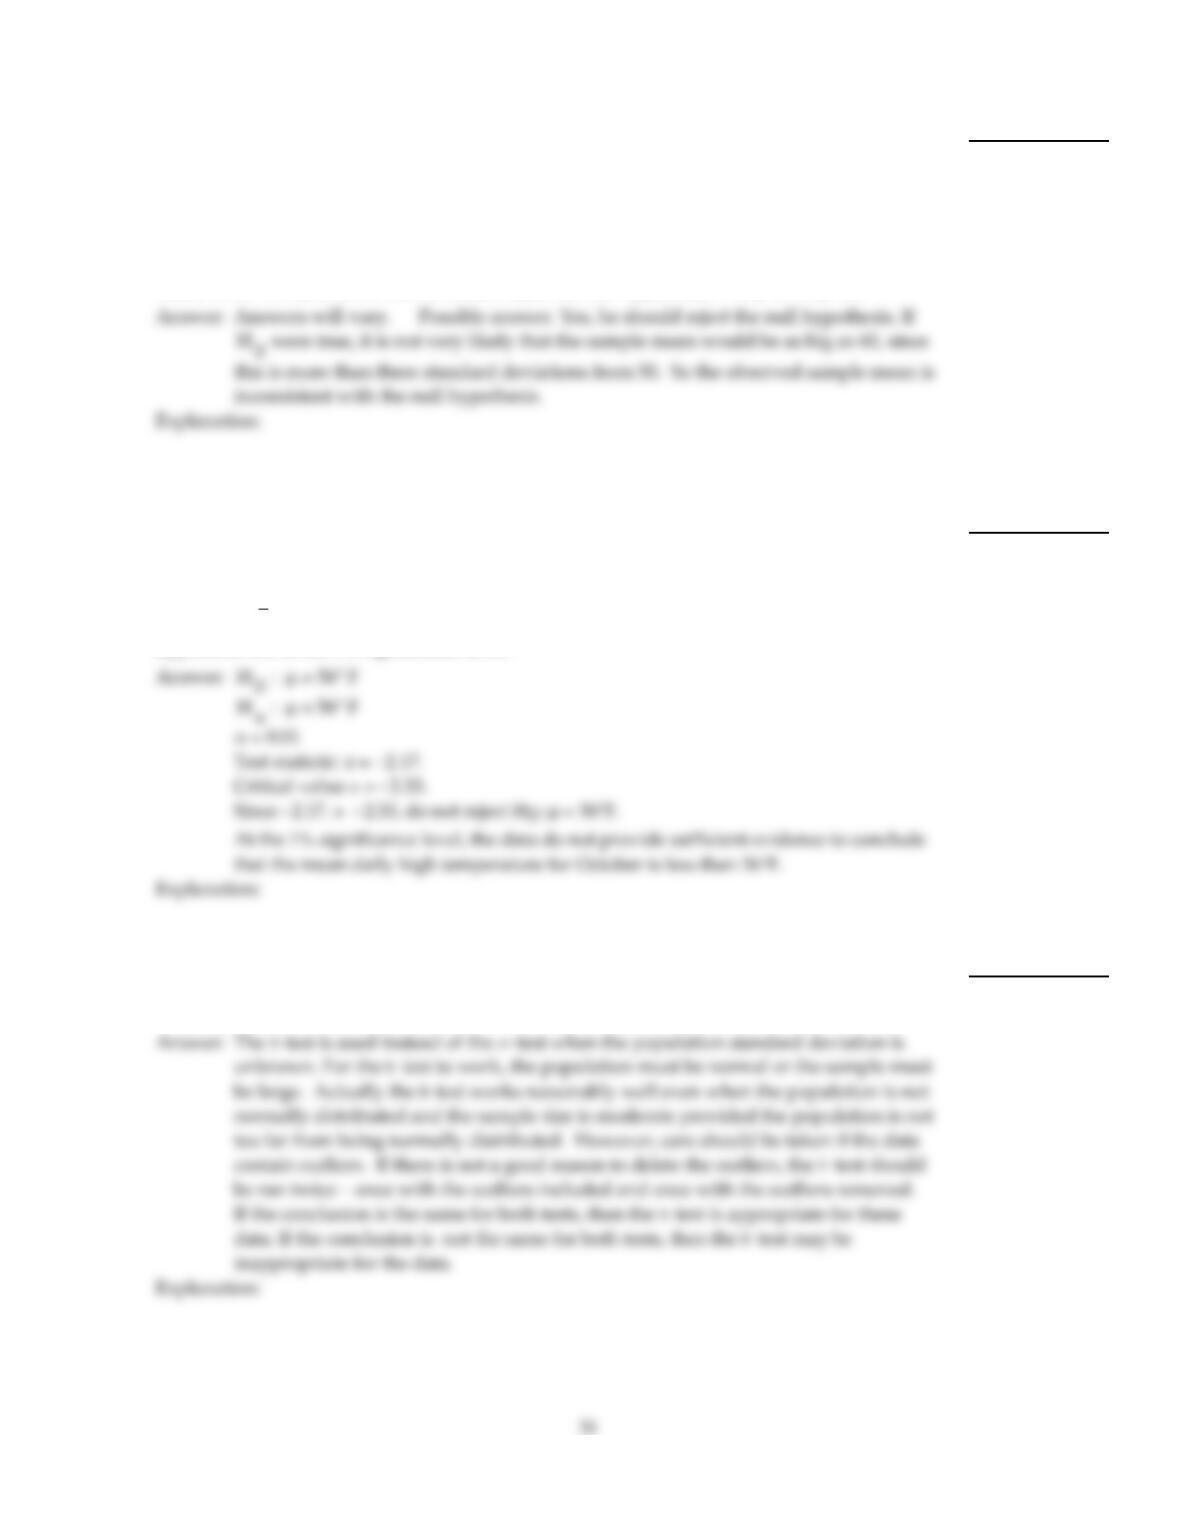
Two graphical displays are given for a set of data. A hypothesis test is to be performed for the mean of the population
from which the data were obtained. Would it be reasonable to use a one–mean z–test? Explain your reasoning. Assume
that the population standard deviation is known.
52)
A normal probability plot and a histogram plot of the data are given below.
52)
Perform a one–sample z–test for a population mean using the P–value approach. Be sure to state the hypotheses and the
significance level, to compute the value of the test statistic, to obtain the P–value, and to state your conclusion. Also,
assess the strength of the evidence against the null hypothesis.
53)
Last year, the mean running time for a certain type of flashlight battery was 8.5 hours. This
year, the manufacturer has introduced a change in the production method which he hopes
will increase the mean running time. A random sample of 40 of the new light bulbs was
obtained and the mean running time was found to be 8.7 hours. Do the data provide
sufficient evidence to conclude that the mean running time, µ, of the new light bulbs is
larger than last year’s mean of 8.5 hours? Perform the appropriate hypothesis test using a
significance level of 5%. Assume that = 0.5 hours.
53)
Provide an appropriate response.
54)
Suppose that you wish to use a Wilcoxon signed–rank test to perform a hypothesis test for
a population mean. If the absolute differences contain ties, how should you assign the
ranks? For example if two absolute differences are tied for fourth place, what ranks should
they receive? If three absolute differences are tied for eighth place, what ranks should they
receive?
54)
Preliminary data analyses indicate that it is reasonable to use a t–test to carry out the specified hypothesis test. Perform
the t–test using the P–value approach.
55)
A test of sobriety involves measuring a subject’s motor skills. The mean score for men who
are sober is known to be 35.0. A researcher would like to perform a hypothesis test to
determine whether the mean score for sober women differs from 35.0. Twenty randomly
selected sober women take the test and produce a mean score of 41.0 with a standard
deviation of 3.7. Perform the hypothesis test at the 0.01 level of significance.
55)
Preliminary data analyses indicate that it is reasonable to use a t–test to carry out the specified hypothesis test. Perform
the t–test using the critical–value approach.
56)
A test of sobriety involves measuring the subject‘s motor skills. The mean score for men
who are sober is known to be 35.0. A researcher would like to perform a hypothesis test to
determine whether the mean score for sober women differs from 35.0. Twenty randomly
selected sober women take the test and produce a mean score of 41.0 with a standard
deviation of 3.7. Perform the hypothesis test at the 1% significance level.
56)
Preliminary data analyses indicate that it is reasonable to use a t–test to carry out the specified hypothesis test. Perform
the t–test using the P–value approach.
57)
Test whether the mean weight of female college students differs from 132 lb. The mean
weight for a random sample of 20 female college students was x= 137 lb with a standard
deviation, s, of 14.2 lb. Use a significance level of = 0.1.
57)
Perform a one–sample z–test for a population mean using the P–value approach. Be sure to state the hypotheses and the
significance level, to compute the value of the test statistic, to obtain the P–value, and to state your conclusion. Also,
assess the strength of the evidence against the null hypothesis.
58)
In one city, the average amount of time that tenth–graders spend watching television each
week is 21.6 hours. The principal of Birchwood High School believes that at his school,
tenth–graders watch less television. For a sample of 28 tenth–graders from Birchwood
High School, the mean amount of time spent watching television per week was 19.4 hours.
Do the data provide sufficient evidence to conclude that for tenth–graders at Birchwood
High School, the mean amount of time spent watching television per week is less than the
city average of 21.6 hours? Perform the appropriate hypothesis test using a significance
level of 5%. Assume that = 7.2 hours.
58)
Perform a hypothesis test for the population mean. Assume that preliminary data analyses indicate that it is reasonable to
apply the z–test. Use the critical–value approach.
59)
In one city, convicted burglars are sentenced to an average of 18.7 months in prison. A
researcher wants to perform a hypothesis test to determine whether the mean sentence
handed down by one particular judge for burglars differs from 18.7 months. She takes a
random sample of 36 such cases from the court files of this judge and finds that x=17
months. Assume that the population standard deviation is 7.1 months. Test the hypothesis
at the 5% significance level.
59)
Provide an appropriate response.
60)
A pharmaceutical company has a new drug which relieves headaches. However, there is
some indication that the drug may have the side effect of increasing blood pressure.
Suppose the drug company conducts a hypothesis test to determine whether the
medication raises blood pressure. The hypotheses are:
H0: The drug does not increase blood pressure.
Ha: The drug increases blood pressure.
Do you think that for doctors and patients it is more important to have a small
probability or a small probability? Why? Do you think that the pharmaceutical company
would prefer to have a small probability or a small probability? Why?
60)

Perform a hypothesis test for the population mean. Assume that preliminary data analyses indicate that it is reasonable to
apply the z–test. Use the critical–value approach.
61)
A car insurance company has determined that the mean annual car insurance cost for a
family in the town of Watlington is $1716. A researcher wants to perform a hypothesis test
to determine whether the mean insurance cost for a family in the town of Putford is higher
than this. The mean insurance cost for a random sample of 32 families in Putford was
$1761. At the 10% significance level, do the data provide sufficient evidence to conclude
that the mean insurance cost for a family in Putford is higher than $1716, the mean cost for
a family in Watlington.? Assume that the population standard deviation is $35.50.
61)
Perform a one–sample z–test for a population mean using the P–value approach. Be sure to state the hypotheses and the
significance level, to compute the value of the test statistic, to obtain the P–value, and to state your conclusion. Also,
assess the strength of the evidence against the null hypothesis.
62)
A manufacturer claims that the mean amount of juice in its 16–ounce bottles is 16.1 ounces.
A consumer advocacy group wants to perform a hypothesis test to determine whether the
mean amount is actually less than this. The mean volume of juice for a random sample of
70 bottles was 15.94 ounces. Do the data provide sufficient evidence to conclude that the
mean amount of juice for the 16–ounce bottles, µ, is less than 16.1 ounces? Perform the
appropriate hypothesis test using a significance level of 10%. Assume that = 0.9 ounces.
62)
Provide an appropriate response.
63)
Robert is conducting a hypothesis test concerning a population mean. The hypotheses are
as follows.
H0: µ= 50
Ha: µ> 50
He selects a sample of size 35 and finds that the sample mean is 60. He then does some
calculations and finds that for samples of size 35, the standard deviation of the sample
means is 3.2. Do you think that he should reject the null hypothesis? Why or why not?
63)
Perform a hypothesis test for the population mean. Assume that preliminary data analyses indicate that it is reasonable to
apply the z–test. Use the critical–value approach.
64)
The National Weather Service says that the mean daily high temperature for October in a
large midwestern city is 56°F. A local weather service suspects that this value is not
accurate and wants to perform a hypothesis test to determine whether the mean is actually
lower than 56°F. A sample of mean daily high temperatures for October over the past 37
years yields x= 54°F. Assume that the population standard deviation is 5.6° F. Perform the
hypothesis test at the 1% significance level.
64)
Provide an appropriate response.
65)
Suppose that you wish to perform a hypothesis test for a population mean. Under what
conditions would you choose to perform a t–test rather than a z–test? What conditions
must be satisfied for the t–test to work?
65)

Preliminary data analyses indicate that it is reasonable to use a t–test to carry out the specified hypothesis test. Perform
the t–test using the P–value approach.
66)
In tests of a computer component, it is found that the mean time between failures is
520 hours. A modification is made which is supposed to increase the time between failures.
Tests on a random sample of 10 modified components resulted in the following times (in
hours) between failures.
518 548 561 523 536
499 538 557 528 563
At the 0.05 significance level, test the claim that for the modified components, the mean
time between failures is greater than 520 hours.
66)
Provide an appropriate response.
67)
Suppose that you wish to perform a hypothesis test for a population mean. Suppose that
the population standard deviation is unknown, the population is skewed to the right, and
the sample is large. Would you perform a z–test or a t–test? Why? Would the test be exact
or approximate?
67)
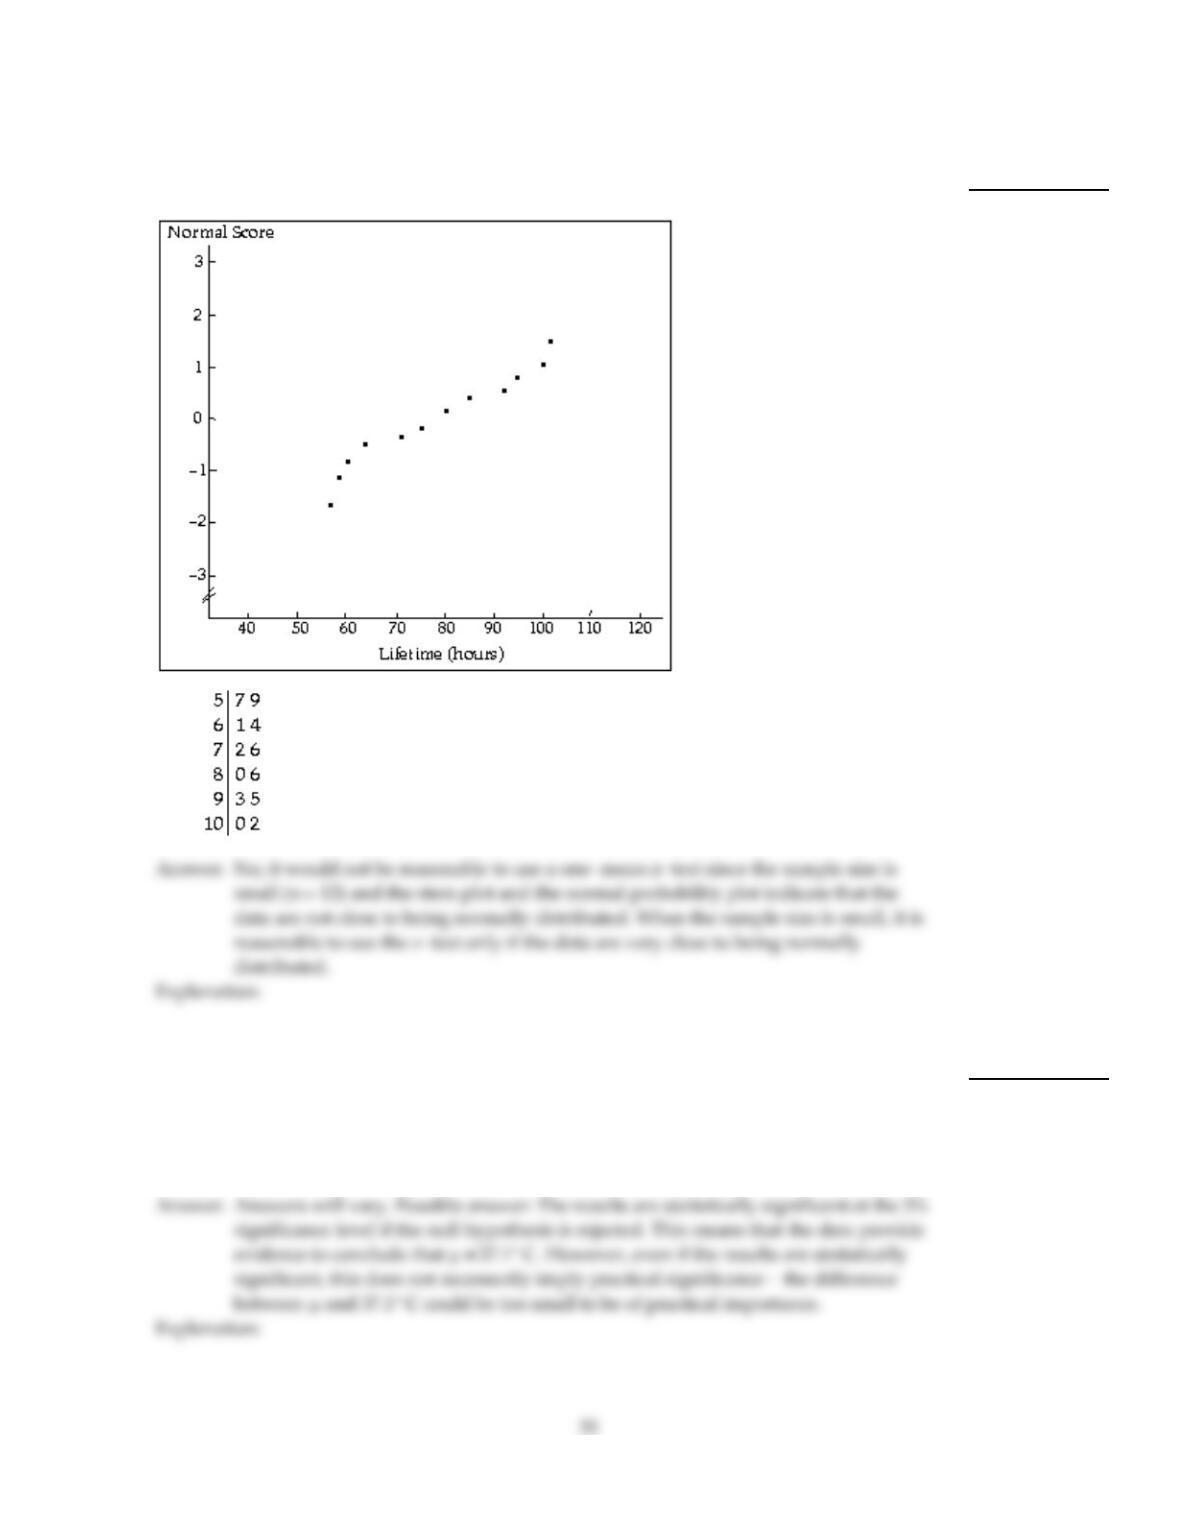
Two graphical displays are given for a set of data. A hypothesis test is to be performed for the mean of the population
from which the data were obtained. Would it be reasonable to use a one–mean z–test? Explain your reasoning. Assume
that the population standard deviation is known.
68)
A normal probability plot and a stem–and–leaf diagram of the data are given below.
68)
Provide an appropriate response.
69)
A hypothesis test is performed at the 5% significance level to determine whether the mean
body temperature for a certain population differs from 37.1° C. The hypotheses are
H0: µ= 37.1° C
Ha: µ 37.1° C.
Explain the difference between statistical significance and practical significance.
69)
70)
For a fixed sample size, how will increasing the significance level of a hypothesis test affect
the probability of a Type I error? How will it affect the probability of a Type II error?
70)
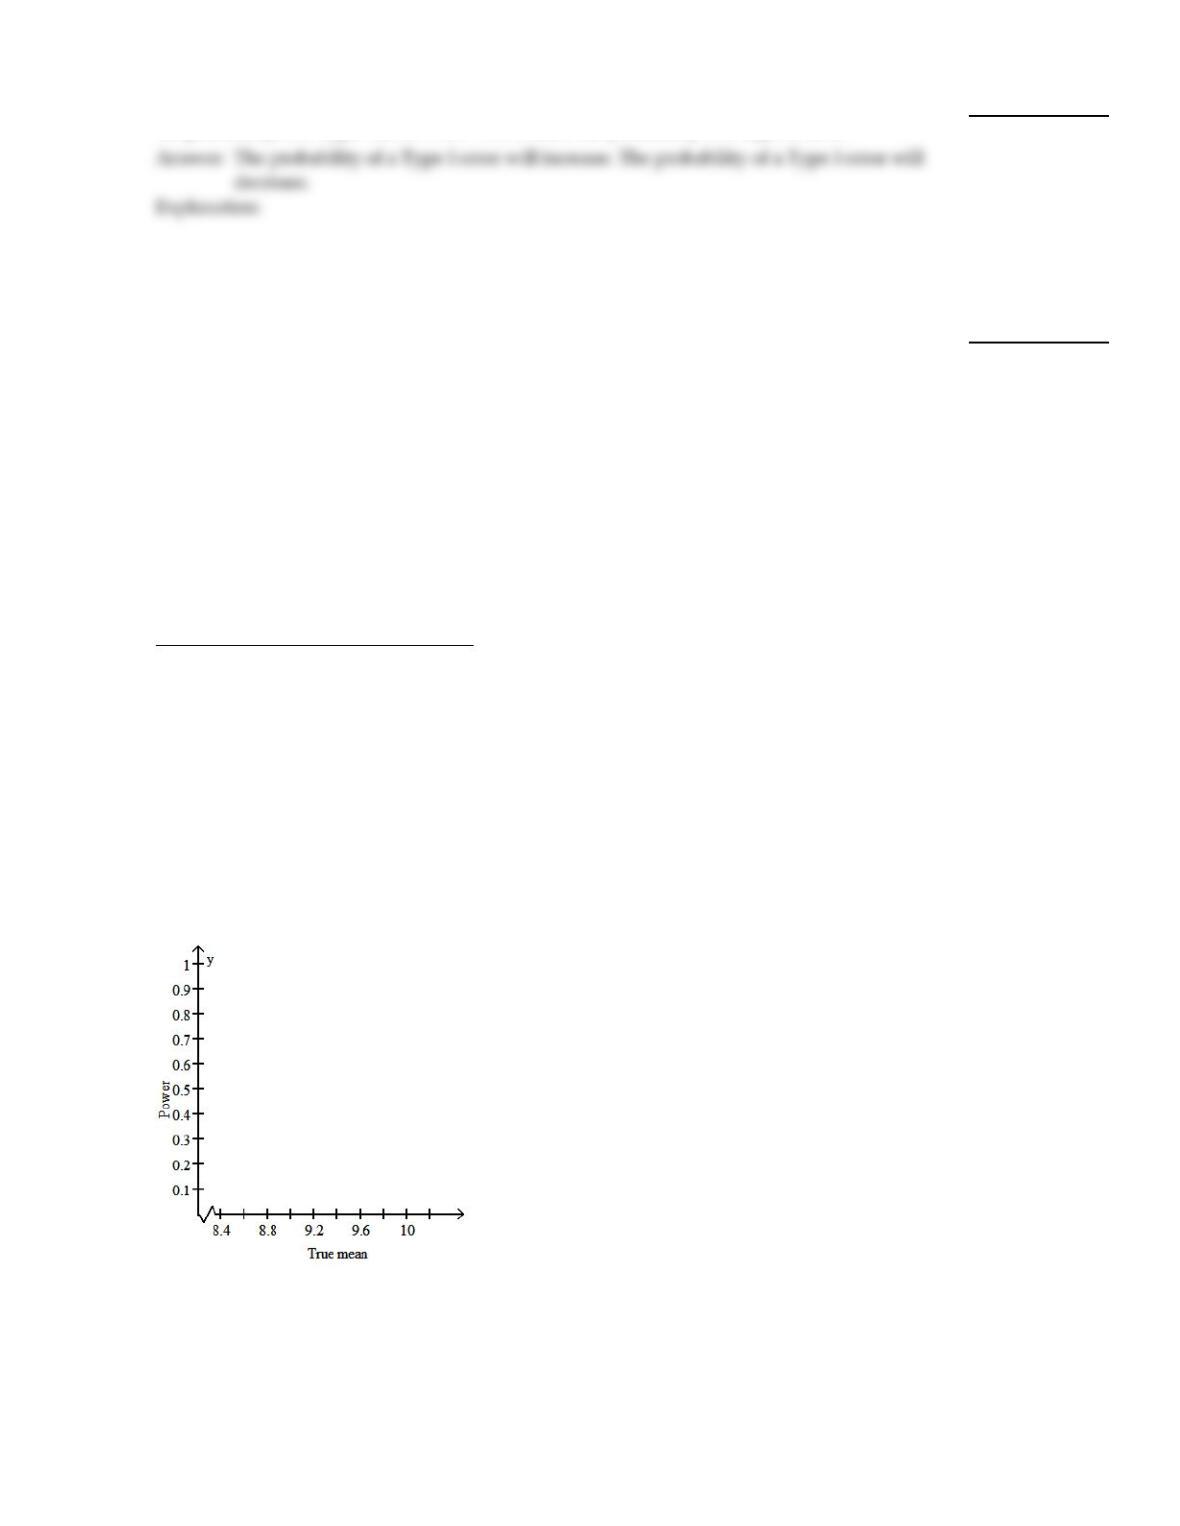
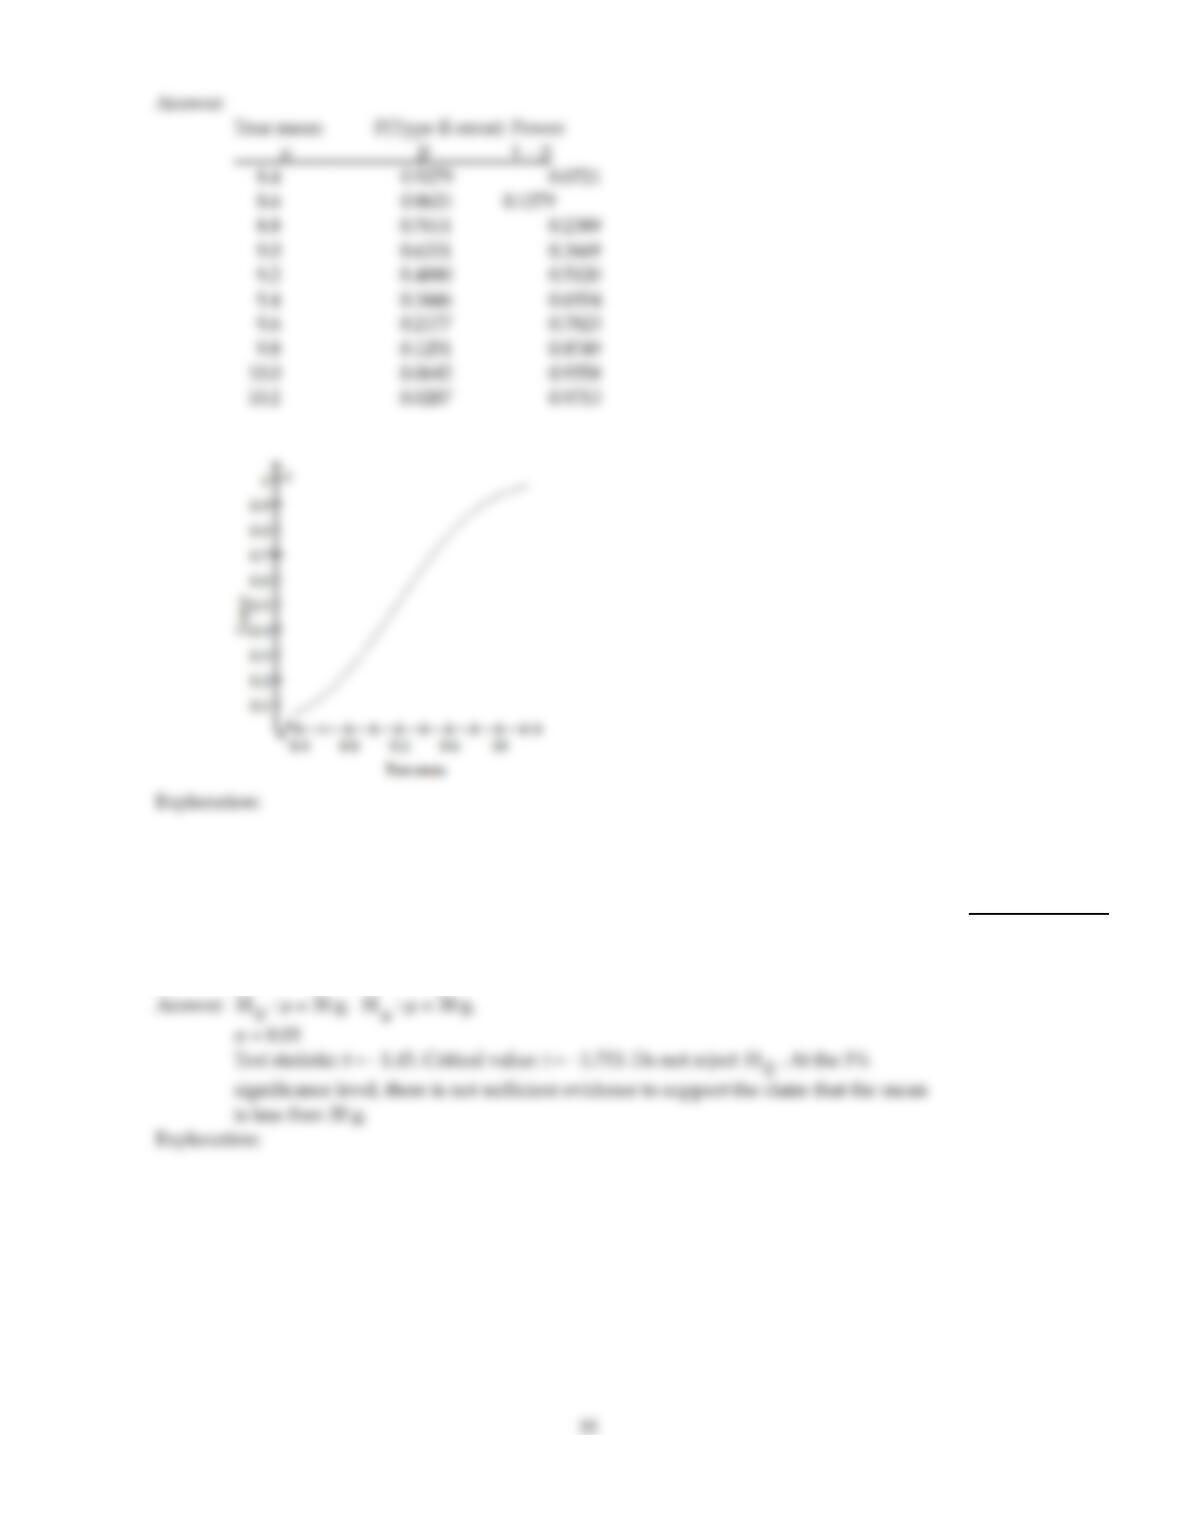
A hypothesis testing situation is given. The population standard deviation, sample size, and significance level are given.
Complete the table to give the probability of a Type II error and the power for each of the given values of µ. Use the table
to draw the power curve.
71)
A hypothesis test is to be performed to determine whether the mean waiting time during
peak hours for customers in a grocery store has increased from the previous mean waiting
time of 8.3 minutes. Preliminary data analyses indicate that it is reasonable to apply a
z–test. The hypotheses are
H0: µ= 8.3 minutes
Ha: µ> 8.3 minutes.
The population standard deviation is 3.6 minutes. The sample size is 45. The significance
level is 0.05. Find the probability of a Type II error and the power for µ = 8.4, 8.6, 8.8, 9.0,
9.2, 9.4, 9.6, 9.8, 10.0, 10.2.
True mean P(Type II error) Power
µ1 –
8.4
8.6
8.8
9.0
9.2
9.4
9.6
9.8
10.0
10.2
Power Curve
71)
34
Preliminary data analyses indicate that it is reasonable to use a t–test to carry out the specified hypothesis test. Perform
the t–test using the critical–value approach.
72)
A manufacturer makes ball bearings that are supposed to have a mean weight of 30 g. A
retailer suspects that the mean weight is actually less than 30 g. The mean weight for a
random sample of 16 ball bearings is 28.4 g with a standard deviation of 4.4 g. At the 5%
significance level, test the claim that the mean is less than 30 g.
72)
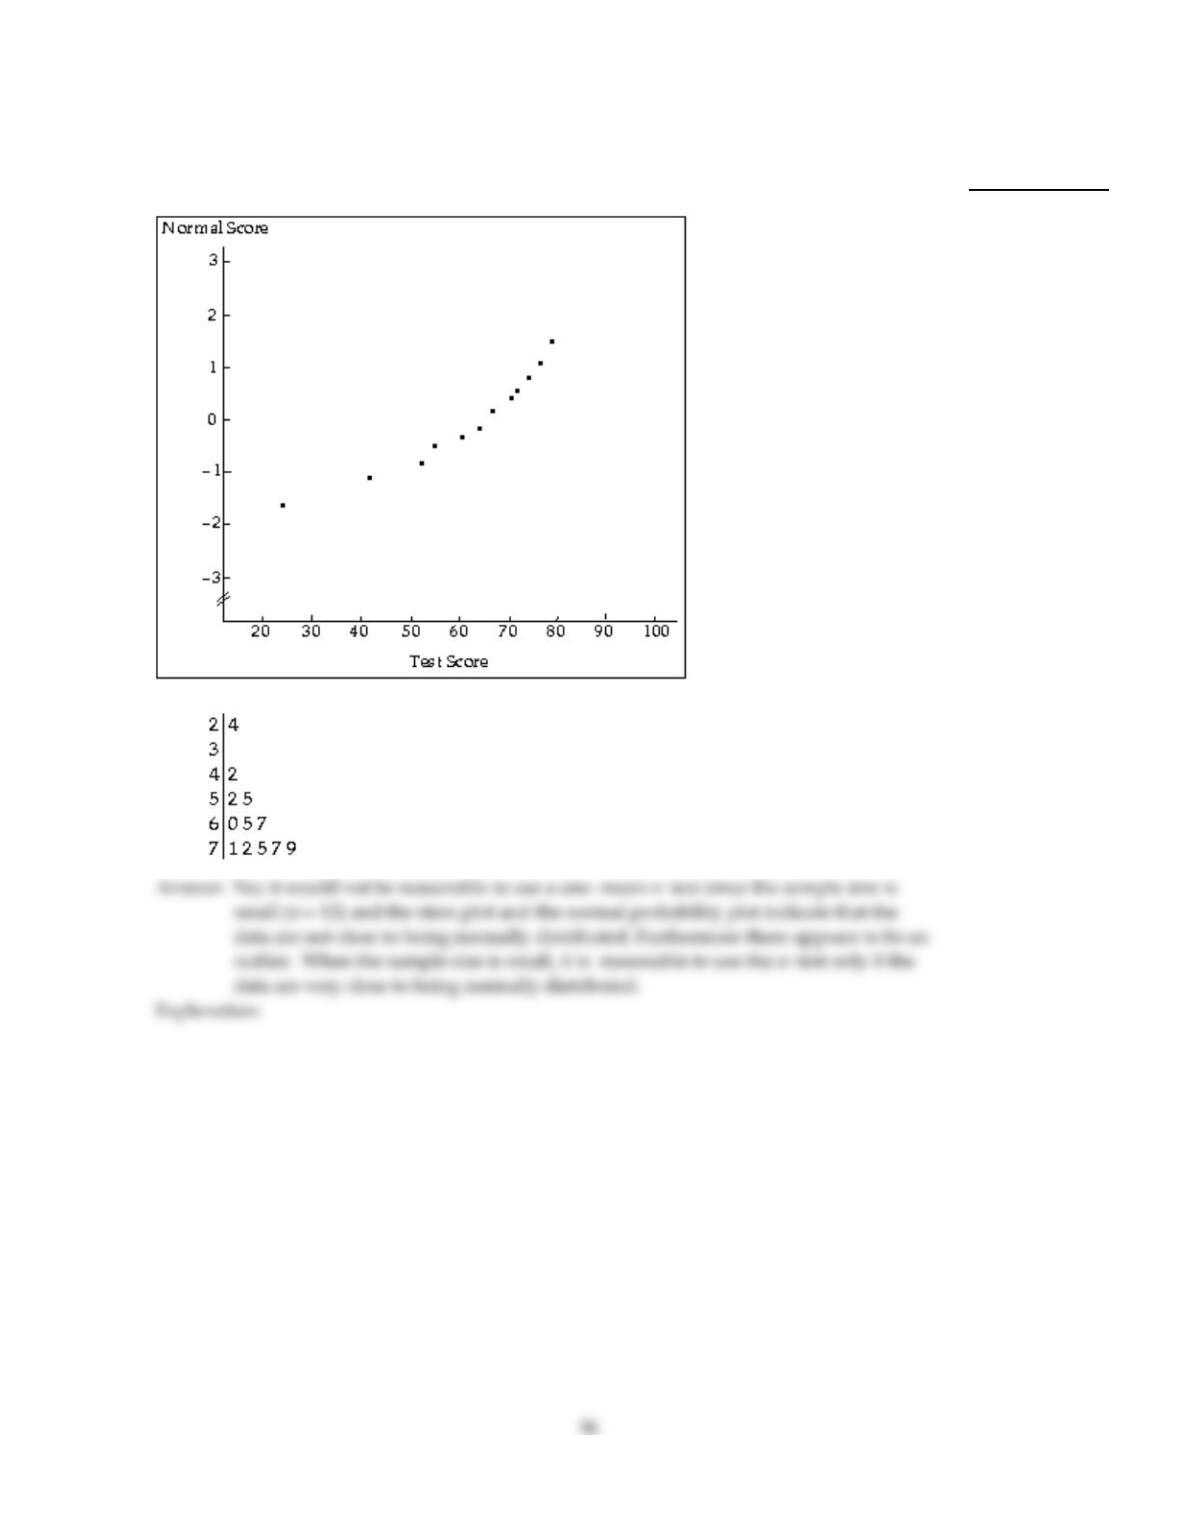
Two graphical displays are given for a set of data. A hypothesis test is to be performed for the mean of the population
from which the data were obtained. Would it be reasonable to use a one–mean z–test? Explain your reasoning. Assume
that the population standard deviation is known.
73)
A normal probability plot and a stem–and–leaf diagram of the data are given below.
73)

Perform a hypothesis test for the population mean. Assume that preliminary data analyses indicate that it is reasonable to
apply the z–test. Use the critical–value approach.
74)
A researcher claims that the amounts of acetaminophen in a certain brand of cold tablets
have a mean different from the 600 mg claimed by the manufacturer. Test this claim at the
2% level of significance. The mean acetaminophen content for a random sample of n =50
tablets is 603.3 mg. Assume that the population standard deviation is 5 mg.
74)
Perform a one–sample z–test for a population mean using the P–value approach. Be sure to state the hypotheses and the
significance level, to compute the value of the test statistic, to obtain the P–value, and to state your conclusion. Also,
assess the strength of the evidence against the null hypothesis.
75)
A health insurer has determined that the “reasonable and customary” fee for a certain
medical procedure is $1200. They suspect that the average fee charged by one particular
clinic for this procedure is higher than $1200. The insurer wants to perform a hypothesis
test to determine whether their suspicion is correct. The mean fee charged by the clinic for
a random sample of 65 patients receiving this procedure was $1280. Do the data provide
sufficient evidence to conclude that the mean fee charged by this clinic for this procedure is
higher than $1200? Perform the appropriate hypothesis test using a significance level of
1%. Assume that = $220.
75)
Provide an appropriate response.
76)
You wish to test the hypotheses shown below.
H0: µ= 40
Ha: µ> 40
Would you be inclined to reject the null hypothesis if the sample mean turned out to be
much smaller than 40? Explain your thinking.
76)

Perform a hypothesis test for the population mean. Assume that preliminary data analyses indicate that it is reasonable to
apply the z–test. Use the critical–value approach.
77)
A manufacturer makes steel bars that are supposed to have a mean length of 50 cm. A
retailer suspects that the bars are running too long. A sample of 38 bars is taken and their
mean length is determined to be 51 cm. Using a 1% level of significance, perform a
hypothesis test to determine whether the population mean is greater than 50 cm. Assume
that the population standard deviation is 3.6 cm.
77)
78)
In tests of a computer component, it is found that the mean time between failures is
983 hours. A modification is made which is supposed to increase reliability by increasing
the time between failures. Tests on a sample of 36 modified components produce a mean
time between failures of 983 hours. Using a 1% level of significance, perform a hypothesis
test to determine whether the mean time between failures for the modified components is
greater than 937 hours. Assume that the population standard deviation is 52 hours.
78)
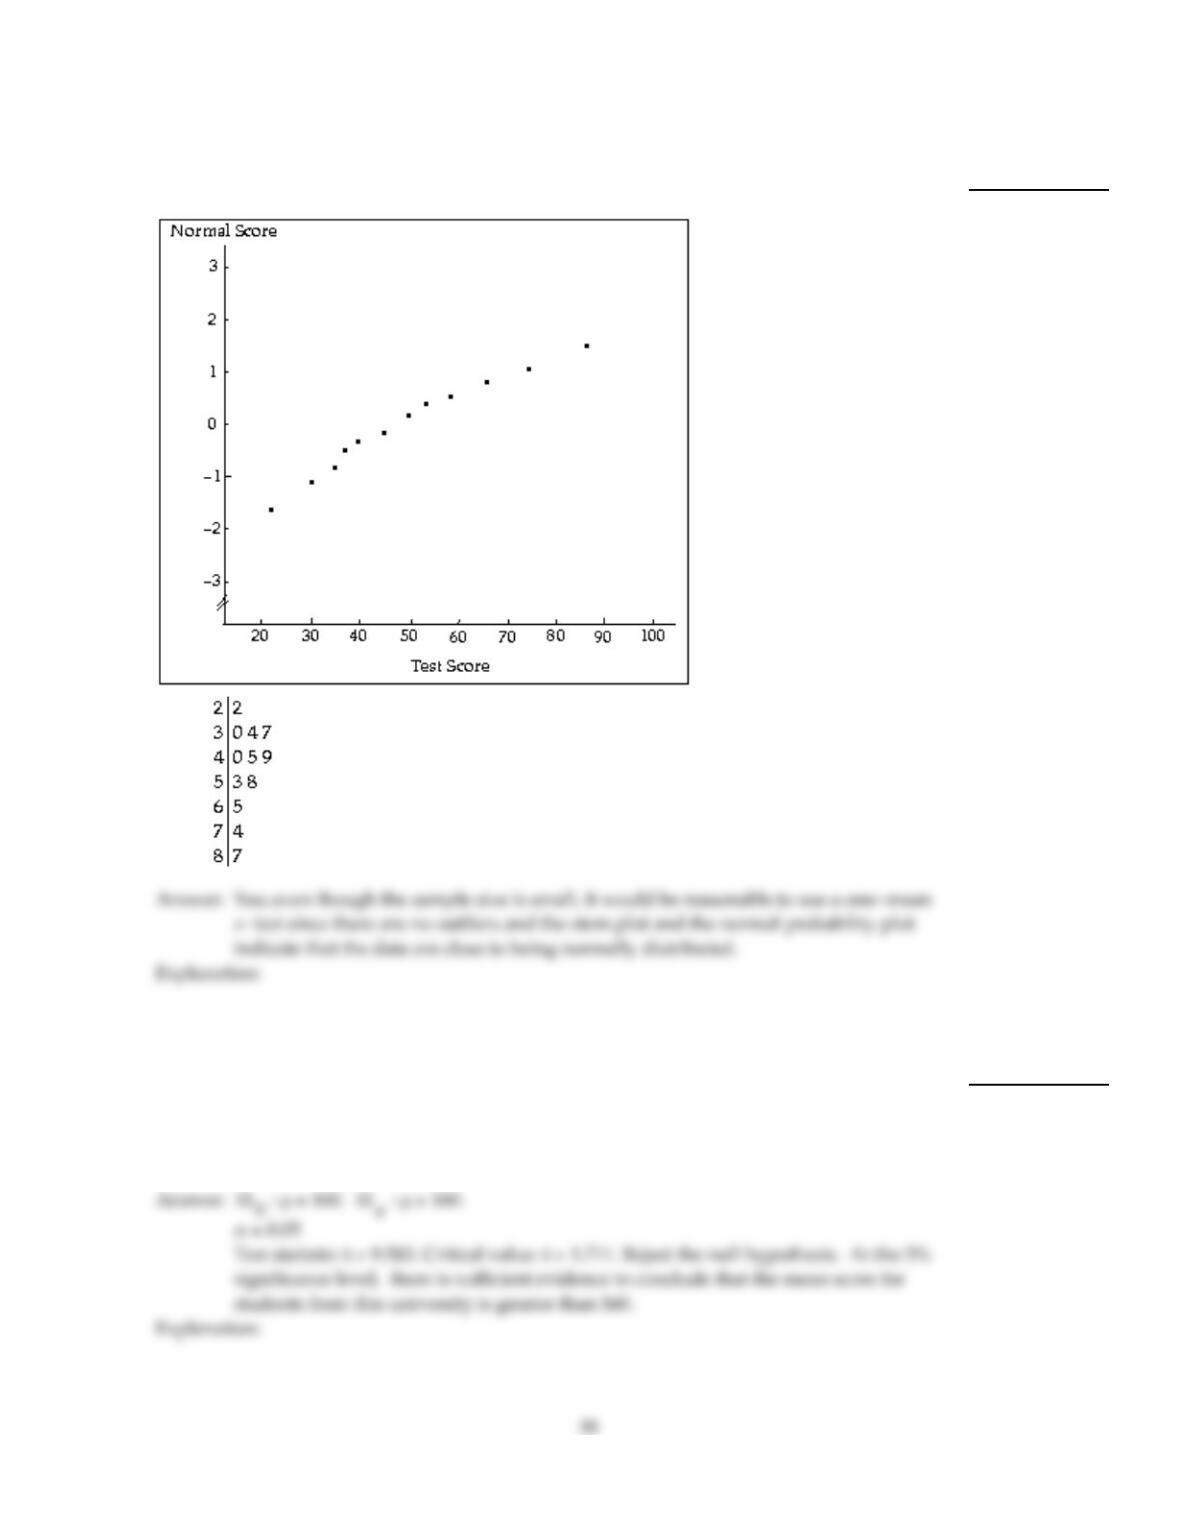
Two graphical displays are given for a set of data. A hypothesis test is to be performed for the mean of the population
from which the data were obtained. Would it be reasonable to use a one–mean z–test? Explain your reasoning. Assume
that the population standard deviation is known.
79)
A normal probability plot and a stem–and–leaf diagram of the data are given below.
79)
Preliminary data analyses indicate that it is reasonable to use a t–test to carry out the specified hypothesis test. Perform
the t–test using the critical–value approach.
80)
A large software company gives job applicants a test of programming ability and the mean
for that test has been 160 in the past. Twenty–five job applicants are randomly selected
from a large university and they produce a mean score of 183 and standard deviation of 12.
Use a 5% significance level to test whether the mean score for students from this university
is greater than 160.
80)

Preliminary data analyses indicate that it is reasonable to use a t–test to carry out the specified hypothesis test. Perform
the t–test using the P–value approach.
81)
A car manufacturer, Swanson, claims that the mean lifetime of one of its car engines is
greater than 220,000 miles, which is the mean lifetime of the engine of a competitor. The
mean lifetime for a random sample of 23 of the Swanson engines was x= 226,450 miles
with a standard deviation, s, of 11,500 miles. Test the Swanson’s claim using a significance
level of = 0.01.
81)
Provide an appropriate response.
82)
Suppose that you wish to perform a hypothesis test for a population mean. Suppose that
the population standard deviation is unknown, the population is normally distributed, and
the sample size is small. Would you perform a z–test or a t–test? Why? Would the test be
exact or approximate?
82)
83)
Suppose that you wish to perform a hypothesis test for a population mean. Which test is
more resistant to outliers, the Wilcoxon signed–rank test or the t–test? Why do you think
this is the case?
83)
A hypothesis testing situation is given. The population standard deviation, sample size, and significance level are given.
Complete the table to give the probability of a Type II error and the power for each of the given values of µ. Use the table
to draw the power curve.
84)
A hypothesis test is to be performed to determine whether the mean hematocrit
(percentage by volume of the blood occupied by red blood cells) for women differs from
the mean hematocrit for men which is known to be 47%. Preliminary data analyses indicate
that it is reasonable to apply a z–test. The hypotheses are
H0: µ= 47%
Ha: µ 47%.
Assume that the population standard deviation is 2.8%. The sample size is 10. The
significance level is 0.01. Find the probability of a Type II error and the power for µ = 42.5,
43, 44, 45, 46, 47, 48, 49, 50, 51, 51.5.
True mean P(Type II error) Power
µ1 –
42.5
43
44
45
46
84)
40