Provide an appropriate response.
130)
A researcher would like to conduct a hypothesis test to compare the mean SAT scores of students
who have received extra coaching and the mean SAT score of students who have not received extra
coaching. In this case, a paired t–test would be appropriate since a natural pairing exists (a pair
consists of a student before coaching and the same student after coaching). If the researcher instead
uses independent samples and a pooled or nonpooled t–test, how is this likely to affect the
probability of a Type II error?
130)
A)
Using independent samples, the probability of a Type II error is likely to be the same as if a
paired sample were used.
B)
Using independent samples, the probability of a Type II error is likely to be smaller than if a
paired sample is used.
C)
Using independent samples, the probability of a Type II error is likely to be larger than if a
paired sample is used.
Apply the pooled t–interval procedure to obtain the required confidence interval. You may assume that the assumptions
for using the procedure are satisfied.
131)
A researcher was interested in comparing the amount of time spent watching television by women
and by men. Independent simple random samples of 14 women and 17 men were selected and
each person was asked how many hours he or she had watched television during the previous
week. The summary statistics are as follows.
Women Men
x1=12.5 x2=17.7
s1=4.2 s2=4.8
n1= 14 n2= 17
Determine a 95% confidence interval for the difference between the mean weekly television
watching times of women and men.
131)
A)
–8.67 to –1.73 hours
B)
–8.83 to –1.57 hours
C)
–7.98 to –2.42 hours
D)
–8.55 to –1.85 hours
Apply the nonpooled t–interval procedure to obtain the required confidence interval. You may assume that the
assumptions for using the procedure are satisfied.
132)
A paint manufacturer wished to compare the drying times of two different types of paint.
Independent simple random samples of 11 cans of type A and 9 cans of type B were selected and
applied to similar surfaces. The drying times, in hours, were recorded. The summary statistics are
as follows.
Type A Type B
x1=74.2 x2=64.4
s1= 4.5 s2= 5.1
n1= 11 n2= 9
Determine a 98% confidence interval for the difference, µ1–µ2, between the mean drying time for
type A and the mean drying time for type B.
132)
A)
4.48 to 15.12 hours
B)
4.18 to 15.42 hours
C)
4.25 to 15.35 hours
D)
4.32 to 15.28 hours
Solve the problem.
133)
A researcher wants to perform a hypothesis test to determine whether the mean length of
marriages in California differs from the mean length of marriages in Texas. Identify the two
populations for the proposed hypothesis test.
133)
A)
Lengths of California marriages and lengths of Texas marriages
B)
Adults living in California and adults living in Texas
C)
Married men and married women
D)
Marriages in California and marriages in Texas
Explanation:
Provide an appropriate response.
134)
Suppose that you want to perform a hypothesis test to compare the means of two populations
using independent simple random samples. Suppose that preliminary data analyses of the samples
suggest that the distribution of the variable under consideration is skewed to the left for one
population and skewed to the right for the other. The sample sizes are 50 and 60. Should you use
the pooled t–test, the nonpooled t–test, the Mann–Whitney test, or none of these tests?
134)
A)
Mann–Whitney test
B)
pooled t–test
C)
nonpooled t–test
D)
none of these tests
Explanation:
Explanation:
135)
Suppose that you want to perform a hypothesis test to compare the means of two populations
using a paired sample. Preliminary data analyses of the sample of paired differences suggest that
the distribution of the paired–difference variable is uniform . Given that the sample size is 16,
should you use a paired t–test, a paired Wilcoxon signed–rank test, or neither of these tests?
135)
A)
Paired t–test
B)
Paired Wilcoxon signed–rank test
C)
Neither of these tests
Solve the problem.
136)
A company which designs sports shoes has made an improvement to their popular running shoe.
They hope that athletes wearing the new running shoe will be able to run faster over short
distances. They will use a paired sample to determine whether the mean time to run 100 meters for
sprinters wearing the new running shoe is less than the mean time to run the 100 meters for
sprinters wearing the old running shoe. Identify the variable for the proposed hypothesis test.
136)
A)
Type of sports shoe worn
B)
Time to run 100 meters
C)
Distance run
D)
Type of athlete
B
Provide an appropriate response.
137)
Suppose that you want to perform a hypothesis test to compare the means of two populations
using independent simple random samples. The variable under consideration is normally
distributed on each population, and the population standard deviations are equal. True or false? In
this situation, the pooled t–test will be more powerful than the Mann–Whitney test.
137)
A)
True
B)
False
A
Use the Mann–Whitney Table to find the critical values. For a left–tailed or two–tailed test, you will also need the relation
M1–A=n1(n1+n2+
1) –MA.
138)
n1= 9, n2= 6, significance level = 0.10, left–tailed test
138)
A)
57
B)
76
C)
84
D)
60
D
B

Solve.
139)
A variable of two populations has a mean of 8.3 and a standard deviation of 2.8 for one of the
populations and a mean of 9.2 and a standard deviation of 2.6 for the other population. Determine
the percentage of all pairs of independent samples of sizes 6 and 4, respectively, from the two
populations with the property that the difference x1–x2 between the samples means is between
–0.47 and 1.96.
139)
A)
34.12%
B)
37.64%
C)
35.18%
D)
32.01%
Solve the problem.
140)
A researcher wants to perform a hypothesis test to determine whether the mean credit card debt for
credit card holders aged 18–35 is greater than the mean credit card debt for credit card holders aged
over 35. Identify the two populations for the proposed hypothesis test.
140)
A)
Adults aged 18–30 and adults over 35
B)
Adults with credit card debt and adults without credit card debt
C)
Credit card holders aged 18–30 and credit card holders aged over 35
D)
Credit card debts for credit card holders aged 18–35 and credit card debts for credit card
holders over 35
Summary statistics are given for independent simple random samples from two populations. Use the nonpooled t–test to
conduct the required hypothesis test.
141)
x1=72.8, s1= 10.9, n1= 16, x2=69.9, s2= 8.2, n2= 12
Perform a right–tailed hypothesis test using a significance level of = 0.05.
141)
A)
Test statistic: t =0.803
Critical value = 1.706
Do not reject H0
B)
Test statistic: t = 2.635
Critical value = 1.708
Reject H0
C)
Test statistic: t =0.803
Critical value = 1.708
Do not reject H0
D)
Test statistic: t = 2.635
Critical value = 1.706
Reject H0
Summary statistics are given for independent simple random samples from two populations. Preliminary data analyses
indicate that the variable under consideration is normally distributed on each population. Decide whether use of the
pooled t–test and pooled t–interval procedure is reasonable. Explain your answer.
142)
x1= 143.9, s1= 42.2, n1= 13, x2= 212.9, s2= 152.7, n2= 15
142)
A)
Reasonable; the sample standard deviations suggest that the two population standard
deviations are equal.
B)
Not reasonable; the sample standard deviations suggest that the two population standard
deviations differ.
C)
Reasonable; the sample standard deviations suggest that the two population standard
deviations differ, however since the sample sizes are roughly equal, it is reasonable to use the
pooled t–test.
D)
Not reasonable; the sample means suggest that the two population means differ.
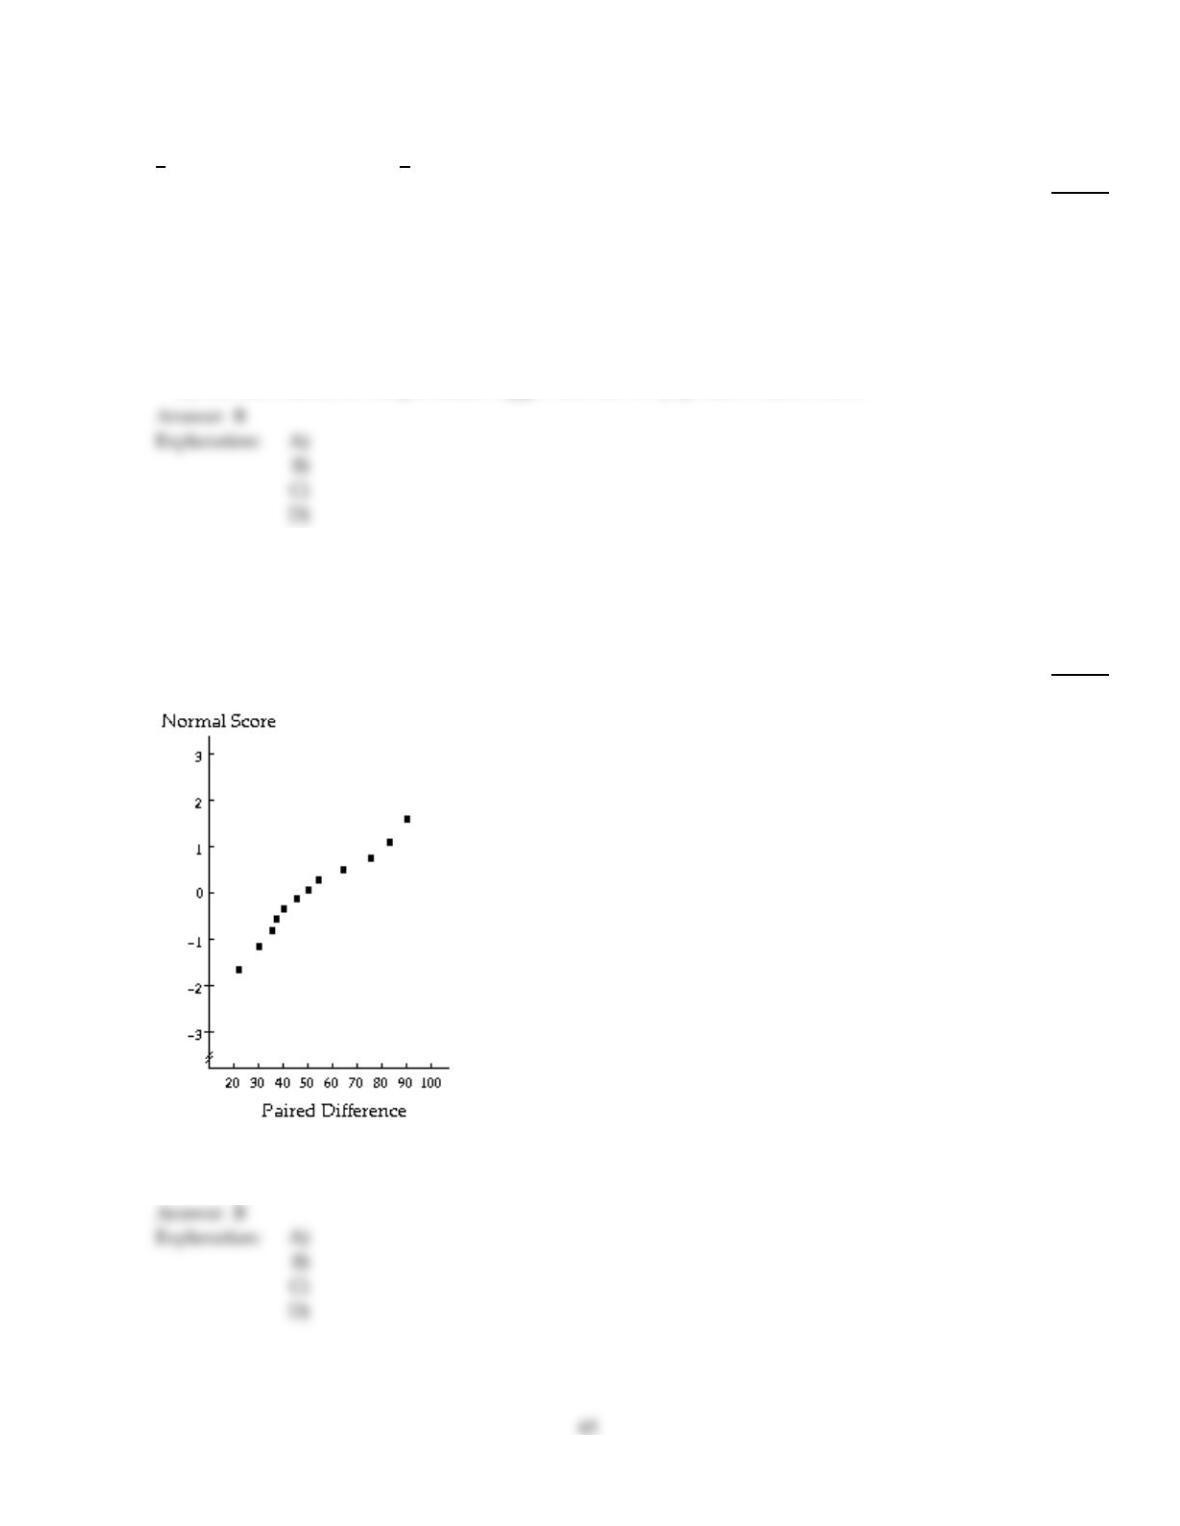
A type of sampling (independent or paired), sample size(s), and a figure showing the results of preliminary data analyses
on the sample(s) are provided. The intent is to employ the sample data to perform a hypothesis test to compare the means
of the two populations from which the data were obtained. Use the information provided to decide which procedure
should be applied.
143)
Paired; n = 12. A normal probability plot for the paired differences is given below.
143)
A)
Pooled t–test
B)
Paired t–test
C)
Paired Wilcoxon signed–rank test
D)
Nonpooled t–test
B
B
Classify the proposed hypothesis test as Two tailed, Left tailed, or Right tailed.
144)
A researcher is interested in determining whether men who have completed a postgraduate degree
(master’s or Phd) have greater earning potential than those who have completed a Bachelor’s
degree only. She will perform a hypothesis test to determine whether the mean salary of men who
have completed a postgraduate degree is greater than the mean salary of men with a Bachelor‘s
degree only.
144)
A)
Two tailed
B)
Left tailed
C)
Right tailed
Apply the nonpooled t–interval procedure to obtain the required confidence interval. You may assume that the
assumptions for using the procedure are satisfied.
145)
A researcher was interested in comparing the GPAs of students at two different colleges.
Independent simple random samples of 8 students from college A and 13 students from college B
yielded the following GPAs.
College A College B
3.7 3.8 2.8
3.2 3.2 4.0
3.0 3.0 3.6
2.5 3.9 2.6
2.7 3.8 4.0
3.6 2.5 3.6
2.8 3.9
3.4
Determine a 95% confidence interval for the difference, µ1–µ2, between the mean GPA of college
A students and the mean GPA of college B students.
(Note: x1= 3.1125, x2= 3.4385, s1= 0.4357, s2= 0.5485.)
145)
A)
–0.75 to 0.10
B)
–0.81 to 0.15
C)
–0.78 to 0.13
D)
–0.70 to 0.05
Provide an appropriate response.
146)
The forced vital capacity (FVC) is often used by physicians to assess a person’s ability to move air in
and out of their lungs. It is the maximum amount of air that can be exhaled after a deep breath. A
researcher wants to perform a hypothesis test to determine whether the mean forced vital capacity
for adults who are smokers is less than the mean forced vital capacity for adults who are former
smokers. He will use a paired sample to determine whether forced vital capacity increases, on
average, when adults stop smoking. Identify the paired–difference variable for the proposed
hypothesis test.
146)
A)
Difference between the forced vital capacity of a randomly selected adult who smokes and the
forced vital capacity of a randomly selected adult who has stopped smoking.
B)
Difference between the forced vital capacity of an adult who smokes and the forced vital
capacity of the same person after they stop smoking.
C)
An adult who smokes and the same person after they stop smoking.
D)
Difference between the mean forced vital capacity of adults who smoke and the mean forced
vital capacity of adults who have stopped smoking.
Use the paired t–interval procedure to obtain the required confidence interval. You may assume that the conditions for
using the procedure are satisfied.
147)
A coach uses a new technique in training middle distance runners. The times, in seconds, for 9
different athletes to run 800 meters before and after this training are shown below.
Athlete A B C D E F G H I
Before 115.2 120.9 108.0 112.4 107.5 119.1 121.3 110.8 122.3
After 116.0 119.1 105.1 111.9 109.1 115.2 118.5 110.7 120.9
Determine a 99% confidence interval for the difference between the mean time before and after
training.
147)
A)
–0.76 to 3.20 seconds
B)
–0.85 to 3.29 seconds
C)
–0.82 to 3.26 seconds
D)
–0.54 to 2.98 seconds
Provide an appropriate response.
148)
Suppose that you want to perform a hypothesis test based on independent simple random samples
to compare the means of two populations. Further suppose that either the variable under
consideration is normally distributed on each of the two populations or the sample sizes are large.
True or false? If the population standard deviations are quite different, then using the pooled t–test
can result in a significantly smaller Type I error probability than the one specified.
148)
A)
True
B)
False
Use the Mann–Whitney Table to find the critical values. For a left–tailed or two–tailed test, you will also need the relation
M1–A=n1(n1+n2+
1) –MA.
149)
n1= 8, n2= 4, significance level = 0.01, two–tailed test
149)
A)
40, 64
B)
38, 66
C)
12, 40
D)
39, 65
Summary statistics are given for independent simple random samples from two populations. Preliminary data analyses
indicate that the variable under consideration is normally distributed on each population. Decide whether use of the
pooled t–test and pooled t–interval procedure is reasonable. Explain your answer.
150)
x1= 143.9, s1= 13.2, n1= 7, x2= 212.9, s2= 43.7, n2= 17
150)
A)
Not reasonable; the sample standard deviations suggest that the two population standard
deviations differ and the sample sizes are not roughly equal.
B)
Reasonable; the sample standard deviations suggest that the two population standard
deviations differ, however since the sample sizes are roughly equal, it is reasonable to use the
pooled t–test.
C)
Reasonable; the sample standard deviations suggest that the two population standard
deviations are equal.
D)
Not reasonable; the sample standard deviations suggest that the two population standard
deviations are equal, however since the sample sizes are not roughly equal, it is not
reasonable to use the pooled t–test.
Use the Mann–Whitney Table to find the critical values. For a left–tailed or two–tailed test, you will also need the relation
M1–A=n1(n1+n2+
1) –MA.
151)
n1= 8, n2= 7, significance level = 0.05, left–tailed test
151)
A)
57
B)
49
C)
52
D)
60
68
Apply the pooled t–interval procedure to obtain the required confidence interval. You may assume that the assumptions
for using the procedure are satisfied.
152)
A researcher was interested in comparing the salaries of female and male employees at a particular
company. Independent simple random samples of 8 female employees and 15 male employees
yielded the following weekly salaries (in dollars).
Female Male
495 722 518
760 562 904
556 880 1150
904 520 805
520 500 480
1005 1250 970
743 750 605
660 1640
Determine a 98% confidence interval for the difference between the mean weekly salary of female
employees and the mean weekly salary of male employees at this particular company.
(Note: x1= 705.375, x2= 817.067, s1= 183.855, s2= 330.146.)
152)
A)
–$311 to $88
B)
–$411 to $188
C)
–$375 to $151
D)
–$431 to $208
Provide an appropriate response.
153)
Suppose that x is a normally distributed variable on each of two populations. Independent samples
of sizes n1 and n2, respectively, are selected from the two populations. True or false? The standard
deviation of all possible differences between the two sample means equals the square root of the
difference of the population variances each divided by the corresponding sample size.
153)
A)
True
B)
False
69
Apply the nonpooled t–interval procedure to obtain the required confidence interval. You may assume that the
assumptions for using the procedure are satisfied.
154)
A researcher was interested in comparing the salaries of female and male employees at a particular
company. Independent simple random samples of 8 female employees and 15 male employees
yielded the following weekly salaries (in dollars).
Female Male
495 722 518
760 562 904
556 880 1150
904 520 805
520 500 480
1005 1250 970
743 750 605
660 1640
Determine a 98% confidence interval for the difference, µ1–µ2, between the mean weekly salaries
of female employees and the mean weekly salaries of male employees at this particular company.
(Note: x1= 705.375, x2= 817.067, s1= 183.855, s2= 330.146.)
154)
A)
–$346 to $123
B)
–$297 to $73
C)
–$383 to $159
D)
–$431 to $208
Solve the problem.
155)
A pharmaceutical company wants to determine whether its new antianxiety medication has any
effect on resting pulse rate. They will use a paired sample to determine whether the mean resting
pulse rate for adults not taking the antianxiety medication differs from the mean resting pulse rate
for adults who are taking the antianxiety medication. Identify the variable for the proposed
hypothesis test.
155)
A)
Difference between mean resting pulse rate for those not on the medication and the mean
resting pulse rate for those on the medication
B)
Anxiety level
C)
Resting pulse rate
D)
Amount of medication taken

Provide an appropriate response.
156)
Suppose that you want to perform a hypothesis test based on independent simple random samples
to compare the means of two populations. Further suppose that either the variable under
consideration is normally distributed on each of the two populations or the sample sizes are large.
True or false? If the population standard deviations are equal, then the pooled t–test gives a larger
probability of a Type II error than the nonpooled t–test.
156)
A)
True
B)
False
Classify the proposed hypothesis test as Two tailed, Left tailed, or Right tailed.
157)
A researcher wants to use a paired sample to determine whether the mean number of hours spent
exercising per week for married men differs from the mean number of hours spent exercising per
week for married women.
157)
A)
Two tailed
B)
Left tailed
C)
Right tailed
Solve the problem.
158)
The forced vital capacity (FVC) is often used by physicians to assess a person’s ability to move air in
and out of their lungs. It is the maximum amount of air that can be exhaled after a deep breath. A
researcher wants to perform a hypothesis test to determine whether the mean forced vital capacity
for adults who are smokers is less than the mean forced vital capacity for adults who are former
smokers. He will use a paired sample to determine whether forced vital capacity increases, on
average, when adults stop smoking. Identify the two populations for the proposed hypothesis test.
158)
A)
Adults who smoke and adults who don’t smoke
B)
Adults with a high forced vital capacity and adults with a low forced vital capacity
C)
Smokers with a high forced vital capacity and smokers with a low forced vital capacity
D)
Adults who smoke and adults who are former smokers
Provide an appropriate response.
159)
True or false? In the pooled t–test, sp2 is an estimate of the unknown population variance, 2, and
it is obtained by pooling the sample variances by weighting them by degrees of freedom.
159)
A)
True
B)
False

Summary statistics are given for independent simple random samples from two populations. Use the pooled t–test to
conduct the required hypothesis test.
160)
x1=13, s1=5, n1= 10, x2=21, s2=4, n2= 14
Perform a left–tailed hypothesis test using a significance level of = 0.05.
160)
A)
Test statistic: t = – 0.916.916
Critical value = – 2.074
P–value > 0.100.100.005
Do not reject H0
B)
Test statistic: t = – 4.355
Critical value = – 2.074
P < 0.005
Reject H0
C)
Test statistic: t = – 1.526526
Critical value = – 1.717
0.05 < P < 0.10
Do not reject H0
D)
Test statistic: t = – 4.355
Critical value = – 1.717
P < 0.005
Reject H0
Summary statistics are given for independent simple random samples from two populations. Preliminary data analyses
indicate that the variable under consideration is normally distributed on each population. Decide whether use of the
pooled t–test and pooled t–interval procedure is reasonable. Explain your answer.
161)
x1= 566.9, s1=21.2, n1= 37, x2= 480.2, s2=23.5, n2= 42
161)
A)
Not reasonable; the sample means suggest that the two population means differ.
B)
Reasonable; the sample means are close to being equal suggesting that the assumption of
equal population means is reasonable. Also both sample sizes are large.
C)
Not reasonable; the sample standard deviations suggest that the two population standard
deviations differ.
D)
Reasonable; the sample standard deviations are close to being equal suggesting that the
assumption of equal population standard deviations is reasonable. Also both sample sizes are
large.
D
D
Use the paired t–interval procedure to obtain the required confidence interval. You may assume that the conditions for
using the procedure are satisfied.
162)
Ten different families are selected at random. The amount of water each family uses per day before
and after viewing a conservation video is recorded. The amounts (in gallons) are shown below.
Before 33 33 38 33 35 35 40 40 40 31
After 34 28 25 28 35 33 31 28 35 33
Determine a 90% confidence interval for the difference between the mean numbers of gallons of
water used per day before and after viewing the video.
162)
A)
2.5 to 7.1 gallons
B)
1.8 to 7.8 gallons
C)
3.8 to 5.8 gallons
D)
1.5 to 8.1 gallons
Provide an appropriate response.
163)
Suppose that you want to perform a hypothesis test based on independent simple random samples
to compare the means of two populations. Further suppose that either the variable under
consideration is normally distributed on each of the two populations or the sample sizes are large.
True or false? If you are reasonably sure that the populations have nearly equal standard
deviations, then you should use a pooled t–procedure.
163)
A)
True
B)
False
Solve the problem.
164)
A researcher wants to use a paired sample to determine whether the mean number of hours spent
exercising per week for married men differs from the mean number of hours spent exercising per
week for married women. Identify the variable for the proposed hypothesis test.
164)
A)
Hours of exercise per week
B)
Gender
C)
Marital status
D)
Difference between mean hours of exercise per week for married men and mean hours of
exercise per week for married women

Provide an appropriate response.
165)
A nutritionist wants to investigate whether her new diet will be effective in helping women aged
30–40 to lose weight. She will use a paired sample to determine whether the mean weight of
women before going on this diet is greater than the mean weight of women after being on this diet
for two months. Identify the pairs for the proposed hypothesis test.
165)
A)
Each pair consists of a randomly selected woman aged 30–40 who is not on this diet and a
randomly selected woman aged 30–40 who has been on this diet for two months.
B)
Each pair consists of a woman aged 30–40 before going on the diet and the same woman after
being on the diet for two months.
C)
Each pair consists of the weight of a woman aged 30–40 before going on the diet and the
weight of the same woman after being on the diet for two months.
D)
Each pair consists of the mean weight of woman aged 30–40 who are not on this diet and the
mean weight of woman aged 30–40 who have been on this diet for two months.
Use the Mann–Whitney Table to find the critical values. For a left–tailed or two–tailed test, you will also need the relation
M1–A=n1(n1+n2+
1) –MA.
166)
n1= 9, n2= 6, significance level = 0.10, two–tailed test
166)
A)
63, 81
B)
9, 87
C)
60, 84
D)
57, 87
Classify the proposed hypothesis test as Two tailed, Left tailed, or Right tailed.
167)
A researcher wants to perform a hypothesis test to determine whether the mean length of
marriages in California differs from the mean length of marriages in Texas.
167)
A)
Two tailed
B)
Left tailed
C)
Right tailed
74

A confidence interval (CI) for the difference µ1–µ2 between two population means is given. Interpret the confidence
interval.
168)
90% CI from –30 to 230
168)
A)
We can be 90% confident that µ1–µ2 lies somewhere between –30 and 230. Equivalently, we
can be 90% confident that µ1 is somewhere between 30 less than and 230 more than µ2.
B)
We can be 90% confident that µ2–µ1 lies somewhere between 30 and 230. Equivalently, we
can be
90% confident that µ2 is somewhere between 30 less than and 230 more than µ2.
C)
We can be 90% confident that µ1–µ2 lies somewhere between 30 and 230. Equivalently, we
can be
90% confident that µ1 is somewhere between 30 less than and 230 more than µ2.
D)
We can be 90% confident that µ1 and µ2 both lie somewhere between –30 and 230.
Provide an appropriate response.
169)
A researcher wants to use a paired sample to determine whether the mean number of hours spent
exercising per week for married men differs from the mean number of hours spent exercising per
week for married women. Identify the paired–difference variable for the proposed hypothesis test.
169)
A)
Difference between hours of weekly exercise for a married man and hours of weekly exercise
before he was married
B)
Difference between mean hours of weekly exercise of married men and mean hours of weekly
exercise of married women
C)
Difference between hours of weekly exercise of a randomly selected married man and hours
of weekly exercise of a randomly selected married woman
D)
Difference between hours of weekly exercise for a married man and hours of weekly exercise
of his wife
170)
Suppose x is a variable on each of two populations whose members can be paired and that a paired
difference is the difference between the values of the variable x on the members of a pair. True or
false? The mean of the paired differences equals the difference between the two population means.
170)
A)
True
B)
False

171)
The forced vital capacity (FVC) is often used by physicians to assess a person’s ability to move air in
and out of their lungs. It is the maximum amount of air that can be exhaled after a deep breath. A
researcher wants to perform a hypothesis test to determine whether the mean forced vital capacity
for adults who are smokers is less than the mean forced vital capacity for adults who are former
smokers. He will use a paired sample to determine whether forced vital capacity increases, on
average, when adults stop smoking. Identify the pairs for the proposed hypothesis test.
171)
A)
Each pair consists of an adult who smokes and the same person after they stop smoking.
B)
Each pair consists of the FVC of a randomly selected adult who smokes and the FVC of a
randomly selected adult who has stopped smoking.
C)
Each pair consists of the mean FVC of smokers and the mean FVC of former smokers.
D)
Each pair consists of a randomly selected adult who smokes and a randomly selected adult
who has stopped smoking.
Use the paired t–interval procedure to obtain the required confidence interval. You may assume that the conditions for
using the procedure are satisfied.
172)
If d= 3.125, sd= 2.911, and n = 8, determine a 95% confidence interval for µ1–µ2.
172)
A)
0.691 to 5.559
B)
0.215 to 6.035
C)
2.264 to 5.559
D)
2.264 to 3.986
Provide an appropriate response.
173)
A pharmaceutical company wants to determine whether its new antianxiety medication has any
effect on resting pulse rate. They will use a paired sample to determine whether the mean resting
pulse rate for adults not taking the antianxiety medication differs from the mean resting pulse rate
for adults who are taking the antianxiety medication. Identify the paired–difference variable for the
proposed hypothesis test.
173)
A)
Difference between resting pulse rate of a randomly selected adult who is not on the
antianxiety medication and the resting pulse rate of a randomly selected adult on the
antianxiety medication
B)
Difference between resting pulse rate of an adult on the medication and the pulse rate of the
same person after exercising
C)
Difference between resting pulse rate of an adult who is not on the antianxiety medication
and the resting pulse rate of the same person on the antianxiety medication
D)
Difference between mean resting pulse rate of adults not on the antianxiety medication and
the mean resting pulse rate of adults on the antianxiety medication

Determine the null and alternative hypotheses for the proposed hypothesis test.
174)
A researcher is interested in comparing the resting pulse rate of women who exercise regularly and
women who do not exercise regularly. She wants to perform a hypothesis test to determine
whether the mean resting pulse rate of women who exercise at least 6 hours per week is less than
the mean resting pulse rate of women who exercise less than 6 hours per week.
174)
A)
Let µ1 denote the mean resting pulse rate for women who exercise at least 6 hours per week
and let µ2 denote the mean resting pulse rate for women who exercise less than 6 hours per
week. The null and alternative hypotheses are H0: µ1<µ2 and Ha: µ1>µ2.
B)
Let µ1 denote the mean resting pulse rate for women who exercise at least 6 hours per week
and let µ2 denote the mean resting pulse rate for women who exercise less than 6 hours per
week. The null and alternative hypotheses are H0: µ1=µ2 and Ha: µ1<µ2.
C)
Let µ1 denote the mean resting pulse rate for women who exercise at least 6 hours per week
and let µ2 denote the mean resting pulse rate for women who exercise less than 6 hours per
week. The null and alternative hypotheses are H0: µ1=µ2 and Ha: µ1>µ2.
D)
Let x1 denote the mean resting pulse rate for women who exercise at least 6 hours per week
and let x2 denote the mean resting pulse rate for women who exercise less than 6 hours per
week. The null and alternative hypotheses are H0: x1=x2 and Ha: x1<x2.
Solve the problem.
175)
A nutritionist wants to investigate whether her new diet will be effective in helping women aged
30–40 to lose weight. She will use a paired sample to determine whether the mean weight of
women before going on this diet is greater than the mean weight of women after being on this diet
for two months. Identify the two populations for the proposed hypothesis test.
175)
A)
Adults aged 30–40 who have not been on this diet and adults aged 30–40 who have been on
this diet for two months
B)
Women aged 30–40 who have not been on this diet and women aged 30–40 who have been on
this diet for two months
C)
Women aged 30–40 who are overweight and women aged 30–40 who are not overweight
D)
Women aged 30–40 and women of other ages

Classify the proposed hypothesis test as Two tailed, Left tailed, or Right tailed.
176)
A company which designs sports shoes has made an improvement to their popular running shoe.
They hope that athletes wearing the new running shoe will be able to run faster over short
distances. They will use a paired sample to determine whether the mean time to run 100 meters for
sprinters wearing the new running shoe is less than the mean time to run the 100 meters for
sprinters wearing the old running shoe.
176)
A)
Two tailed
B)
Left tailed
C)
Right tailed
177)
A nutritionist wants to investigate whether her new diet will be effective in helping women aged
30–40 to lose weight. She will use a paired sample to determine whether the mean weight of
women before going on this diet is greater than the mean weight of women after being on this diet
for two months.
177)
A)
Two tailed
B)
Left tailed
C)
Right tailed
178)
The forced vital capacity (FVC) is often used by physicians to assess a person’s ability to move air in
and out of their lungs. It is the maximum amount of air that can be exhaled after a deep breath. A
researcher wants to perform a hypothesis test to determine whether the mean forced vital capacity
for adults who are smokers is less than the mean forced vital capacity for adults who are former
smokers. He will use a paired sample to determine whether forced vital capacity increases, on
average, when adults stop smoking.
178)
A)
Two tailed
B)
Left tailed
C)
Right tailed
Use the Mann–Whitney Table to find the critical values. For a left–tailed or two–tailed test, you will also need the relation
M1–A=n1(n1+n2+
1) –MA.
179)
n1= 5, n2= 9, significance level = 0.01, left–tailed test
179)
A)
27
B)
55
C)
20
D)
48
180)
n1= 5, n2= 10, significance level = 0.05, two–tailed test
180)
A)
56, 104
B)
26, 54
C)
64, 96
D)
24, 56

Solve.
181)
A variable of two populations has a mean of 29 and a standard deviation of 7 for one of the
populations and a mean of 29 and a standard deviation of 5 for the other population. Determine
the percentage of all pairs of independent samples of sizes 8 and 9, respectively, from the two
populations with the property that the difference x1–x2 between the samples means is between
–8.95 and 8.95.
181)
A)
99.87%
B)
90.74%
C)
95.44%
D)
99.74%
Determine the null and alternative hypotheses for the proposed hypothesis test.
182)
A researcher wants to perform a hypothesis test to determine whether the mean credit card debt for
credit card holders aged 18–35 is greater than the mean credit card debt for credit card holders aged
over 35.
182)
A)
Let x1 denote the mean credit card debt for credit card holders aged 18–35 and let x2 denote
the mean credit card debt for credit card holders over 35. The null and alternative hypotheses
are H0: x1=x2 and Ha: x1>x2.
B)
Let µ1 denote the mean credit card debt for credit card holders aged 18–35 and let µ2 denote
the mean credit card debt for credit card holders over 35. The null and alternative hypotheses
are H0: µ1>µ2 and Ha: µ1<µ2.
C)
Let µ1 denote the mean credit card debt for credit card holders aged 18–35 and let µ2 denote
the mean credit card debt for credit card holders over 35. The null and alternative hypotheses
are H0: µ1=µ2 and Ha: µ1>µ2.
D)
Let µ1 denote the mean credit card debt for credit card holders aged 18–35 and let µ2 denote
the mean credit card debt for credit card holders over 35. The null and alternative hypotheses
are H0: µ1=µ2 and Ha: µ1<µ2.
Solve the problem.
183)
A variable of two populations has a mean of 7.8 and a standard deviation of 4.5 for one of the
populations and a mean of 9.8 and a standard deviation of 4.4 for the other population. For
independent samples of sizes 3 and 8, respectively, find the standard deviation of x1–x2. Round
your answer to the nearest hundredth if necessary.
183)
A)
4.15
B)
0.1
C)
3.63
D)
13.2
Provide an appropriate response.
184)
Suppose that you want to perform a hypothesis test to compare the means of two populations
using independent simple random samples. Suppose that preliminary data analyses of the samples
suggest that the two distributions of the variable under consideration are skewed to the right and
that both distributions have the same shape. The sample sizes are small. Should you use the pooled
t–test, the nonpooled t–test, the Mann–Whitney test, or none of these tests?
184)
A)
pooled t–test
B)
Mann–Whitney test
C)
nonpooled t–test
D)
none of these tests
Solve the problem.
185)
A company which designs sports shoes has made an improvement to their popular running shoe.
They hope that athletes wearing the new running shoe will be able to run faster over short
distances. They will use a paired sample to determine whether the mean time to run 100 meters for
sprinters wearing the new running shoe is less than the mean time to run the 100 meters for
sprinters wearing the old running shoe. Identify the two populations for the proposed hypothesis
test.
185)
A)
Athletes and non athletes
B)
Sprinters wearing the new running shoe and sprinters wearing the old running shoe
C)
Athletes who run the 100 meters and athletes who run other distances
D)
Running shoes of the new design and running shoes of the existing design
Explanation:
A type of sampling (independent or paired), sample size(s), and a figure showing the results of preliminary data analyses
on the sample(s) are provided. The intent is to employ the sample data to perform a hypothesis test to compare the means
of the two populations from which the data were obtained. Use the information provided to decide which procedure
should be applied.
80
Explanation: