Exam
Name___________________________________
SHORT ANSWER. Write the word or phrase that best completes each statement or answers the question.
Provide an appropriate response.
1)
Suppose that you know the area under the standard normal curve to the right of –2. How
could you use this to find the area under the standard normal curve to the left of 2? Explain
your reasoning.
1)
2)
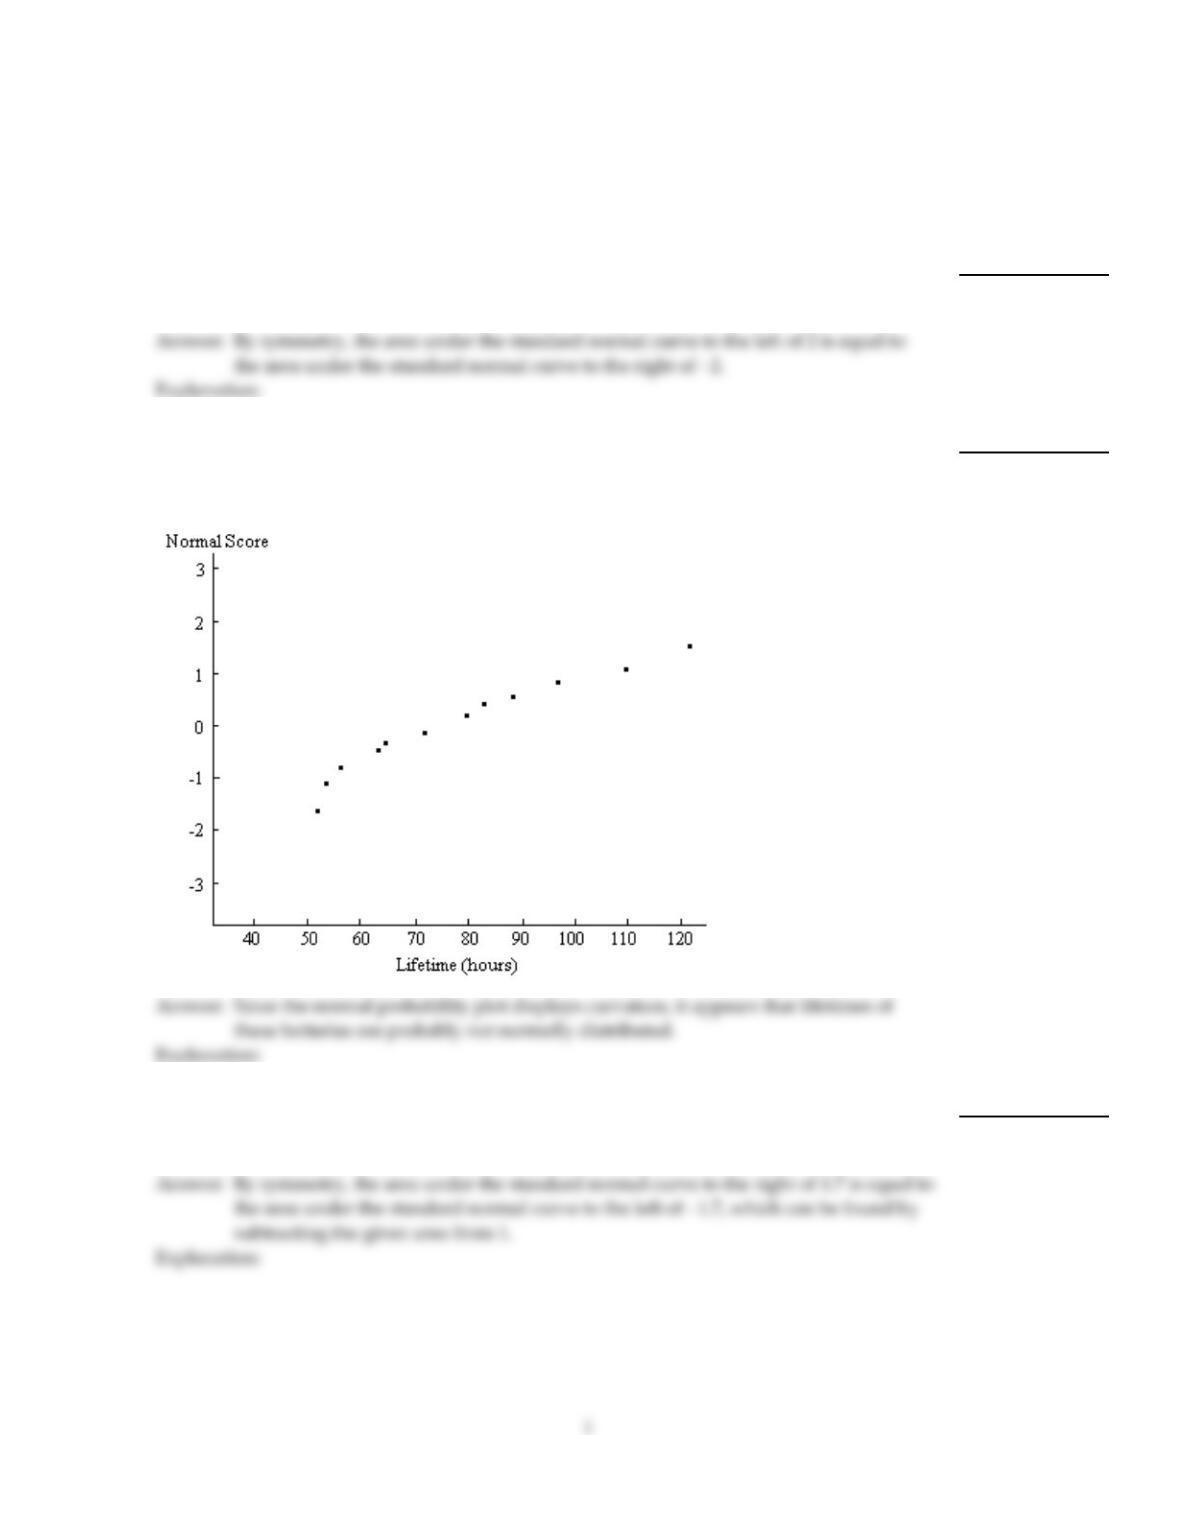
A normal probability plot is given below for the lifetimes (in hours) of a sample of batteries
of a particular brand. Use the plot to assess the normality of the lifetimes of these batteries.
Explain your reasoning.
2)
3)
Suppose that you know the area under the standard normal curve to the right of –1.7. How
could you use this to find the area under the standard normal curve to the right of 1.7?
Explain your reasoning.
3)
4)
A variable is normally distributed. 42% of the possible observations of the variable lie
between 20 and 28. What information does this give you about the graph of the normal
curve for this variable?
4)
Construct a normal probability plot of the given data.
5)
The final exam scores for 15 students in a statistics course are given below.
95 70 60 82 40
62 97 57 32 75
78 85 68 54 88
5)
Provide an appropriate response.
6)
In assessing the normality of a data set, why is it easier to interpret a normal probability
plot than it is to interpret a histogram?
6)
7)
Use a sketch of the standard normal curve to explain the difference between z–scores and
areas under the standard normal curve. What are the possible values for an area and what
are the possible values for a z–score?
7)
8)
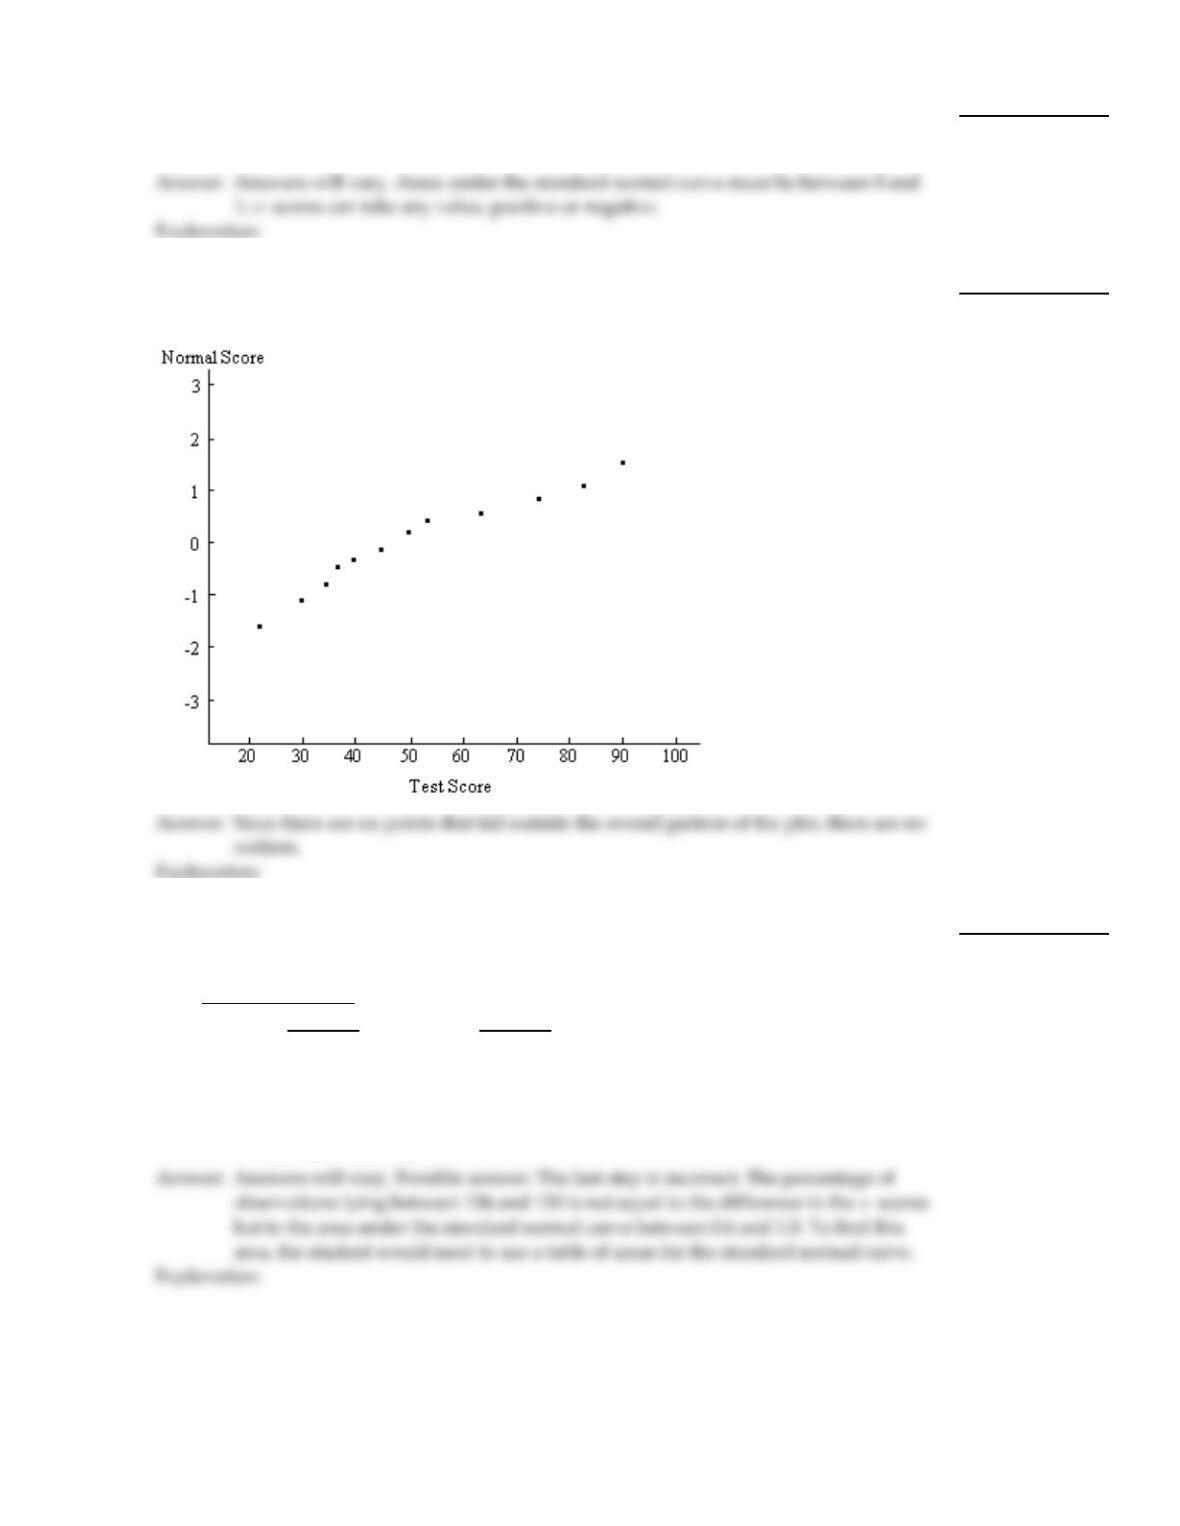
A normal probability plot is given below for a sample of scores on an aptitude test. Use the
plot to identify outliers, if any. Explain your reasoning.
8)
9)
A variable is normally distributed with a mean of 100 and a standard deviation of 10. A
student wanted to find the percentage of observations of the variable lying between 106
and 110. What is wrong with his solution?
Student’s solution:
z–scores: 106–100
10 = 0.6 110–100
10 = 1.0
Percentage of scores lying between 106 and 110
= difference between z–scores
= 1.0 – 0.6 = 0.4 = 40%
9)
3
10)
Which is larger, the area under the standard normal curve between –1 and 1, or the area
under the standard normal curve between 0 and 2? Explain your reasoning.
10)
11)
Suppose that scores on a test are normally distributed with a mean of 80 and a standard
deviation of 8. You have been asked to find the 70th percentile. After sketching a standard
normal curve and shading the area of interest, the next step in solving this problem is to
use the table of areas. Would you look for 0.7 in the body of the table or in the left–hand
column? Explain your reasoning.
11)
12)
Fill in the blanks.
A balanced die is rolled 210 times. You wish to find the probability that the number of fives
is between 30 and 38 inclusive. This probability can be estimated by finding the area
between _____ and ___ under the normal curve with µ= ____ and = ___.
12)
13)
Generally, the normal probability plot for a data set must be roughly linear in order to
assume that the variable is approximately normally distributed. Should this rule be
interpreted more strictly for small data sets or for large data sets? Explain.
13)
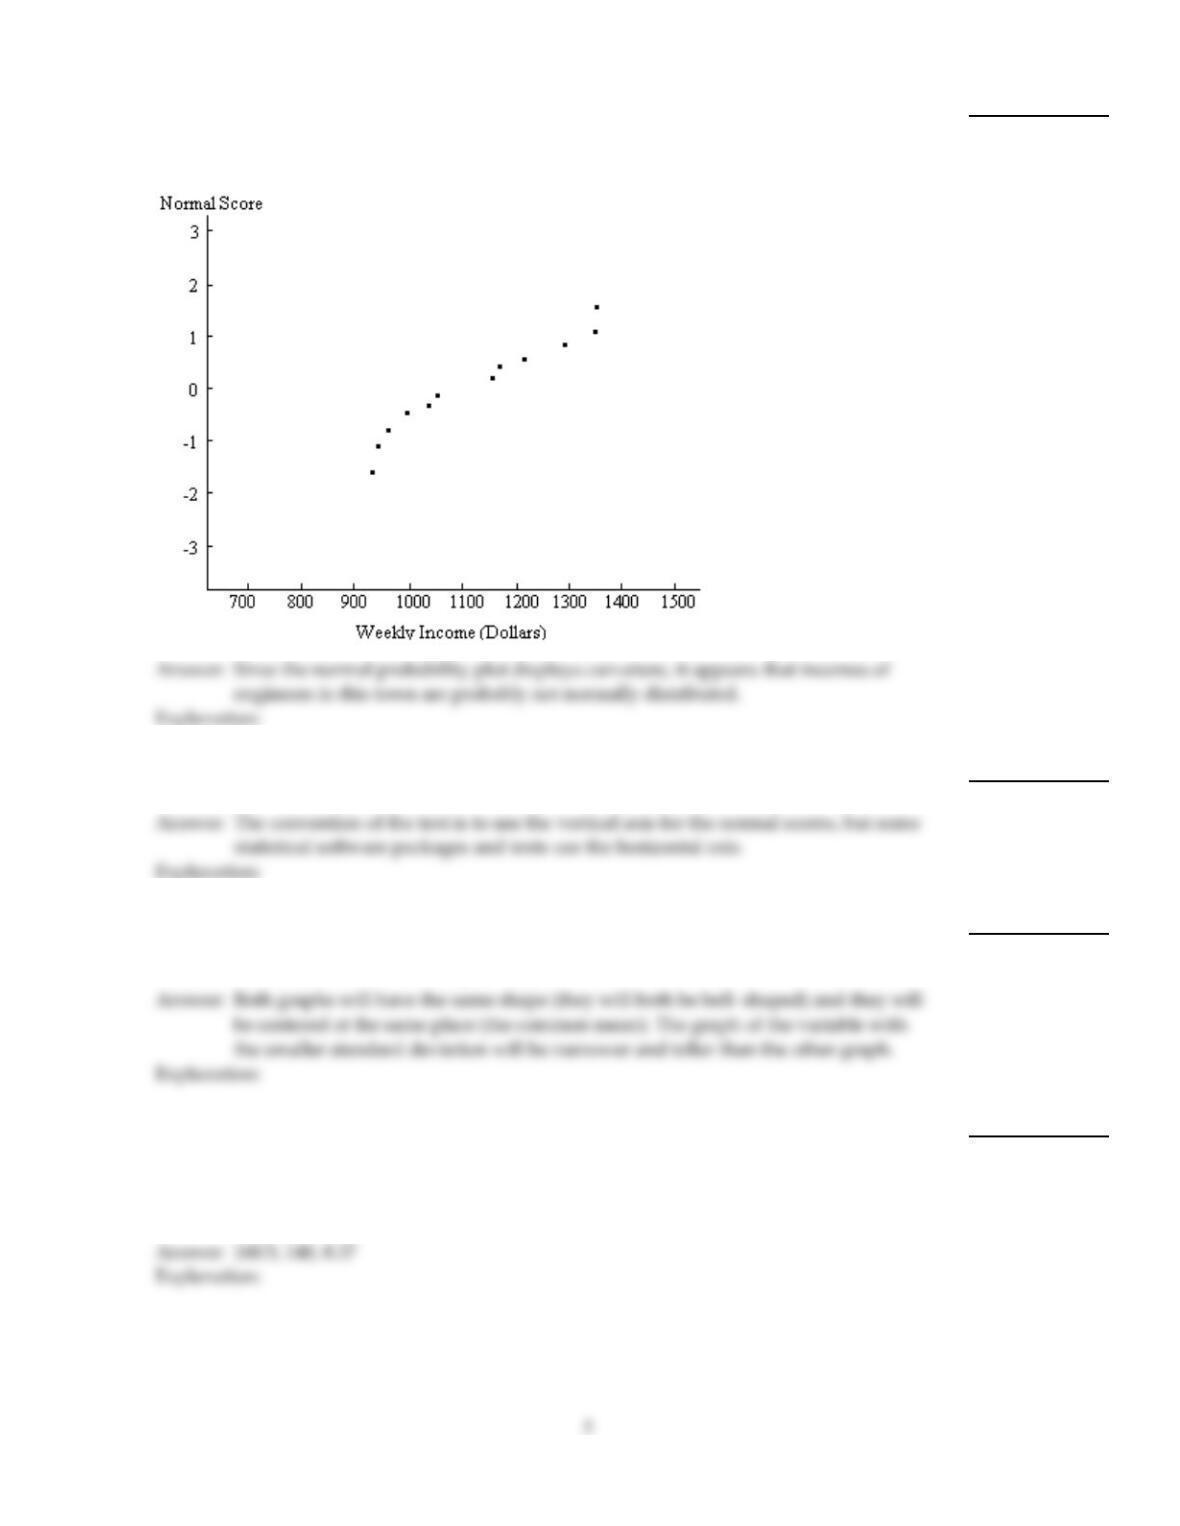
14)
A normal probability plot is given below for the weekly incomes (in dollars) of a sample of
engineers in one town. Use the plot to assess the normality of the incomes of engineers in
this town. Explain your reasoning.
14)
15)
When a normal probability plot is constructed, which axis is used for the normal scores
(horizontal or vertical)?
15)
16)
Two random variables are normally distributed with the same mean. One has a standard
deviation of 10 while the other has a standard deviation of 15. How will the graphs of the
two variables differ and how will they be alike?
16)
17)
Fill in the blanks.
A fair coin is flipped 280 times. You wish to find the probability that the number of tails is
greater than 160. This probability can be estimated by finding the area to the right of
_____ under the normal curve with µ= ____ and = ___.
17)
18)
A student wished to use a table of areas for the standard normal curve to find the z–score
having an area to its right of 0.52. The student started by looking for the closest area to 0.52
in the body of the table and reading off the corresponding z–score which was 0.05. She
then subtracted this z–score from 1 to get 0.95. Was her reasoning correct? If not, where did
she go wrong and how would you have solved the problem?
18)
Construct a normal probability plot of the given data.
19)
The weekly incomes (in dollars) of a sample of 12 nurses working at a Los Angeles hospital
are given below.
500 750 630 480
550 650 720 780
820 960 1200 770
19)
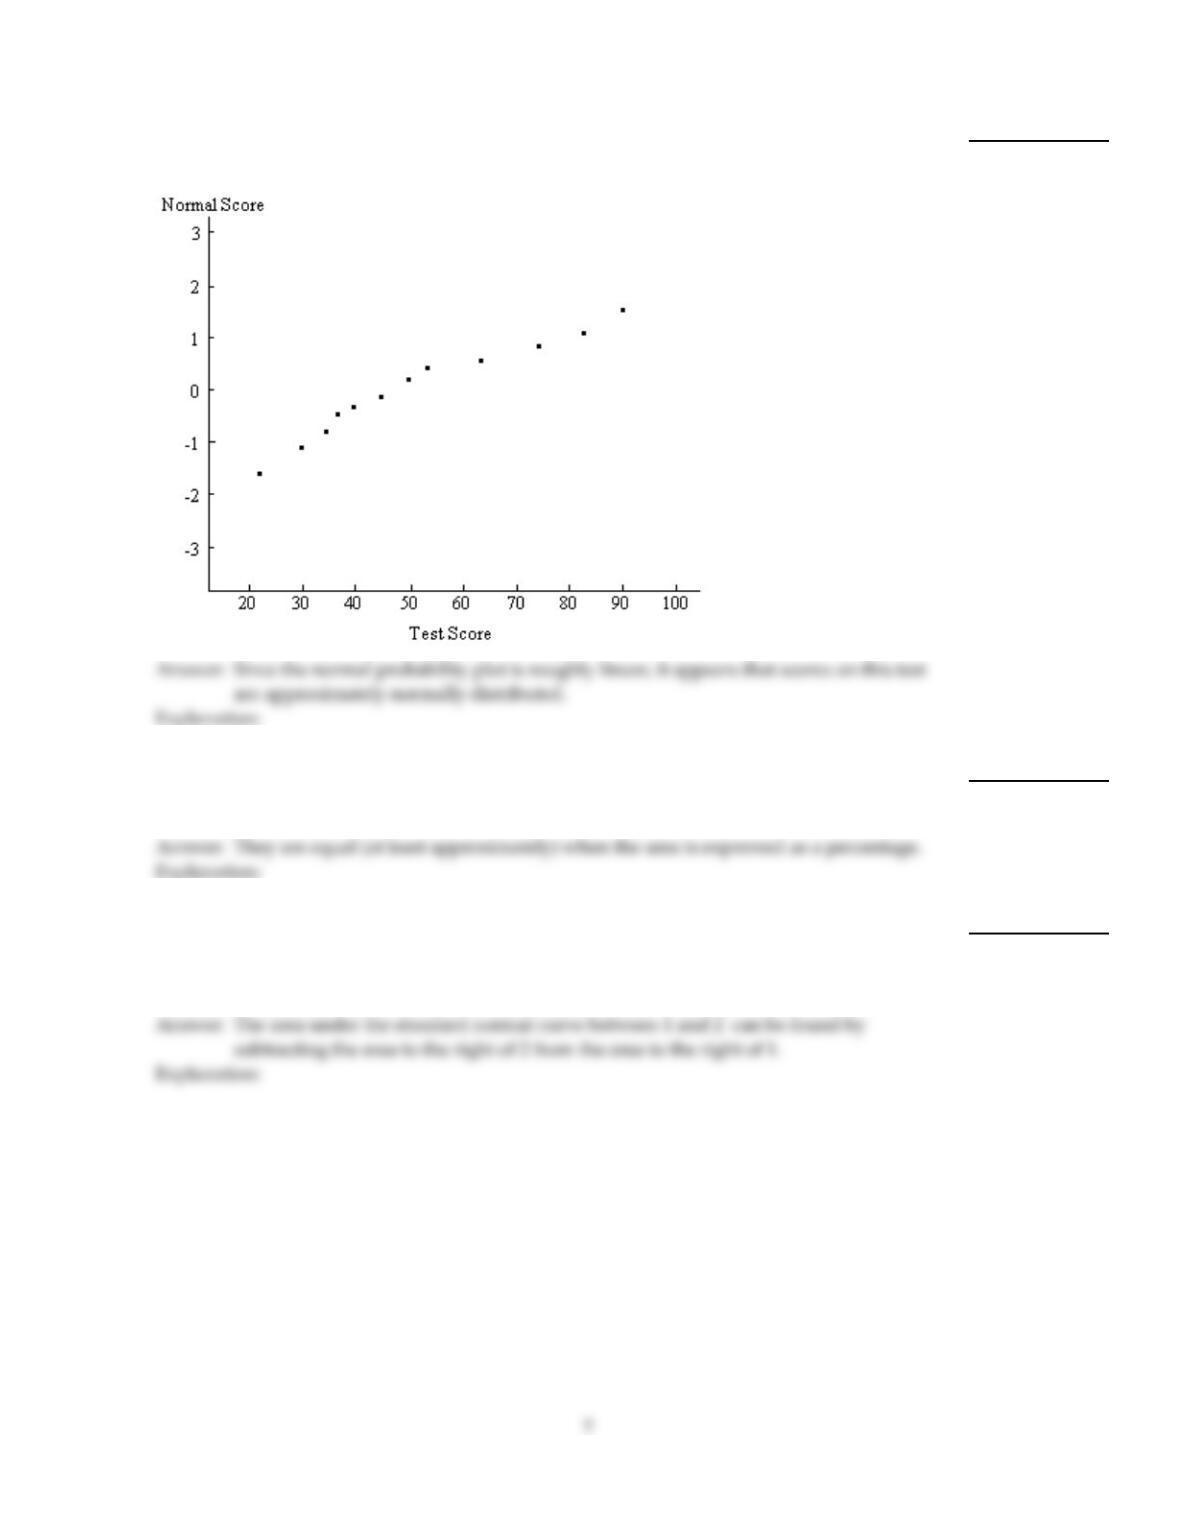
Provide an appropriate response.
20)
A normal probability plot is given below for a sample of scores on an aptitude test. Use the
plot to assess the normality of scores on this test. Explain your reasoning.
20)
21)
For a variable with a density curve, what is the relationship between the percentage of all
possible observations of the variable that lie within any specified range and the
corresponding area under its density curve?
21)
22)
Suppose that you know the area under the standard normal curve to the right of 2 and the
area under the standard normal curve to the right of 1. Without further consulting a table
of areas, how could you find the area under the standard normal curve between 1 and 2?
Explain your reasoning.
22)
23)
According to data from the American Medical Association, 10% of us are left–handed.
Suppose a group of 500 people is randomly selected. You wish to find the probability that
at least 80 are left–handed. Describe the characteristics of this problem which help you to
recognize that the problem is about a binomial distribution that you are to solve by
estimating with the normal distribution. (Assume that you would not use a computer, a
table, or the binomial probability formula.)
23)
24)
Fill in the blanks.
A balanced die is rolled 240 times. You wish to find the probability that the number of ones
is at most 50. This probability can be estimated by finding the area that is to the left of
_____ under the normal curve with µ= ____ and = ___.
24)
25)
In assessing the normality of data, why is a normal probability plot especially
advantageous for small samples?
25)
26)
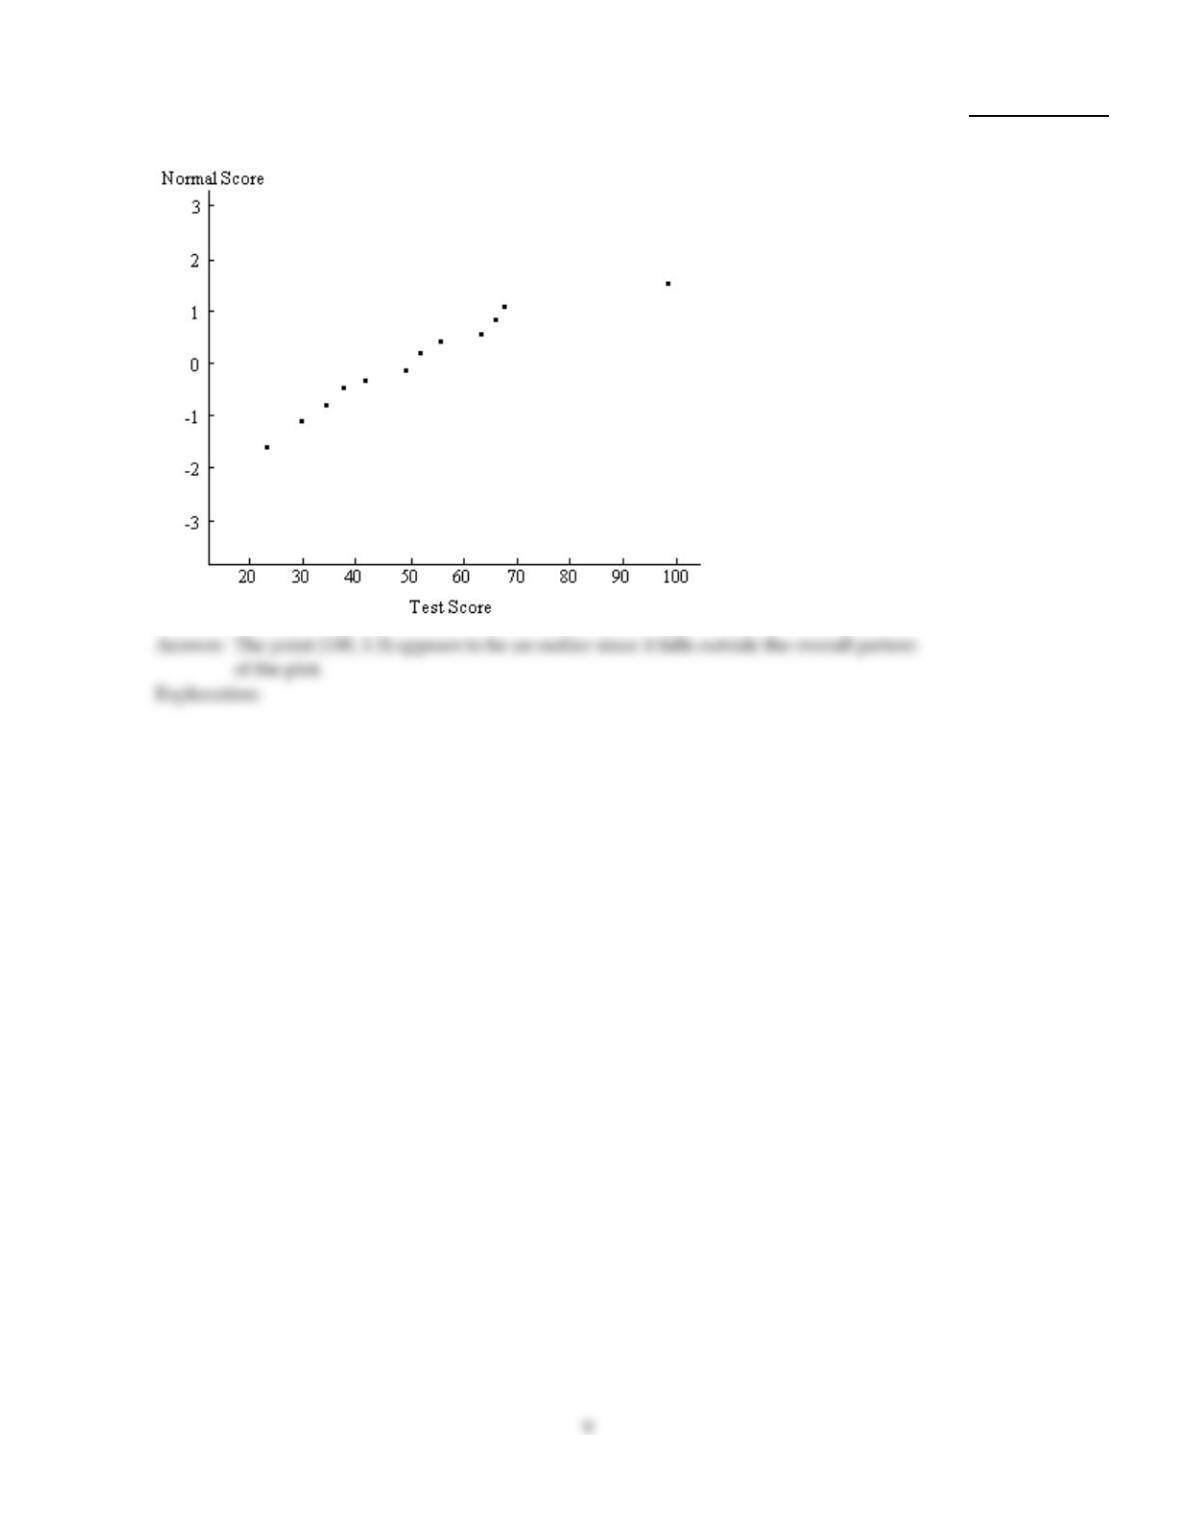
A normal probability plot is given below for a sample of scores on an aptitude test. Use the
plot to identify outliers, if any. Explain your reasoning.
26)
Construct a normal probability plot of the given data.
27)
The prices per gallon (in dollars) of regular unleaded gasoline at twelve service stations are
given below.
1.79 2.09 1.89 1.99
1.75 1.81 1.93 2.19
2.01 2.15 1.95 1.85
27)
Provide an appropriate response.
28)
A curve has area 0.276 to the left of 5 and area 0.627 to the right of 5. Could this curve be a
density curve for some variable? Explain your answer.
28)
29)
Suppose that scores on a test are normally distributed with a mean of 80 and a standard
deviation of 8. Read the two questions below.
A. What is the 90th percentile?
B. What percentage of students score less than 90?
Explain the difference between the two questions. Describe how the method for solving A
would differ from the the method for solving B. Be sure to include in your explanation a
description of how the table of areas would be used in each case.
29)
30)
Explain why a continuity correction factor is necessary when approximating the binomial
distribution by the normal distribution. Refer to the terms “discrete” and “continuous”, and
draw a diagram to support your answer.
30)
31)
Under what conditions are you allowed to use the normal distribution to approximate the
binomial distribution? Under what conditions might you want to use the normal
distribution to approximate the binomial as opposed to using the binomial probability
formula, a table of binomial probabilities, or a computer?
31)
32)
Fill in the blanks.
A fair coin is flipped 360 times. You wish to find the probability that the number of tails is
less than 150. This probability can be estimated by finding the area that is to the left of
_____ under the normal curve with µ= ____ and = ___.
32)
33)
Suppose that you know the area under the standard normal curve between 1 and 3 and the
area under the standard normal curve to the left of 3. Without further consulting a table of
areas, how could you find the area under the standard normal curve to the left of 1?
Explain your reasoning by using a sketch of the standard normal curve.
33)
34)
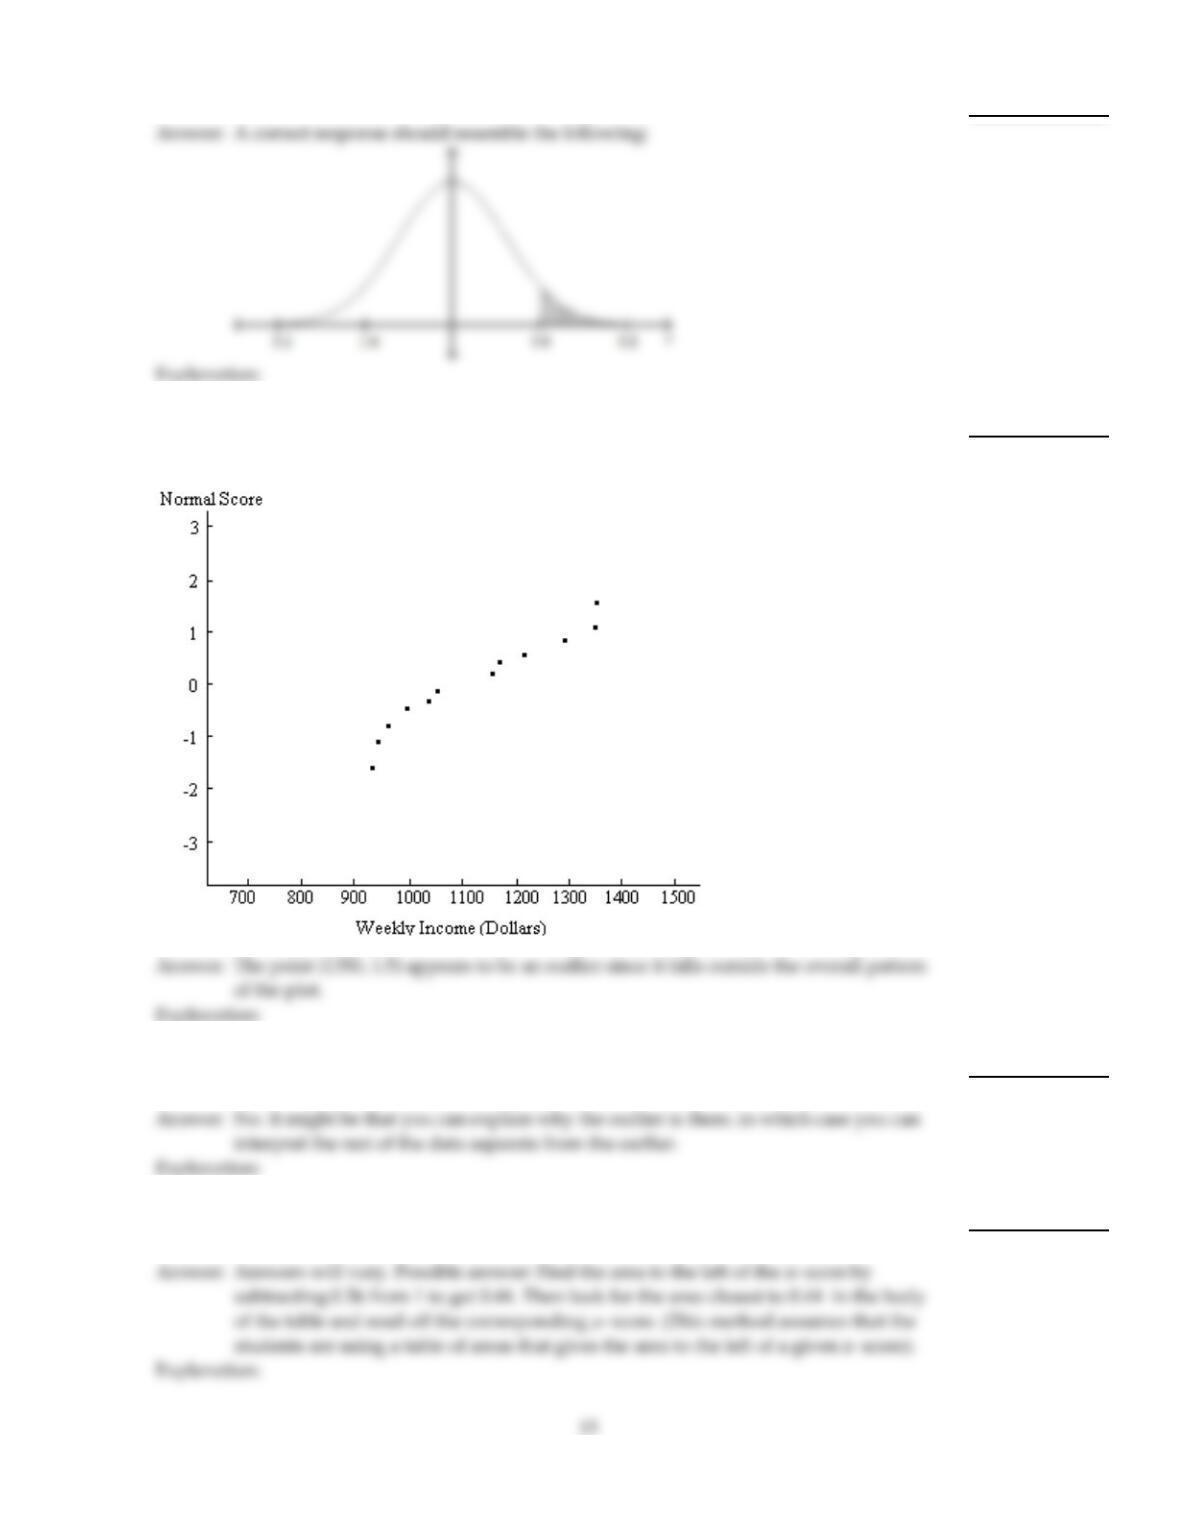
A normal probability plot is given below for a sample of scores on an aptitude test. Use the
plot to assess the normality of scores on this test. Explain your reasoning.
34)
35)
Sketch a standard normal curve and shade the area between the z–scores –2.5 and –1.
35)
36)
Sketch a standard normal curve and shade the area to the right of the z–score 1.6.
36)
37)
A normal probability plot is given below for the weekly incomes (in dollars) of a sample of
engineers in one town. Use the plot to identify outliers, if any. Explain your reasoning.
37)
38)
Does the presence of an outlier in your data set necessarily mean that you cannot use the
normal model to interpret the data? Explain.
38)
39)
The area under the standard normal curve to the right of a z–score is 0.56. Explain how
you could use a table of areas to find the z–score.
39)
40)
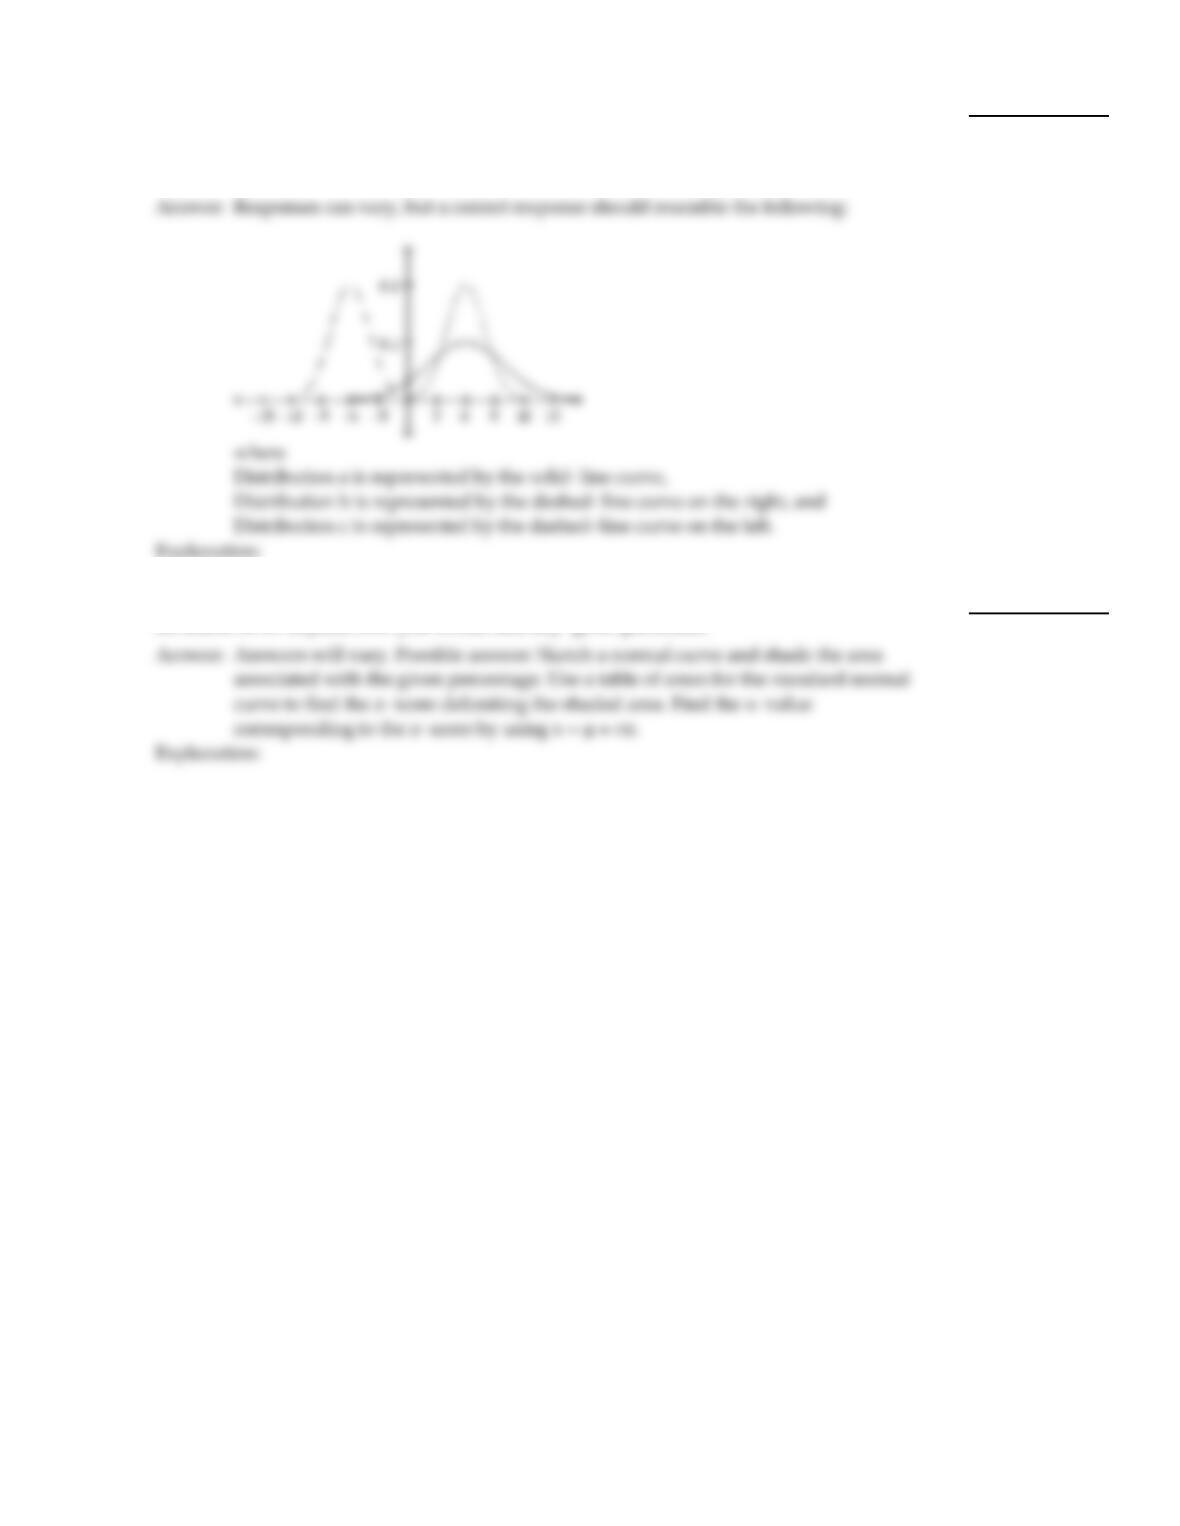
On the same axes sketch normal distributions with
a. µ= 6, = 4
b. µ= 6, = 2
c. µ= – 6, = 2.
40)
41)
Scores on an aptitude test are normally distributed with a mean of 400 and a standard
deviation of 60. Explain how you would find any given percentile.
41)
14
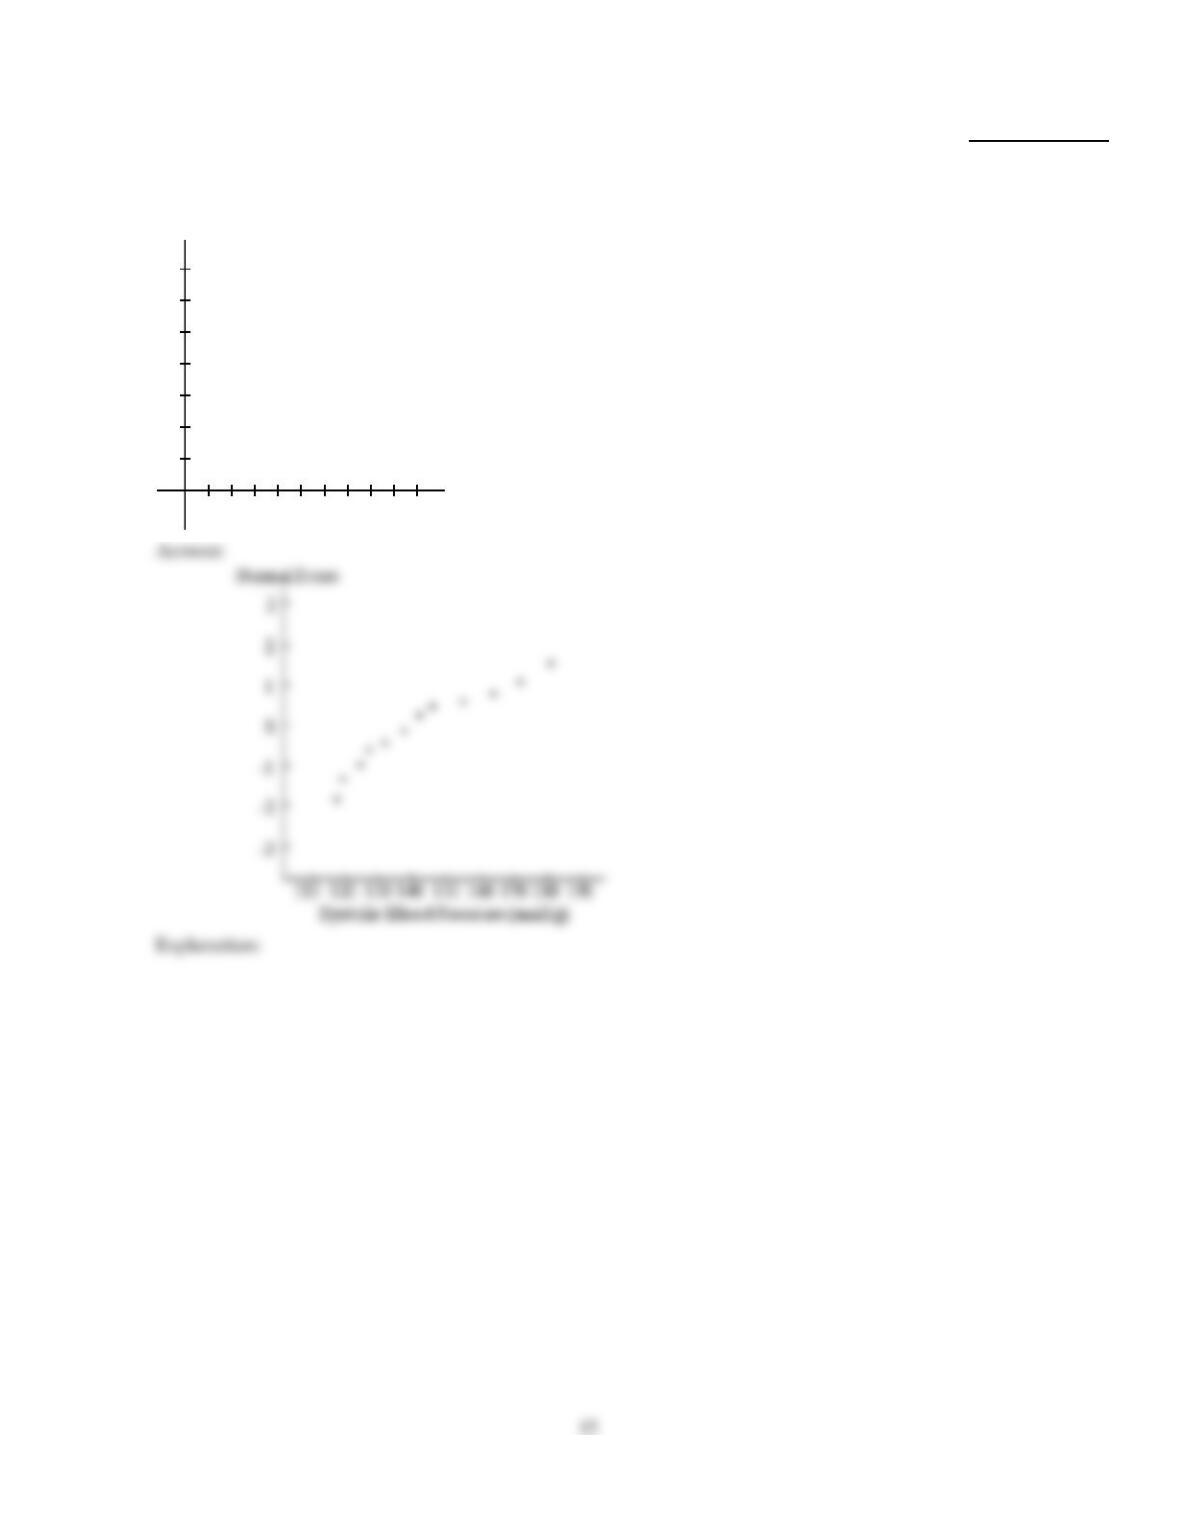
Construct a normal probability plot of the given data.
42)
The systolic blood pressure (in mmHg) is given below for a sample of 12 men aged between
60 and 65.
127 135 118 164
143 130 125 153
120 173 140 180
42)
43)
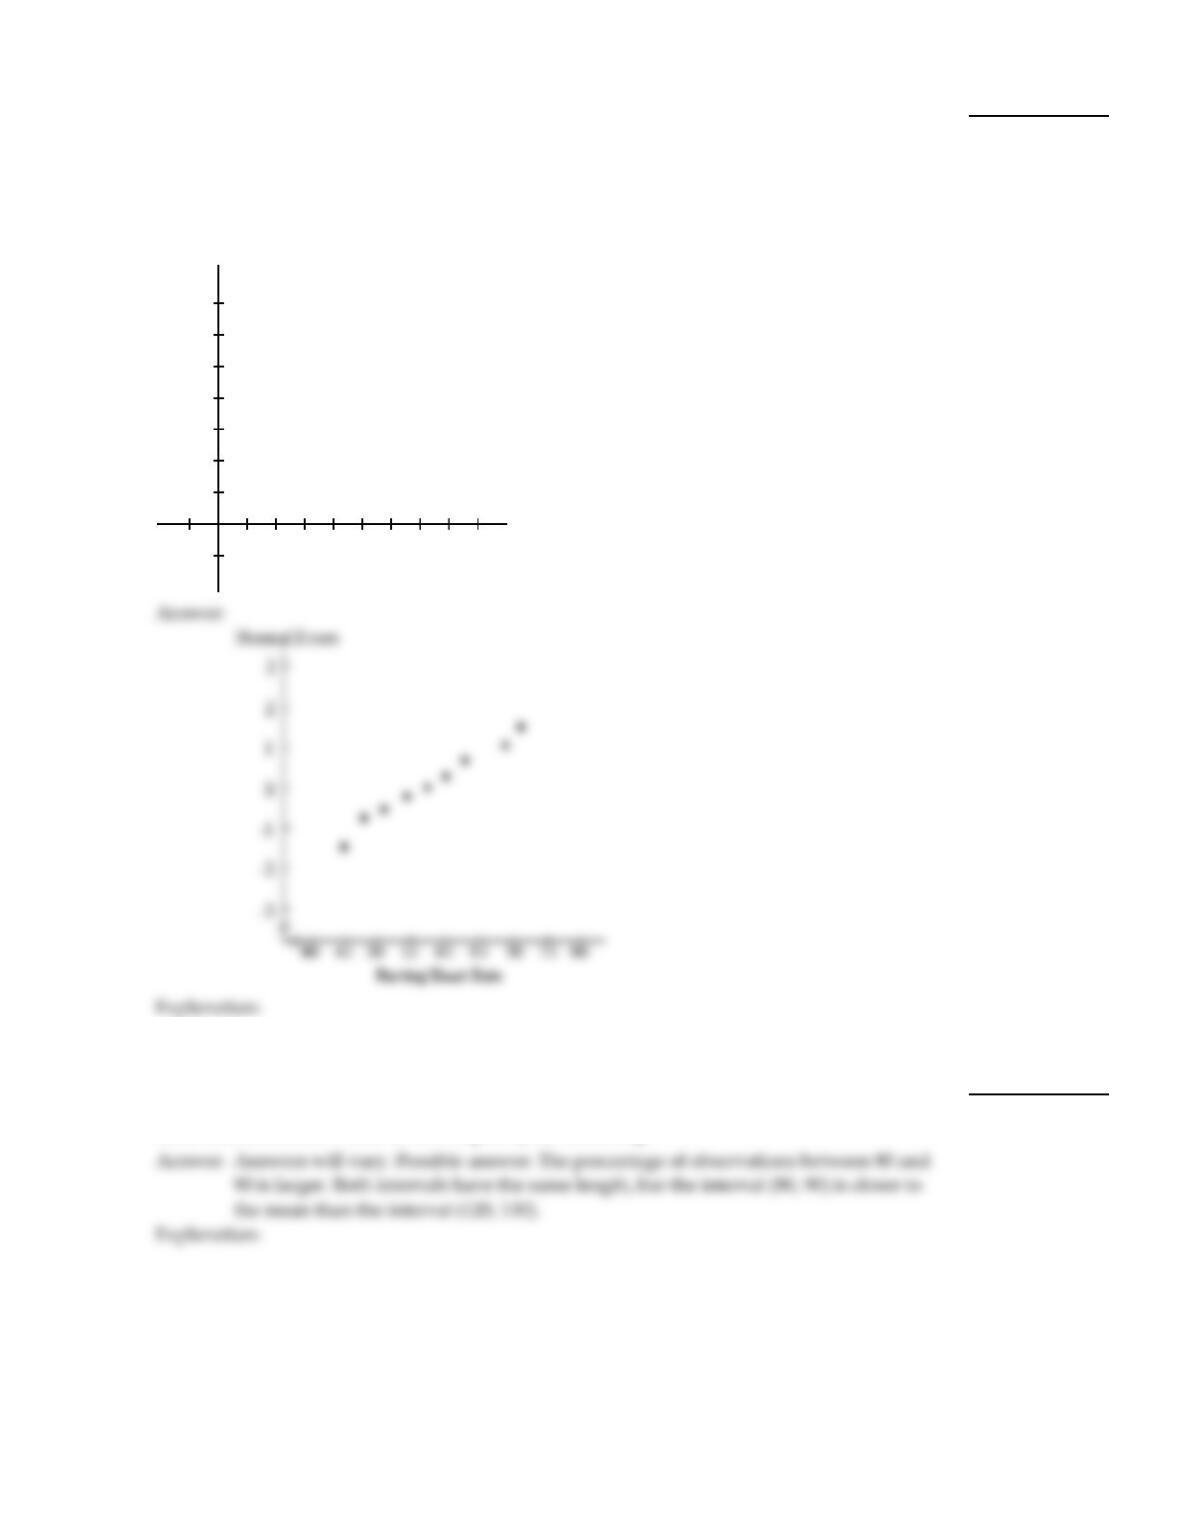
The resting heart rates from a group of 9 men before starting a workout program are given
below.
58 70 63
48 60 55
45 51 69
43)
Provide an appropriate response.
44)
A variable is normally distributed with a mean of 100 and a standard deviation of 10.
Which is larger, the percentage of observations between 80 and 90 or the percentage of
observations between 120 and 130? Explain your reasoning.
44)
16
45)
How does the standard normal distribution differ from a nonstandard normal distribution?
Why is it necessary to standardize in order to find percentages for nonstandard normal
variables?
45)
46)
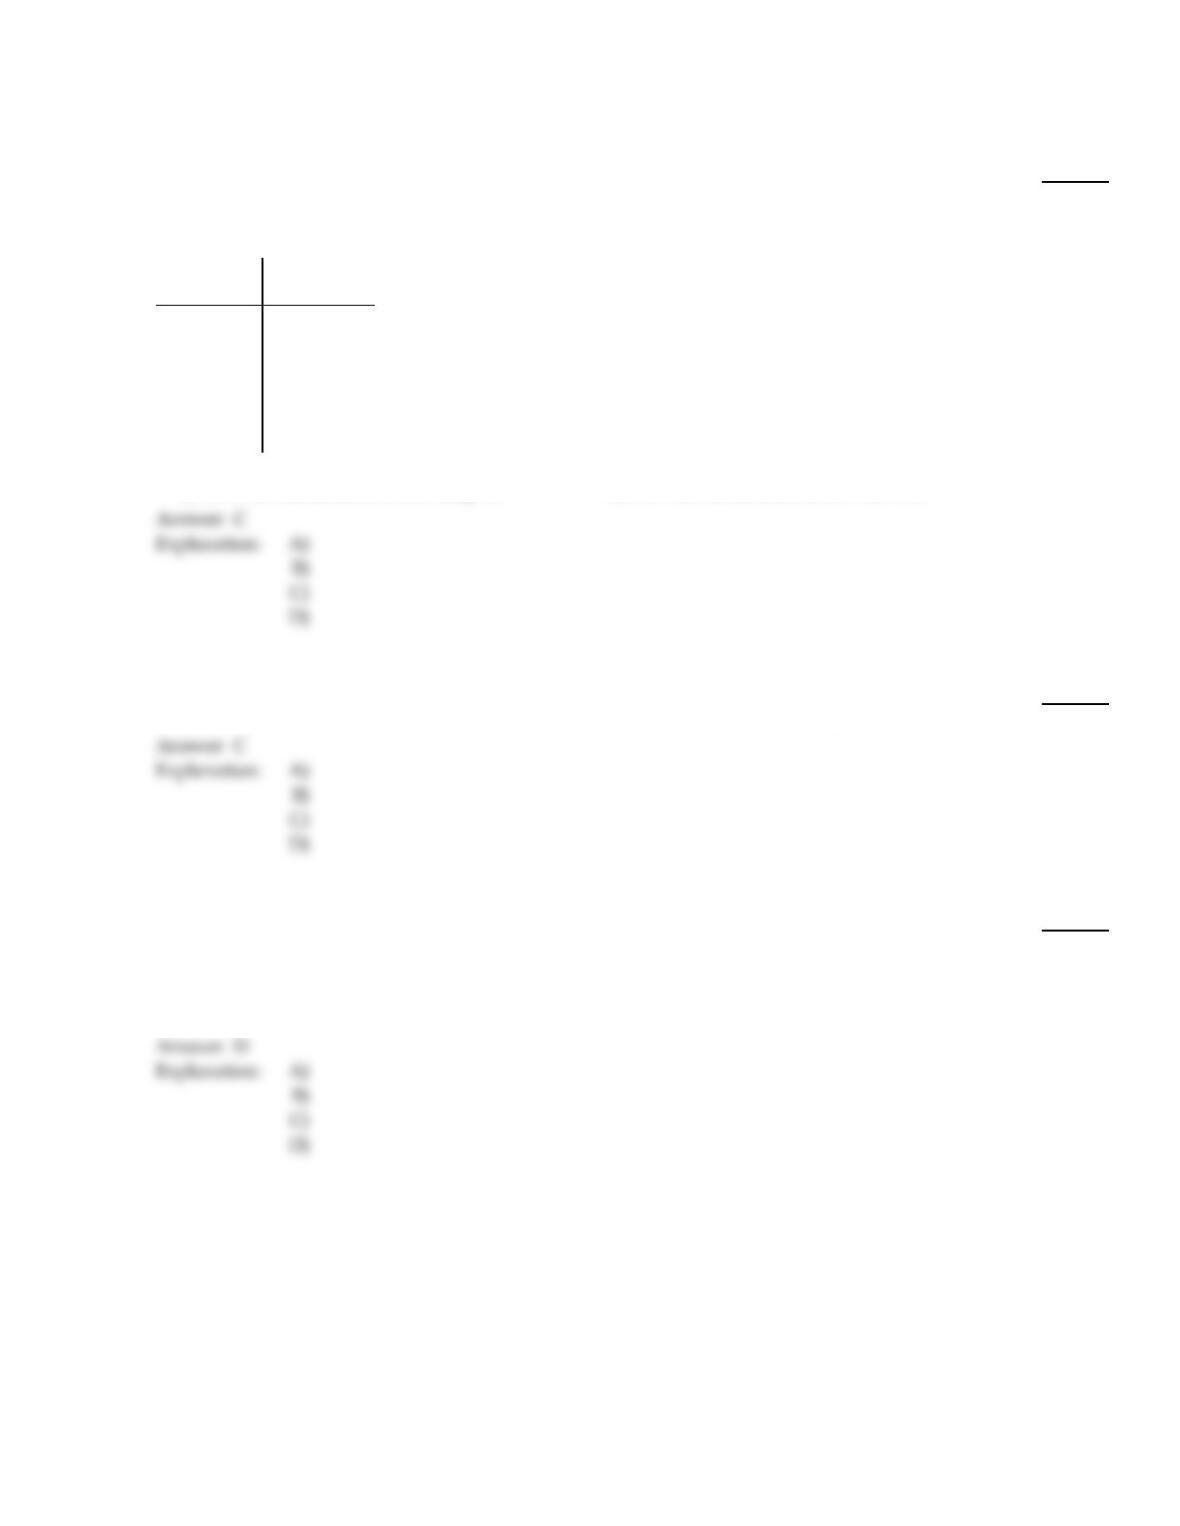
A normal probability plot is given below for the lifetimes (in hours) of batteries of a
particular type. Use the plot to identify outliers, if any. Explain your reasoning.
46)
MULTIPLE CHOICE. Choose the one alternative that best completes the statement or answers the question.
Solve the problem.
47)
Data were reported for household size (number of people in household) in a small community. The
size distribution is given in the table. Obtain a relative–frequency histogram for these data and
determine whether the household sizes are approximately normally distributed.
Size
(# of people)
Frequency
1–under 2 2
2–under 3 11
3–under 4 35
4–under 5 41
5–under 6 7
6–under 7 3
47)
A)
No. The distribution is uniform.
B)
No. The distribution is right–skewed.
C)
Yes. The distribution is bell–shaped.
D)
No. The distribution is left–skewed.
Estimate the indicated probability by using the normal distribution as an approximation to the binomial distribution.
48)
With n = 20 and p = 0.60, estimate P(less than or equal to 8).
48)
A)
0.4953
B)
0.4332
C)
0.0548
D)
0.0668
Use the empirical rule to solve the problem.
49)
The annual precipitation for one city is normally distributed with a mean of 25.9 inches and a
standard deviation of 3.5 inches. Fill in the blanks.
In 99.74% of the years, the precipitation in this city is between ___ and ___ inches.
49)
A)
18.9, 32.9
B)
18.9, 25.9
C)
25.9, 36.4
D)
15.4, 36.4
18
Use a table of areas for the standard normal curve to find the required z–score.
50)
Determine the two z–scores that divide the area under the standard normal curve into a middle
0.96 area and two outside 0.02 areas.
50)
A)
0 and 2.05
B)
–2.05 and 2.05
C)
–2.33 and 2.33
D)
–1.75 and 1.75
Use a table of areas to obtain the shaded area under the standard normal curve.
51)
51)
A)
0.7198
B)
0.2802
C)
0.1401
D)
0.8599
52)
52)
A)
0.0183
B)
0.9634
C)
0.0366
D)
0.9817
Find the indicated probability or percentage for the normally distributed variable.
53)
The volumes of soda in quart soda bottles are normally distributed with a mean of 32.3 oz and a
standard deviation of 1.2 oz. What is the probability that the volume of soda in a randomly selected
bottle will be less than 32 oz?
53)
A)
0.3821
B)
0.5987
C)
0.0987
D)
0.4013
Solve the problem.
54)
Data were reported for household size (number of people in household) in a small community. The
size distribution is given in the table. Obtain a relative–frequency histogram for these data and
determine whether the household sizes are approximately normally distributed.
Size
(# of people)
Frequency
1–under 2 4
2–under 3 33
3–under 4 30
4–under 5 12
5–under 6 6
6–under 7 3
54)
A)
No. The distribution has outliers.
B)
Yes. The distribution is bell–shaped.
C)
No. The distribution is right–skewed.
D)
No. The distribution is left–skewed.
Find the specified percentile, quartile, or decile.
55)
The serum cholesterol levels for men in one age group are normally distributed with a mean of
178.1 and a standard deviation of 40.5. All units are in mg/100 mL. Find the 9th percentile.
55)
A)
107.6 mg/100mL
B)
165.1 mg/100mL
C)
161.5 mg/100mL
D)
123.8 mg/100mL
56)
Assume that women have heights that are normally distributed with a mean of 63.6 inches and a
standard deviation of 2.5 inches. Find the value of the third quartile.
56)
A)
64.3 inches
B)
67.8 inches
C)
66.1 inches
D)
65.3 inches