
Exam
Name___________________________________
MULTIPLE CHOICE. Choose the one alternative that best completes the statement or answers the question.
Provide an appropriate response.
1)
Suppose that you are performing a 2–test for a population standard deviation. Which of the
following statements regarding the distribution of the test statistic is true?
1)
A)
If the null hypothesis is false, the test statistic has a chi–square distribution with df = n.
B)
If the null hypothesis is true, the test statistic has a chi–square distribution with df = n.
C)
If the null hypothesis is false, the test statistic has a chi–square distribution with df = n–1.
D)
If the null hypothesis is true, the test statistic has a chi–square distribution with df = n–1.
2)
A hypothesis test for two population standard deviations is to be performed. Independent random
samples of sizes n1and n2are drawn from the two populations. The variable under
consideration is normally distributed on each of the two populations. The hypotheses are:
H0: 1=2
Ha: 1<2
Which of the following would provide evidence against the null hypothesis in favor of the
alternative?
2)
A)
s2
1/ s2
2 is much bigger or much smaller than 1.
B)
s2
1/ s2
2 is much bigger than 1.
C)
s2
1/ s2
2 is too close to 1.
D)
s2
1/ s2
2 is much smaller than 1.
3)
Suppose that you are performing a 2–test for a population standard deviation. The hypotheses are
as follows.
H0: = 2
Ha: < 2
Which of the following statements regarding the criterion for rejecting the null hypothesis is true?
3)
A)
H0 will be rejected if the sample standard deviation is too much bigger or too much smaller
than 2.
B)
H0 will be rejected if the sample standard deviation is too much smaller than 2.
C)
H0 will be rejected if the sample standard deviation is too much bigger than 2.
D)
H0 will be rejected if the sample standard deviation is too close to 2.
SHORT ANSWER. Write the word or phrase that best completes each statement or answers the question.
Perform the required hypothesis test for two population standard deviations. Assume that independent samples have
been randomly selected from the two populations and that the variable under consideration is normally distributed on
both populations. Use the critical–value approach.
4)
When 25 randomly selected customers enter any one of several waiting lines, their waiting
times have a standard deviation of 5.95 minutes. When 17 randomly selected customers
enter a single main waiting line, their waiting times have a standard deviation of 2.11
minutes. Do the data provide sufficient evidence to conclude that there is more variation
in the waiting times when several lines are used? Perform an F–test at the 1% significance
level.
4)
Perform the required chi–square hypothesis test. Preliminary data analyses and other information indicate that it is
reasonable to assume that the variable under consideration is normally distributed. Use the critical–value approach or the
P–value approach as indicated.
5)
Heights of men aged 25 to 34 have a standard deviation of 2.9 in. Use a 0.05 significance
level to test whether the heights of women aged 25 to 34 have a different standard
deviation. The heights (in inches) of 16 randomly selected women aged 25 to 34 are listed
below. Use the critical–value approach.
(Note: s = 2.279 in.)
62.13 65.09 64.18 66.72 63.09 61.15 67.50 64.65
63.80 64.21 60.17 68.28 66.49 62.10 65.73 64.72
5)
Decide whether applying one–standard–deviation chi–square procedures to the given data appears reasonable. Explain
your answer.
6)
A machine that fills soda bottles is supposed to fill them to a mean volume of 16.2 fluid
ounces. A random sample of 20 filled bottles produced the following volumes in fluid
ounces:
16.3 15.9 16.7 15.3 17.1 16.4 3.9 15.9 16.2 3.4
16.4 8.2 15.5 16.5 16.0 16.3 15.8 16.7 16.5 15.5
6)
Perform the required hypothesis test for two population standard deviations. Assume that independent samples have
been randomly selected from the two populations and that the variable under consideration is normally distributed on
both populations. Use the critical–value approach.
7)
The manager of a juice bottling factory is considering installing a new juice bottling
machine which she hopes will reduce the amount of variation in the volumes of juice
dispensed into 8–fluid–ounce bottles. Random samples of 9 bottles filled by the new
machine and 10 bottles filled by the old machine yielded the following volumes of juice (in
fluid ounces).
New machine: 8.0, 8.1, 8.0, 8.1, 7.9, 8.0, 7.9, 8.0, 8.1
Old machine: 7.9, 8.0, 7.9, 7.9, 8.5, 7.9, 8.1,8.2, 8.2, 7.9
Do the data provide sufficient evidence to conclude that there is less variation in the
volumes of juice filled by the new machine than in the volumes of juice filled by the old
machine? Perform an F–test at the 10% significance level.
(Note: s1= 0.0782, s2=0.2014)
7)
Perform the required chi–square hypothesis test. Preliminary data analyses and other information indicate that it is
reasonable to assume that the variable under consideration is normally distributed. Use the critical–value approach or the
P–value approach as indicated.
8)
The standard deviation of math test scores at one high school is 16.1. The standard
deviation of the math scores of a random sample of 22 girls was 14.5. Use a significance
level of 0.01 to test whether the standard deviation, , of the girls’ test scores is smaller
than 16.1. Use the critical–value approach.
8)
Provide an appropriate response.
9)
A machine dispenses a liquid drug into bottles in such a way that the standard deviation of
the volumes dispensed is 81 microliters. A new machine is tested on a sample of 24
containers and the standard deviation for this sample group is found to be 50 microliters.
Why would it be important to perform a hypothesis test to determine whether the standard
deviation, , of the volumes dispensed by the new machine is less than 81 microliters?
9)
Decide whether applying one–standard–deviation chi–square procedures to the given data appears reasonable. Explain
your answer.
10)
The masses, in grams, of 19 plants of a certain type are given below.
5 8 9 15 17 18 18
21 24 25 26 28 28 31
32 33 35 42 42
10)
Perform the required chi–square hypothesis test. Preliminary data analyses and other information indicate that it is
reasonable to assume that the variable under consideration is normally distributed. Use the critical–value approach or the
P–value approach as indicated.
11)
For randomly selected adults, IQ scores are normally distributed with a standard deviation
of 15. The scores of 14 randomly selected college students are listed below. Use a 0.10
significance level to test the claim that the standard deviation of IQ scores of college
students is less than 15. Use the P–value approach. (Note: s = 9.819)
115 128 107 109 116 124 135
127 115 104 118 126 129 133
11)
5
12)
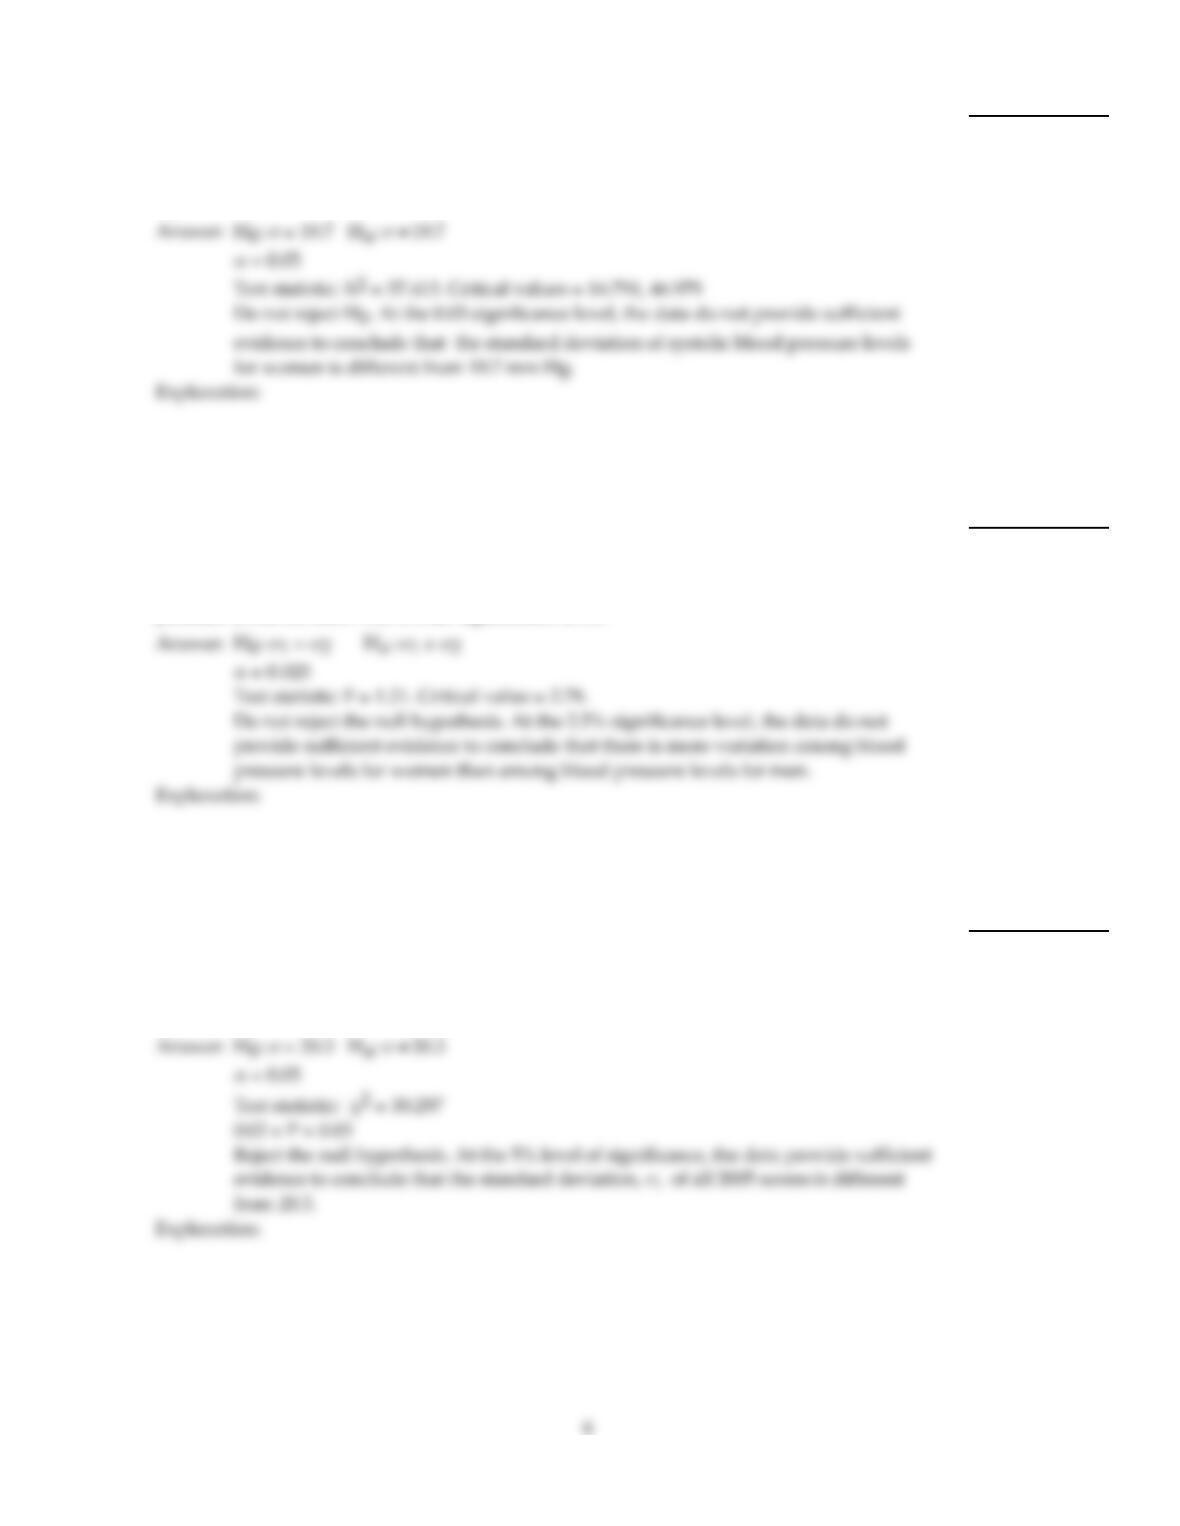
Systolic blood pressure levels for men have a standard deviation of 19.7 mm Hg. A random
sample of 31 women resulted in systolic blood pressure levels with a standard deviation of
22 mm Hg. Use a 0.05 significance level to test whether the standard deviation of systolic
blood pressure levels for women is different from 19.7 mm Hg. Use the critical–value
approach.
12)
Perform the required hypothesis test for two population standard deviations. Assume that independent samples have
been randomly selected from the two populations and that the variable under consideration is normally distributed on
both populations. Use the critical–value approach.
13)
A random sample of 16 women resulted in blood pressure levels with a standard deviation
of 21.8 mm Hg. A random sample of 17 men resulted in blood pressure levels with a
standard deviation of 19.8 mm Hg. Do the data provide sufficient evidence to conclude
that there is more variation among blood pressure levels for women than among blood
pressure levels for men? Use a 0.025 significance level .
13)
Perform the required chi–square hypothesis test. Preliminary data analyses and other information indicate that it is
reasonable to assume that the variable under consideration is normally distributed. Use the critical–value approach or the
P–value approach as indicated.
14)
In 2000, the standard deviation of the scores of all students taking a particular test was 20.3.
In 2005, the standard deviation of the scores of a random sample of 18 students taking the
same test was s = 27.1. At the 5% level of significance, do the data provide sufficient
evidence to conclude that the standard deviation, , of all 2005 scores is different from the
2000 standard deviation of 20.3? Use the P–value approach.
14)
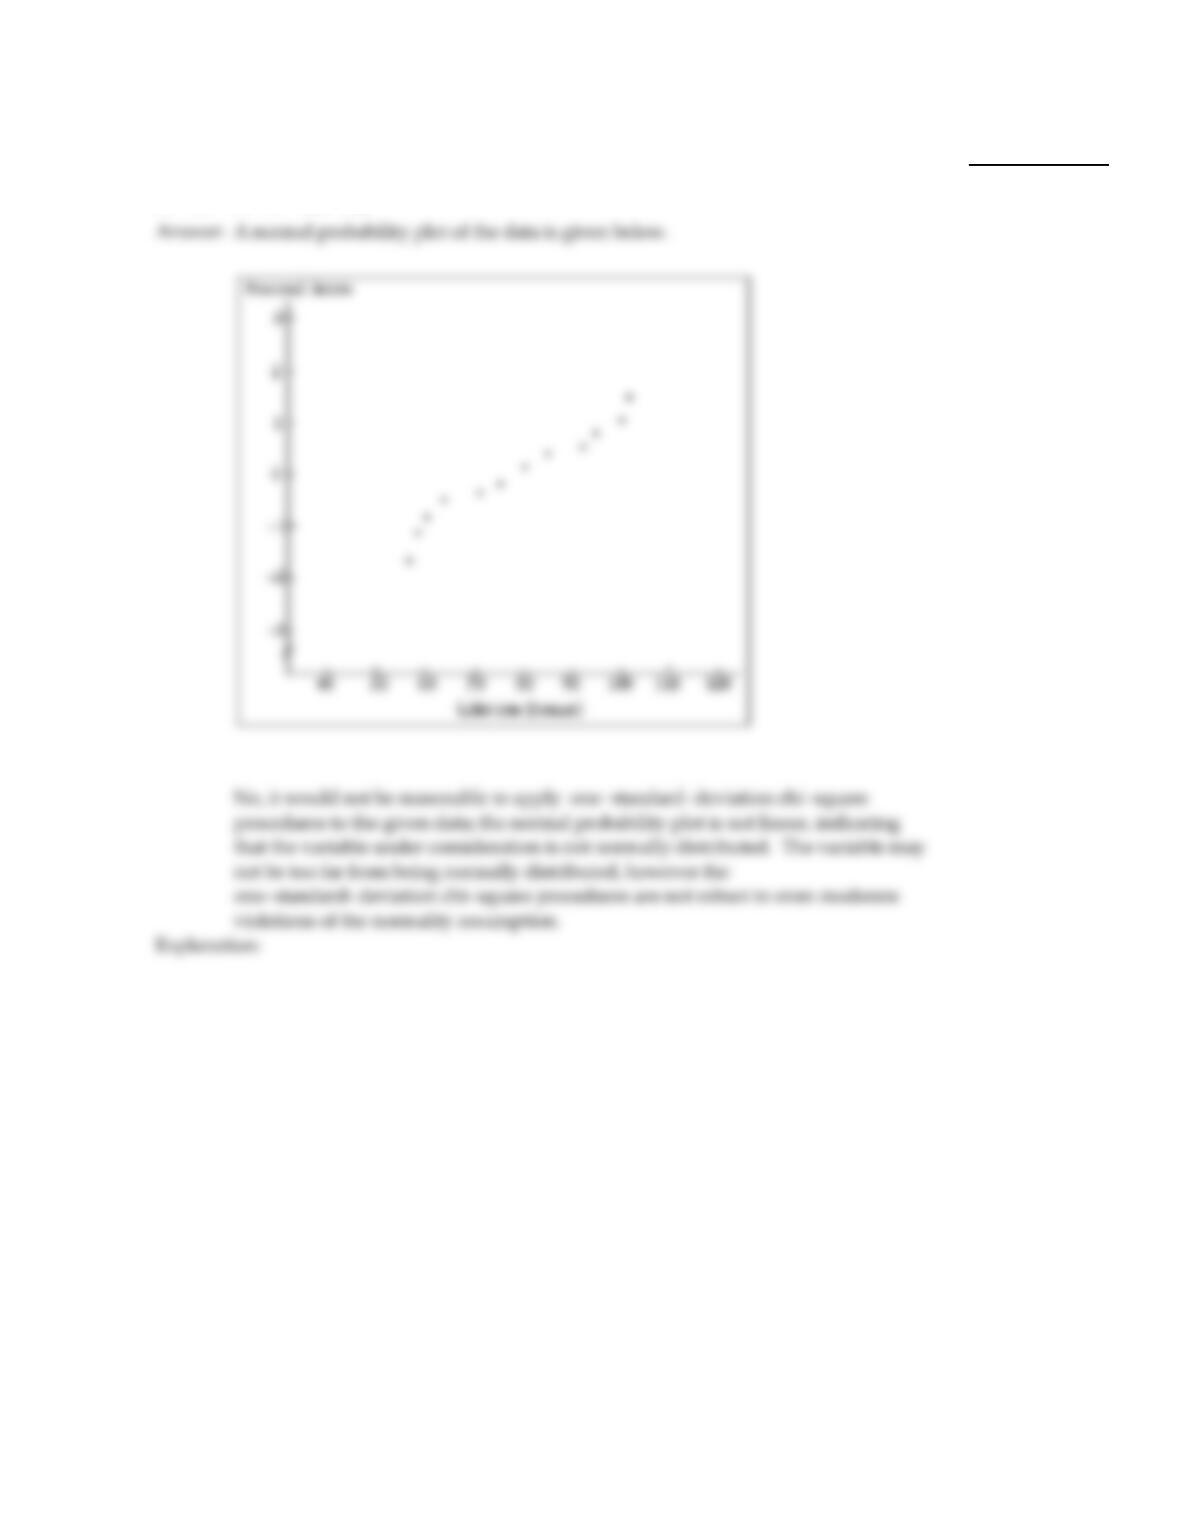
Decide whether applying one–standard–deviation chi–square procedures to the given data appears reasonable. Explain
your answer.
15)
Lifetimes (in hours) for a random sample of 12 batteries are as follows:
57 59 61 64 72 76
80 86 93 95 100 102
15)
7
Perform the required hypothesis test for two population standard deviations. Assume that independent samples have
been randomly selected from the two populations and that the variable under consideration is normally distributed on
both populations. Use the critical–value approach.
16)
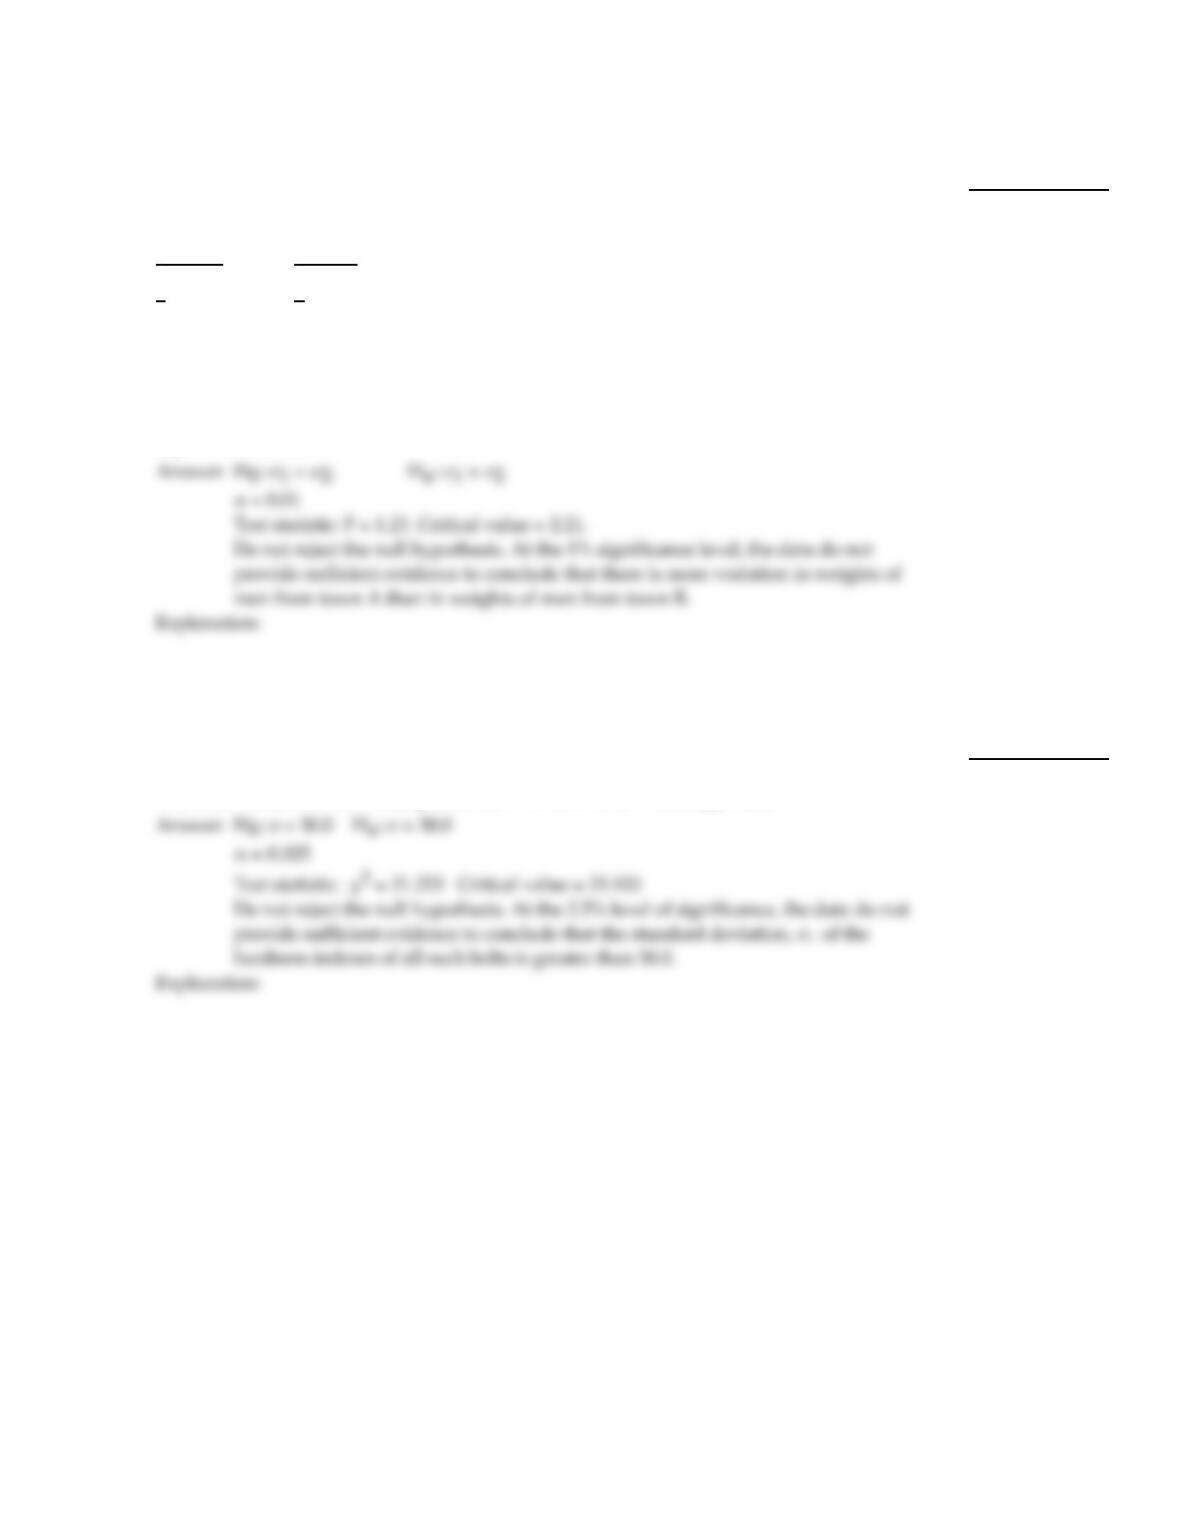
A researcher obtained independent random samples of men from two different towns. She
recorded the weights of the men. The results are summarized below:
Town A Town B
n1= 61 n2= 31
x1= 165.1 lb x2= 159.5 lb
s =34 lb s =30.6 lb
Do the data provide sufficient evidence to conclude that there is more variation in weights
of men from town A than in weights of men from town B? Perform an F–test at the 1%
significance level.
16)
Perform the required chi–square hypothesis test. Preliminary data analyses and other information indicate that it is
reasonable to assume that the variable under consideration is normally distributed. Use the critical–value approach or the
P–value approach as indicated.
17)
When 12 bolts are tested for hardness, their indexes have a standard deviation of 41.7. Test
the claim that the standard deviation of the hardness indexes for all such bolts is greater
than 30.0. Use a 0.025 level of significance. Use the critical–value approach.
17)
8
Provide an appropriate response.
18)
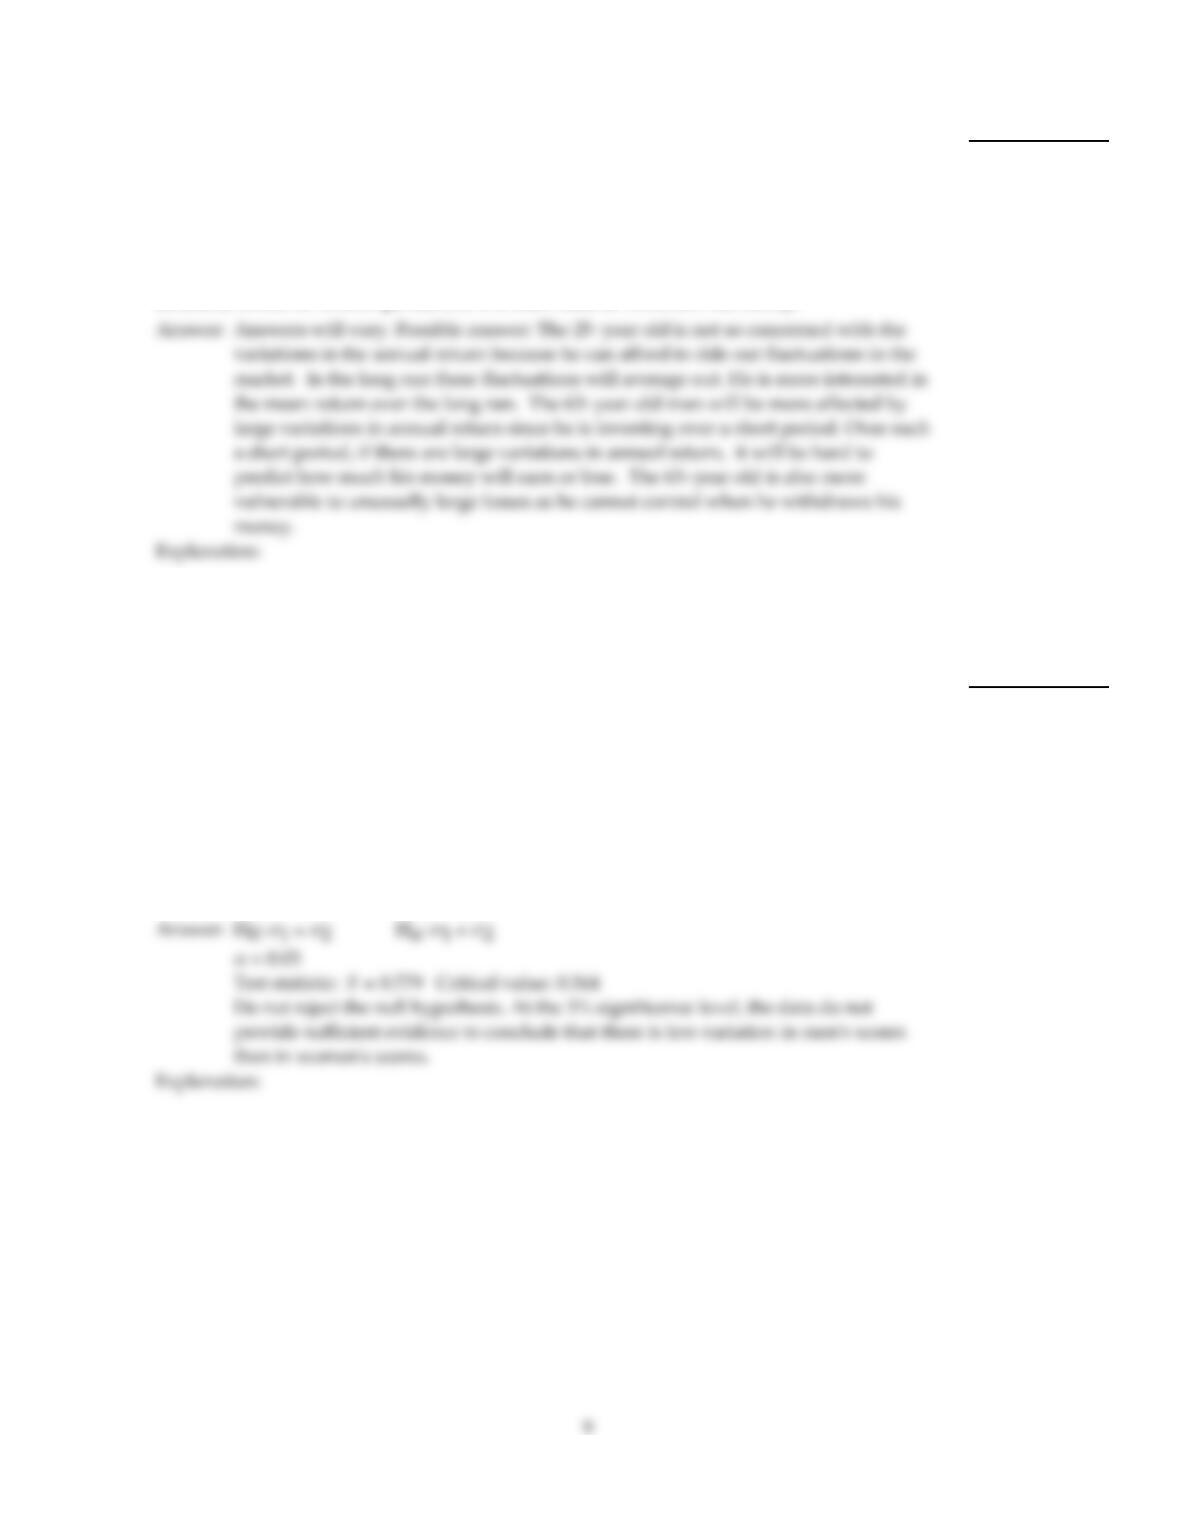
When you invest your money in a savings account, the standard deviation of the annual
return is small. When you invest your money in the stock market, the standard deviation
of your annual return can be high. In which of the situations below would knowledge of
the standard deviation be more important? Explain your thinking.
A: A 25–year old man will invest money in a mutual fund and plans to leave his money
there for a long period.
B: A 63–year old man nearing retirement will invest money in a mutual fund. He will only
be able to invest for a short period and will then need to withdraw his money.
18)
Perform the required hypothesis test for two population standard deviations. Assume that independent samples have
been randomly selected from the two populations and that the variable under consideration is normally distributed on
both populations. Use the critical–value approach.
19)
A researcher is interested in comparing the amount of variation in women’s scores on a
certain test with the amount of variation in men’s scores on the same test. Random samples
of 11 men and 13 women yielded the following scores:
Men: 72, 60, 52, 87, 66, 74, 95, 50, 81, 70, 72
Women: 70, 78, 62, 96, 75, 68, 41, 74, 80, 47, 73, 94, 65
Do the data provide sufficient evidence to conclude that there is less variation in men’s
scores than in women’s scores? Perform an F–test at the 5% significance level. (Note:
s1= 13.754 and s2= 15.588).
19)
Perform the required chi–square hypothesis test. Preliminary data analyses and other information indicate that it is
reasonable to assume that the variable under consideration is normally distributed. Use the critical–value approach or the
P–value approach as indicated.
20)
A manufacturer uses a new production method to produce steel rods. Under the old
production method, the standard deviation of the lengths of the rods was 3.5 cm. The
standard deviation of the lengths of a random sample of 17 steel rods produced under the
new method was 4.6 cm. At the 0.10 significance level, test whether the standard deviation
of the lengths of the new rods is different from 3.5 cm. Use the critical–value approach.
20)
Perform the required hypothesis test for two population standard deviations. Assume that independent samples have
been randomly selected from the two populations and that the variable under consideration is normally distributed on
both populations. Use the critical–value approach.
21)
Test scores for random samples of students from two different schools were recorded. The
summary statistics are given below.
School A School B
n = 31 n = 25
x1= 63.7 x2= 59.2
s =5.96 s =4.7
Do the data provide sufficient evidence to conclude that variation in test scores differs
between students from school A and students from school B? Use a significance level of
0.10.
21)
Perform the required chi–square hypothesis test. Preliminary data analyses and other information indicate that it is
reasonable to assume that the variable under consideration is normally distributed. Use the critical–value approach or the
P–value approach as indicated.
22)
In one town, monthly incomes for men with college degrees are found to have a standard
deviation of $650. A random sample of 22 men without college degrees resulted in
incomes with a standard deviation of $973. At the 1% level of significance, do the data
provide sufficient evidence to conclude that the standard deviation, , of incomes of men
in that town without college degrees is greater than $650? Use the critical–value approach.
22)
Decide whether applying one–standard–deviation chi–square procedures to the given data appears reasonable. Explain
your answer.
23)
Test scores for a random sample of 12 students were as follows:
24 42 52 55 60 65
67 71 72 75 77 79
23)
24)
The masses, in grams, of 19 plants of a certain type are given below.
5 6 7 7 8 9 15
18 18 26 28 31 32 33
42 42 43 45 46
24)
Perform the required chi–square hypothesis test. Preliminary data analyses and other information indicate that it is
reasonable to assume that the variable under consideration is normally distributed. Use the critical–value approach or the
P–value approach as indicated.
25)
A machine dispenses a liquid drug into bottles in such a way that the standard deviation of
the contents is 81 milliliters. A new machine is tested on a sample of 24 containers and the
standard deviation for this sample group is found to be 26 milliliters. At the 5% level of
significance, do the data provide sufficient evidence to conclude that the standard
deviation, , of the amounts dispensed by the new machine is less than 81 milliliters? Use
the critical–value approach.
25)
Decide whether applying one–standard–deviation chi–square procedures to the given data appears reasonable. Explain
your answer.
26)
Test scores for a random sample of 12 students were as follows:
22 30 34 37 40 45
49 53 58 65 74 87
26)
Perform the required chi–square hypothesis test. Preliminary data analyses and other information indicate that it is
reasonable to assume that the variable under consideration is normally distributed. Use the critical–value approach or the
P–value approach as indicated.
27)
With individual lines at the checkouts, a store manager finds that the standard deviation
for the waiting times on Monday mornings is 5.2 minutes. After switching to a single
waiting line, he finds that for a random sample of 29 customers, the waiting times have a
standard deviation of 4.2 minutes. Use a 0.025 significance level to test whether the
standard deviation of the waiting times using a single line is less than 5.2 minutes. Use the
critical–value approach.
27)

MULTIPLE CHOICE. Choose the one alternative that best completes the statement or answers the question.
Use the chi–square table to find the required 2–value(s).
28)
For a 2–curve with 6 degrees of freedom, find the 2–value having area 0.90 to its left.
28)
A)
2.204
B)
10.645
C)
16.812
D)
1.610
A sample standard deviation and sample size are given. Use the one–standard–deviation 2–interval procedure to obtain
the specified confidence interval.
29)
s =9, n =11 , 90% confidence interval
29)
A)
6.652 to 14.338
B)
7.118 to 12.903
C)
21.035 to 45.341
D)
2.217 to 4.779
Use the one–standard–deviation chi–square interval procedure to obtain the specified confidence interval for the
population standard deviation . Assume that the population has a normal distribution.
30)
The mean replacement time for a random sample of 20 washing machines is 10.5 years and the
standard deviation is 2.4 years. Construct a 99% confidence interval for the standard deviation, ,
of the replacement times of all washing machines of this type.
30)
A)
1.7 to 3.8 yr
B)
1.7 to 4.0 yr
C)
1.7 to 5.0 yr
D)
1.6 to 4.6 yr
Use the chi–square table to find the required 2–value(s).
31)
For a 2–curve with 9 degrees of freedom, find the 2–value having area 0.975 to its right.
31)
A)
2.180
B)
17.535
C)
2.700
D)
19.023
Provide an appropriate response.
32)
True or false? The area under a 2–curve to the left of 2
0.995 is 0.005.
32)
A)
True
B)
False
33)
A hypothesis test for two population standard deviations is to be performed. Independent random
samples of sizes n1 and n2 are drawn from the two populations. The variable under consideration
is normally distributed on each of the two populations. The test statistic is s2
1 / s2
2. If the null
hypothesis, H0: 1=2, is true, what is the distribution of this test statistic?
33)
A)
2–distribution with df =n1+n2– 1
B)
F–distribution with df = (n1– 1, n2– 1)
C)
F–distribution with df = (n1, n2)
D)
F–distribution with df = (n2– 1, n1– 1)
Use the chi–square table to find the required 2–value(s).
34)
For a 2–curve with 13 degrees of freedom, find the 2–value having area 0.025 to its left.
34)
A)
23.337
B)
24.736
C)
4.404
D)
5.009
Use the F–table and the reciprocal property of F–curves, if necessary, to find the required F–value(s).
35)
An F–curve has df = (12, 10). Find the F–value having area 0.05 to its right.
35)
A)
2.91
B)
0.34
C)
3.62
D)
2.75
36)
An F–curve has df = (24, 12). Determine the two F–values that divide the area under the curve into
a middle 0.98 area and two outside 0.01 areas.
36)
A)
0.330 and 3.03
B)
0.265 and 3.03
C)
0.330 and 3.78
D)
0.265 and 3.78
37)
An F–curve has df = (7, 15). Find the F–value having area 0.025 to its right.
37)
A)
4.57
B)
0.304
C)
3.29
D)
0.219
Provide an appropriate response.
38)
True or false? The F–value F0.01 has area 0.99 to its left.
38)
A)
True
B)
False
Use the F–table and the reciprocal property of F–curves, if necessary, to find the required F–value(s).
39)
An F–curve has df = (4, 15). Find the F–value having area 0.975 to its left.
39)
A)
0.115
B)
8.66
C)
0.263
D)
3.80
Use the chi–square table to find the required 2–value(s).
40)
For a 2–curve with 30 degrees of freedom, determine the two 2–values that divide the area
under the curve into a middle 0.99 area and two outside 0.005 areas.
40)
A)
14.256 and 49.588
B)
14.953 and 50.892
C)
13.787 and 53.672
D)
13.121 and 52.336
Provide an appropriate response.
41)
True or false? F0.99 for an F–curve with df = (25, 26) is equal to 1/F0.01 for an F–curve with
df = (26, 25).
41)
A)
True
B)
False
Use the F–table and the reciprocal property of F–curves, if necessary, to find the required F–value(s).
42)
An F–curve has df = (24, 20). Find F0.10 .
42)
A)
0.578
B)
1.77
C)
2.86
D)
1.73
Provide an appropriate response.
43)
True or false? An F–curve is right–skewed if the numerator degrees of freedom are larger than the
denominator degrees of freedom and left–skewed if the denominator degrees of freedom are larger
than the numerator degrees of freedom.
43)
A)
True
B)
False
44)
True or false? A 2–curve is symmetrical about the y–axis.
44)
A)
True
B)
False
Use the F–table and the reciprocal property of F–curves, if necessary, to find the required F–value(s).
45)
An F–curve has df = (9, 12). Find the F–value having area 0.005 to its left.
45)
A)
6.23
B)
5.20
C)
0.192
D)
0.161
The sample standard deviations and sample sizes are given for independent simple random samples from two
populations. Use the two–standard–deviations F–interval procedure to obtain the specified confidence interval. Round to
the nearest hundredth.
46)
s1=12.08, n1= 25, s2=11.05, n2= 21; 80% confidence interval
46)
A)
0.69 to 0.82
B)
0.82 to 1.44
C)
0.69 to 1.44
D)
0.91 to 1.09
Use the F–table and the reciprocal property of F–curves, if necessary, to find the required F–value(s).
47)
An F–curve has df = (9, 10). Determine the two F–values that divide the area under the curve into a
middle 0.99 area and two outside 0.005 areas.
47)
A)
0.168 and 5.97
B)
0.168 and 6.42
C)
0.156 and 5.97
D)
0.156 and 6.42
Use the chi–square table to find the required 2–value(s).
48)
For a 2–curve with 19 degrees of freedom, find the 2–value having area 0.005 to its left.
48)
A)
30.144
B)
10.117
C)
38.582
D)
6.844
Use the one–standard–deviation chi–square interval procedure to obtain the specified confidence interval for the
population standard deviation . Assume that the population has a normal distribution.
49)
A football coach randomly selected ten players from his college and timed how long each player
took to perform a certain drill. The times (in minutes) were:
13 7 15 7 10
6 13 7 10 7
Find a 95% confidence interval for the standard deviation, , of the times of all football players at
this college.
49)
A)
2.2 to 5.3 min
B)
0.7 to 2.2 min
C)
2.2 to 5.9 min
D)
2.1 to 5.3 min
Use the chi–square table to find the required 2–value(s).
50)
For a 2–curve with df = 8, determine 2
0.99 .
50)
A)
3.490
B)
20.090
C)
13.362
D)
1.646
51)
For a 2–curve with 17 degrees of freedom, find the 2–value having area 0.05 to its right.
51)
A)
26.296
B)
5.697
C)
35.718
D)
27.587

52)
For a 2–curve with 4 degrees of freedom, determine the two 2–values that divide the area under
the curve into a middle 0.98 area and two outside 0.01 areas.
52)
A)
1.064 and 7.779
B)
0.115 and 11.345
C)
0.484 and 11.143
D)
0.297 and 13.277
Answer:
D
Explanation:
A)
B)
C)
D)
The sample standard deviations and sample sizes are given for independent simple random samples from two
populations. Use the two–standard–deviations F–test to conduct the required hypothesis test.
53)
s1= 0.0782, n1= 9, s2=0.1912, n2= 10; left–tailed test, = 0.05
53)
A)
Test statistic: F =0.167 Critical value: 0.310. Reject H0.
B)
Test statistic: F =0.167 Critical value: 0.318. Do not reject H0.
C)
Test statistic: F =0.167 Critical value: 0.295. Do not reject H0.
D)
Test statistic: F =0.167 Critical value: 0.295. Reject H0.
The sample standard deviations and sample sizes are given for independent simple random samples from two
populations. Use the two–standard–deviations F–interval procedure to obtain the specified confidence interval. Round to
the nearest hundredth.
54)
s1=38.4, n1= 6, s2=84.1, n2= 16; 90% confidence interval
54)
A)
0.27 to 0.98
B)
0.27 to 4.71
C)
0.46 to 2.19
D)
0.27 to 1.29
Answer:
A
Explanation:
A)
B)
C)
D)
Provide an appropriate response.
55)
True or false? For an F–curve with df = (17, 19), F0.99 is equal to 1/F0.01 .
55)
A)
True
B)
False
Answer:
B
Explanation:
A)
B)
Answer:
D
Explanation:
A)
B)
C)
D)

Use the chi–square table to find the required 2–value(s).
56)
For a 2–curve with df = 17, determine 2
0.10 .
56)
A)
24.769
B)
33.409
C)
23.542
D)
10.085
Use the F–table and the reciprocal property of F–curves, if necessary, to find the required F–value(s).
57)
An F–curve has df = (60, 10). Find the F–value having area 0.025 to its left.
57)
A)
3.20
B)
2.27
C)
0.441
D)
0.313
A sample standard deviation and sample size are given. Use the one–standard–deviation 2–test to conduct the required
hypothesis test.
58)
s =12.1, n = 22
H0: =16.1, Ha: <16.1, = 0.01
58)
A)
Test statistic: X2=11.861. Critical value = 38.932. Reject H0.
B)
Test statistic: X2=11.861. Critical value = 8.897. Do not reject H0.
C)
Test statistic: X2=11.861. Critical value = 38.932. Do not reject H0.
D)
Test statistic: X2=11.861. Critical value = 8.897. Reject H0.
Use the F–table and the reciprocal property of F–curves, if necessary, to find the required F–value(s).
59)
An F–curve has df = (6, 24). Find the F–value having area 0.01 to its left.
59)
A)
0.137
B)
3.67
C)
0.272
D)
7.31