Exam
Name___________________________________
MULTIPLE CHOICE. Choose the one alternative that best completes the statement or answers the question.
Provide an appropriate response.
1)
Which of the following is not an assumption for performing a chi–square homogeneity test?
1)
A)
At most 20% of the expected frequencies are greater than 5.
B)
Samples are independent.
C)
All expected frequencies are 1 or greater.
D)
Samples are random.
SHORT ANSWER. Write the word or phrase that best completes each statement or answers the question.
Perform a chi–square independence test using the critical value approach, provided the conditions for using the test are
met. Be sure to state the hypotheses and the significance level, to obtain the expected frequencies, to obtain the critical
value, to compute the value of the test statistic, and to state your conclusion.
2)
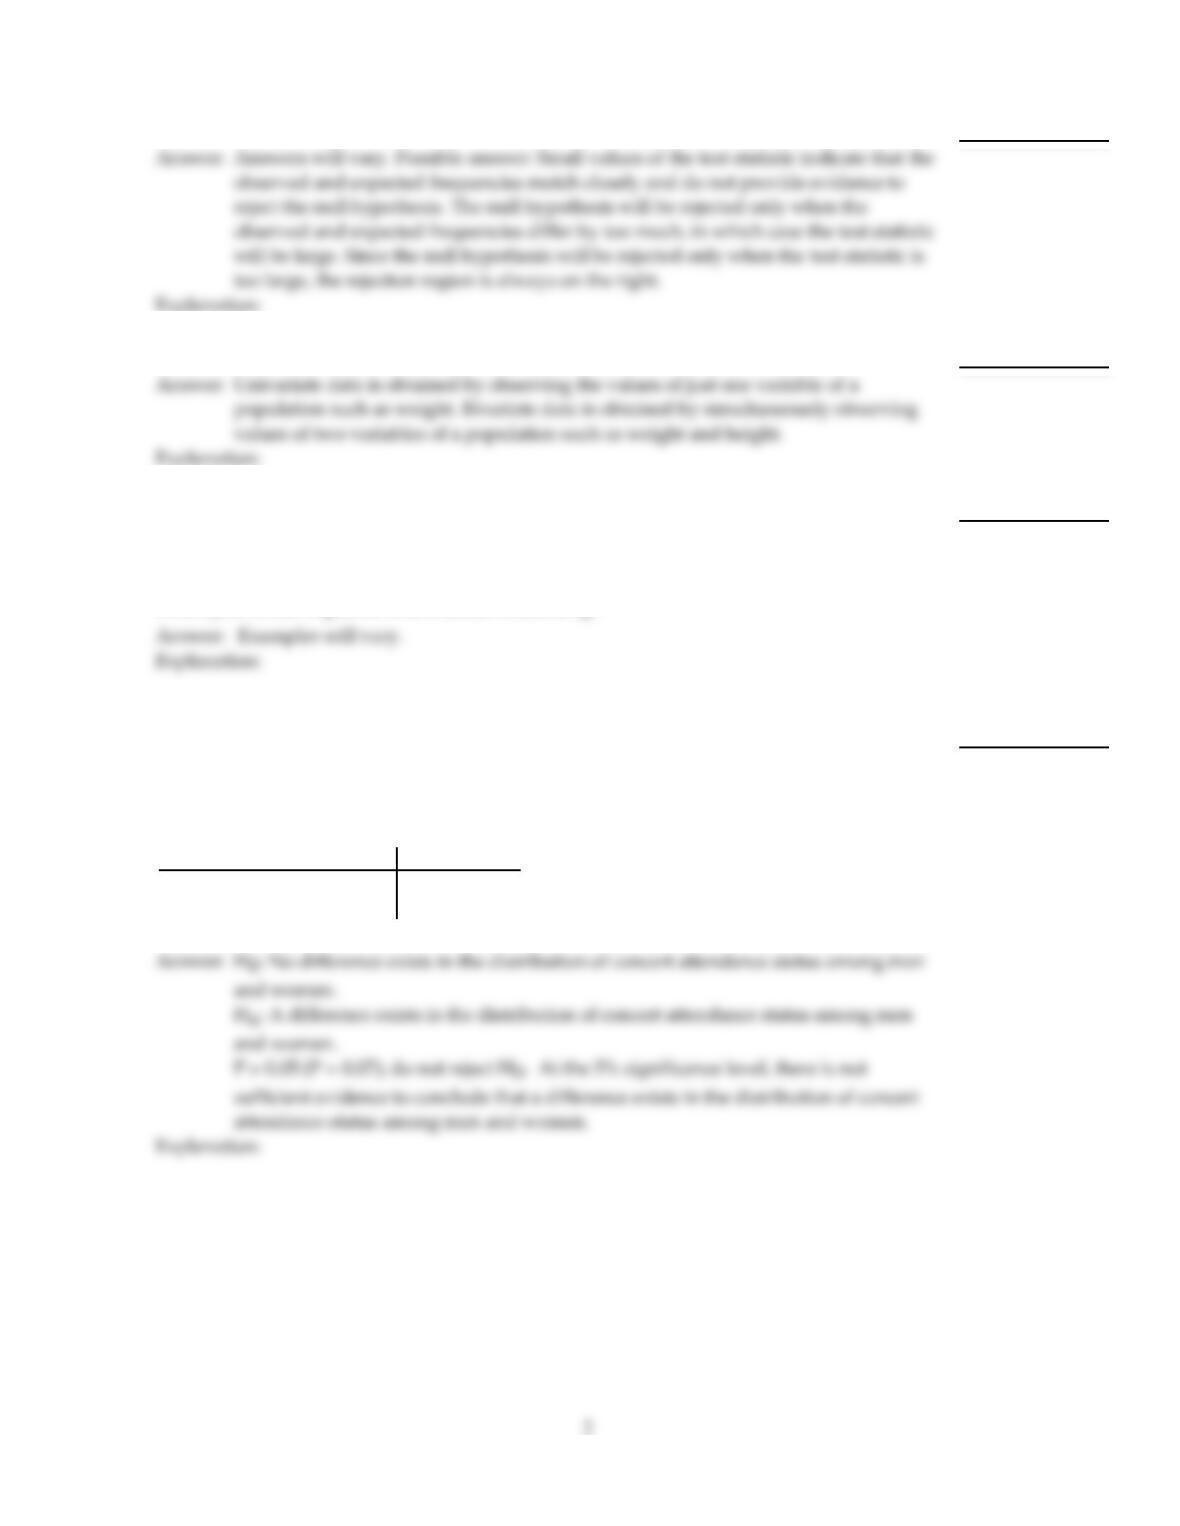
A car insurance company performed a study to determine whether an association exists
between age and the frequency of car accidents. They obtained the following sample data.
At the 1% significance level, do the data provide sufficient evidence to conclude that an
association exists between age and frequency of car accidents?
2)
Provide an appropriate response.
3)
Explain why a chi–square goodness–of–fit test is always right–tailed.
3)
4)
Explain the difference between univariate and bivariate data.
4)
5)
You have been using the chi–square test of independence to test for association between
two variables. Give an example of a pair of variables for which you would expect to find
no association. Give an example of a pair of variables for which you would expect to find
association, but not a causal relationship. Finally, give an example of a pair of variables for
which you would expect to find a causal relationship.
5)
Perform a chi–square homogeneity test, provided the conditions for the test are met. Use the P–value approach.
6)
An independent simple random sample of 400 men and 400 women was asked whether
they planned to attend a concert in the next month. The results are listed below, showing
the concert attendance status by gender. At the 5% significance level, test the claim that a
difference exists in the distribution of concert attendance status among men and women.
Men Women
Plan to attend concert 230 255
Don’t plan to attend concert 170 145
6)

Perform a chi–square homogeneity test, provided the conditions for the test are met. Use the critical–value approach.
7)
At a high school debate tournament, half of the teams were asked to wear suits and ties
and the rest were asked to wear jeans and t–shirts. The results of independent simple
random samples are given in the table below. Test the hypothesis at the 5% significance
level that the differently dressed debate teams are nonhomogeneous with respect to
tournament wins/losses.
Win Loss
Suit 22 28
T–shirt 28 22
7)
Provide an appropriate response.
8)
What is the null hypothesis for the chi–square test of independence? What assumptions are
required for this test?
8)
9)
Suppose that you have a contingency table showing political party affiliation cross
classified by age group for a certain population. Explain how you can determine whether
there is an association between age group and political party affiliation.
9)
Perform the indicated goodness–of–fit test. Be sure to state the hypotheses and the significance level, to obtain the critical
value, to compute the value of the test statistic, and to state your conclusion.
10)
In 1990, workplace accidents were distributed on workdays as follows.
Day Mon Tues Wed Thur Fri
Percentage 25 15 15 15 30
In 1995, a random sample of 100 workplace accidents yielded the following data.
Day Mon Tues Wed Thur Fri
Percentage 23 16 13 13 35
Do the data provide sufficient evidence to conclude that the distribution of workplace
accidents in 1995 differs from the 1990 distribution? Perform the hypothesis test at the 0.01
level of significance.
10)
Perform a chi–square independence test using the critical value approach, provided the conditions for using the test are
met. Be sure to state the hypotheses and the significance level, to obtain the expected frequencies, to obtain the critical
value, to compute the value of the test statistic, and to state your conclusion.
11)
Tests for adverse reactions to a new drug yielded the results given in the table. At the 0.05
significance level, do the data provide sufficient evidence to conclude that an association
exists between the treatment (drug or placebo) and the reaction (whether or not headaches
were experienced)?
Drug Placebo
Headaches 11 7
No headaches 73 91
11)
Perform a chi–square homogeneity test, provided the conditions for the test are met. Use the critical–value approach.
12)
300 men and 300 women were selected and asked whether they planned to vote in the
next election. The results of independent simple random samples are given in the table
below, showing the voting intentions by gender. Use a 1% significance level to test the
claim that there is a difference in the distribution of voting intentions for men and women.
Men Women
Plan to vote 170 185
Do not plan to vote 130 115
12)
Perform a chi–square independence test using the P–value approach, provided the conditions for using the test are met.
Be sure to state the hypotheses and the significance level, to obtain the expected frequencies, to compute the value of the
test statistic, to obtain the P–value, and to state your conclusion.
13)
A car insurance company performed a study to determine whether an association exists
between age and the frequency of car accidents. They obtained the following sample data.
At the 5% significance level, do the data provide sufficient evidence to conclude that an
association exists between age and frequency of car accidents?
13)
Provide an appropriate response.
14)
Suppose that you wish to perform a chi–square test of independence. Give an example of
sample data for which assumption 1 (all expected frequencies are 1 or greater) is violated.
You should present the sample data in the form of a contingency table.
14)

15)
When performing a chi–square goodness–of–fit test, why do large values of the test
statistic suggest that the variable does not have the distribution stated in the null
hypothesis? Refer to the formula for the test statistic in your explanation.
15)
16)
Suppose that you wish to perform a chi–square test of independence. The two variables
under consideration are sex and blood type. True or false, if the two variables are not
associated, we would expect that in the sample, the number of women with a given blood
type would be roughly equal to the number of men with the same blood type?
If the statement is false, rewrite it so that it is true.
16)
Perform the indicated goodness–of–fit test using the P–value method. Be sure to state the hypotheses and the significance
level , to compute the value of the test statistic, to obtain the P–value, and to state your conclusion.
17)
A die is rolled 180 times and the following data are obtained.
Number Frequency
1 31
2 34
3 26
4 16
5 32
6 41
Do the data provide sufficient evidence to conclude that the die is loaded (i.e., that the six
numbers are not equally likely)? Perform the hypothesis test at the 1% level of significance.
17)
6
Provide an appropriate response.
18)
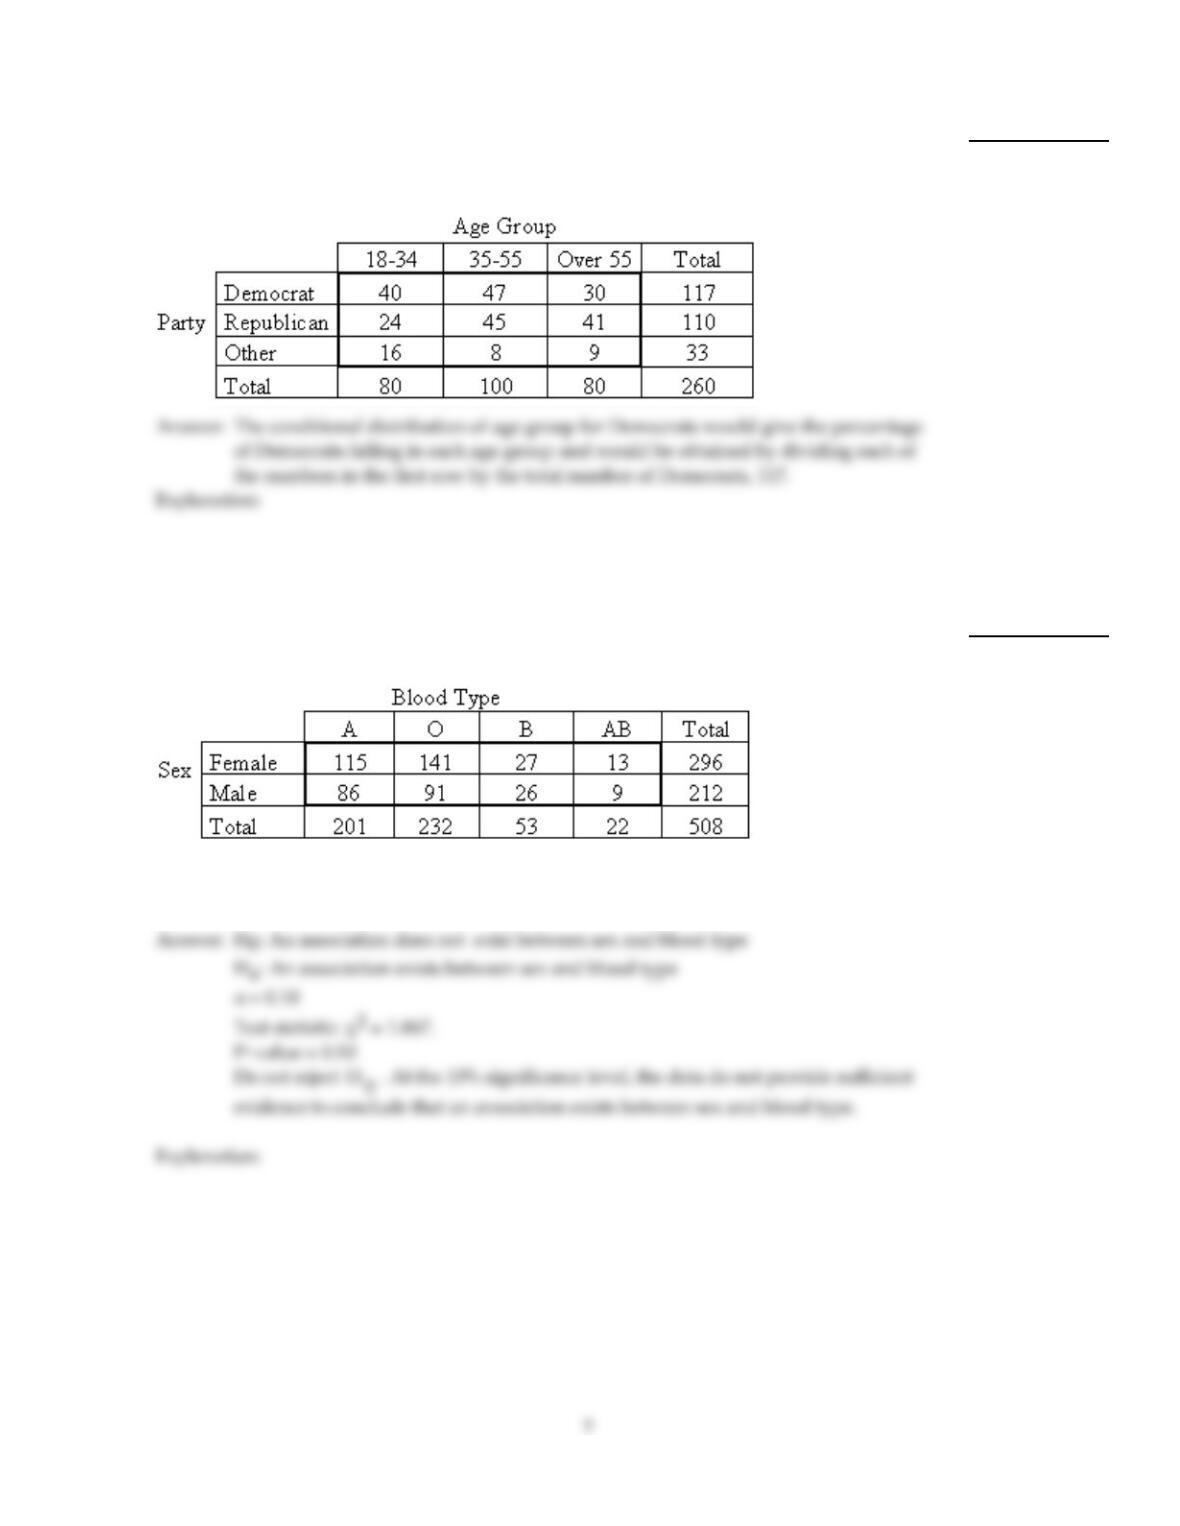
The contingency table below shows political party affiliation cross classified by age group
for a certain population. What information would be given by the conditional distribution
of age group for Democrats? How would you obtain this conditional distribution?
18)
Perform a chi–square independence test using the P–value approach, provided the conditions for using the test are met.
Be sure to state the hypotheses and the significance level, to obtain the expected frequencies, to compute the value of the
test statistic, to obtain the P–value, and to state your conclusion.
19)
A researcher performed a study to determine whether an association exists between sex
and blood type. He obtained the following sample data.
At the 10% significance level, do the data provide sufficient evidence to conclude that an
association exists between sex and blood type?
19)

Perform the indicated goodness–of–fit test. Be sure to state the hypotheses and the significance level, to obtain the critical
value, to compute the value of the test statistic, and to state your conclusion.
20)
The U.S. Department of Defense provides data on the distribution of military personnel on
active duty by branch of service. Below is a table giving the percentage distribution for
1985.
Branch of Service Percentage
Army 36.3
Navy 26.5
Marine Corps 9.2
Air Force 28.0
A random sample of 325 military personnel currently on active duty gave the following
statistics.
Branch of Service Frequency
Army 114
Navy 92
Marine Corps 32
Air Force 87
At the 5% significance level, do the data provide evidence that the current distribution of
military personnel on active duty differs from the 1985 distribution?
20)
Provide an appropriate response.
21)
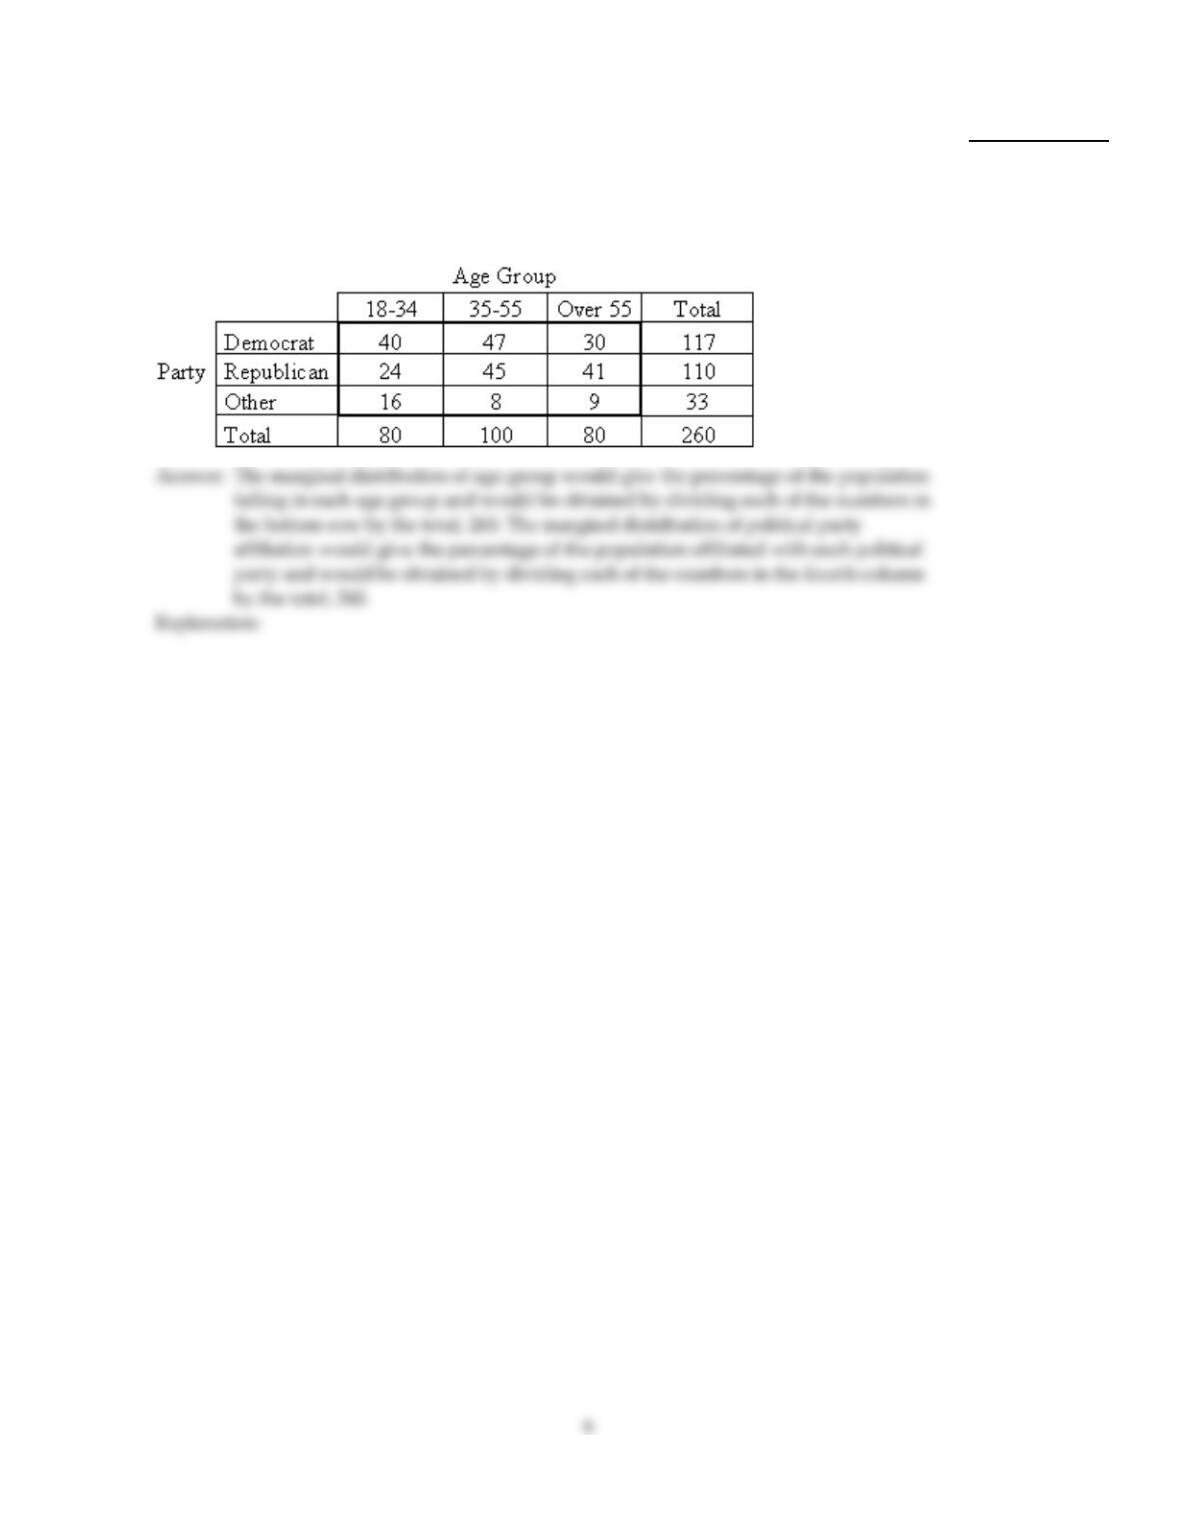
The contingency table below shows political party affiliation cross classified by age group
for a certain population. What information would be given by the marginal distribution of
age group? How would you obtain this marginal distribution? What information would be
given by the marginal distribution of political party affiliation? How would you obtain this
marginal distribution?
21)

Perform the indicated goodness–of–fit test. Be sure to state the hypotheses and the significance level, to obtain the critical
value, to compute the value of the test statistic, and to state your conclusion.
22)
A study conducted for New Woman magazine indicates that the number of children
desired by newly–married American couples is distributed as follows.
Number of children desired Percent
0 9%
1 17%
2 55%
3 11%
Over 3 8%
A random sample of 600 couples in California resulted in the following data.
Number of children desired Frequency
068
1121
2330
362
Over 3 19
At the 1% significance level, does it appear that the “number of children desired”
distribution of California couples is different from that of the American population as a
whole?
22)

Perform a chi–square homogeneity test, provided the conditions for the test are met. Use the critical–value approach.
23)
A researcher wishes to test whether the proportion of college students who smoke is the
same in four different colleges. She uses independent simple random samples to select 100
students from each college and records the number that smoke. The results are shown
below, showing smoking status and college.
College A College B College C College D
Smoke 17 26 11 34
Don’t smoke 83 74 89 66
Use a 1% significance level to test the claim that the distribution of smoking status is
different at the four colleges.
23)
Perform a chi–square independence test using the critical value approach, provided the conditions for using the test are
met. Be sure to state the hypotheses and the significance level, to obtain the expected frequencies, to obtain the critical
value, to compute the value of the test statistic, and to state your conclusion.
24)
The table below shows the age and favorite type of music of 668 randomly selected people.
Rock Jazz Classical
15–25 50 85 73
25–35 68 91 60
35–45 90 74 77
At the 0.05 significance level, do the data provide sufficient evidence to conclude that an
association exists between age and preferred music type?
24)

Solve the problem.
25)
The table below shows a distribution and the observed frequencies of the values of a
variable from a simple random sample of a population. Perform a chi–square
goodness–of–fit test, at the specified significance level, to decide whether the distribution
of the variable differs from the given distribution.
Distribution: 0.15 0.20 0.25 0.25 0.15
Observed frequencies: 12 15 16 18 19
Significance level = 0.10
25)
Provide an appropriate response.
26)
In the chi–square test of independence, the test statistic used is 2=(O – E)2
E. Discuss the
meaning of O and E and explain the circumstances under which the 2values will be
smaller or larger. What is the relationship between a significant 2value and the values of
O and E?
26)
27)
What is a chi–square goodness–of–fit test used for? For what kinds of variable can it be
used?
27)
28)
When performing a chi–square goodness–of–fit test, how are the expected frequencies
obtained?
28)
Perform a chi–square homogeneity test, provided the conditions for the test are met. Use the critical–value approach.
29)
A researcher wishes to test the effectiveness of a flu vaccination. 150 people are vaccinated,
180 people are vaccinated with a placebo, and 100 people are not vaccinated. Independent
simple random samples were used and the number in each group who later caught the flu
was recorded. The results are given in the table below, showing the test group and flu
status.
Vaccinated Placebo Control
Caught the flu 819 21
Did not catch the flu 142 161 79
Use a 5% significance level to test the claim that there is a difference in the distribution of
flu status for the three test groups.
29)
Provide an appropriate response.
30)
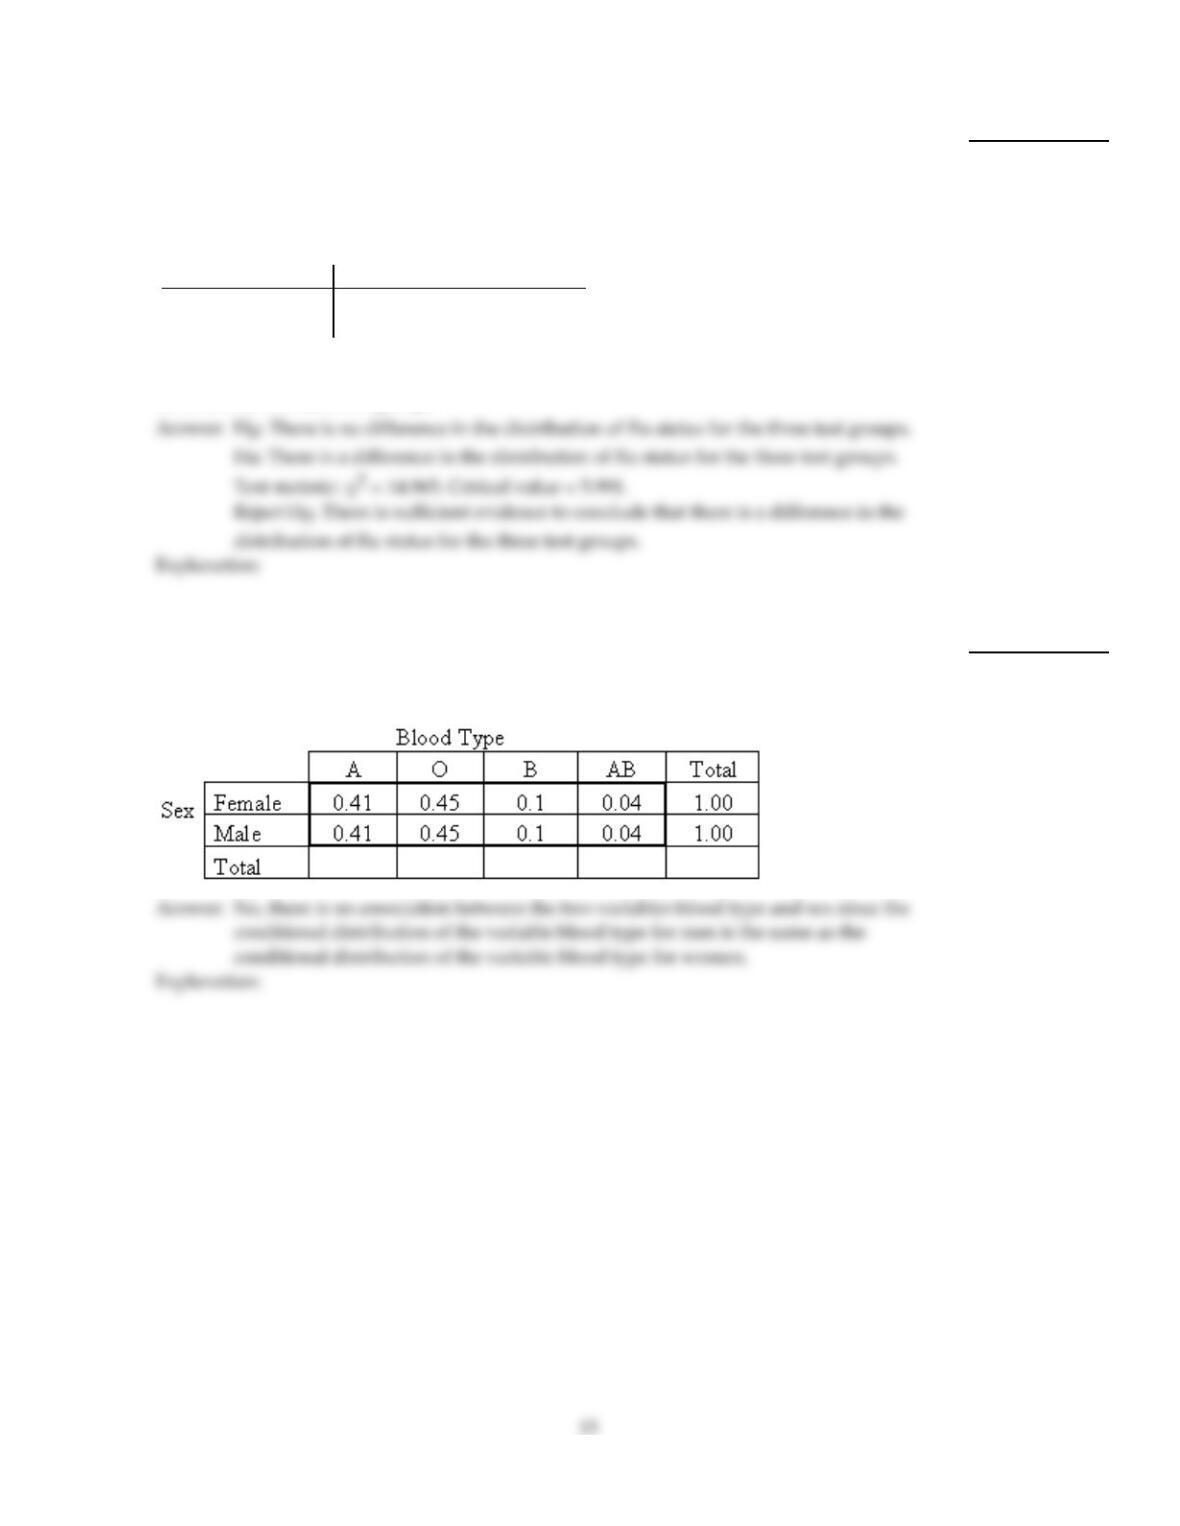
The table below shows the conditional distributions of the variable blood type for men and
for women for a certain population. Is there association between the two variables blood
type and sex? How can you tell?
30)

Perform a chi–square independence test using the critical value approach, provided the conditions for using the test are
met. Be sure to state the hypotheses and the significance level, to obtain the expected frequencies, to obtain the critical
value, to compute the value of the test statistic, and to state your conclusion.
31)
160 students who were majoring in either math or English were asked a test question, and
the researcher recorded whether they answered the question correctly. The sample results
are given below. At the 0.10 significance level, do the data provide sufficient evidence to
conclude that an association exists between response and major?
Correct Incorrect
Math 27 53
English 43 37
31)
Provide an appropriate response.
32)
Suppose that you wish to perform a chi–square test of independence. Give an example of
sample data for which assumption 2 (at most 20% of the expected frequencies are less than
5) is violated. You should present the sample data in the form of a contingency table.
32)
Perform a chi–square independence test using the critical value approach, provided the conditions for using the test are
met. Be sure to state the hypotheses and the significance level, to obtain the expected frequencies, to obtain the critical
value, to compute the value of the test statistic, and to state your conclusion.
33)
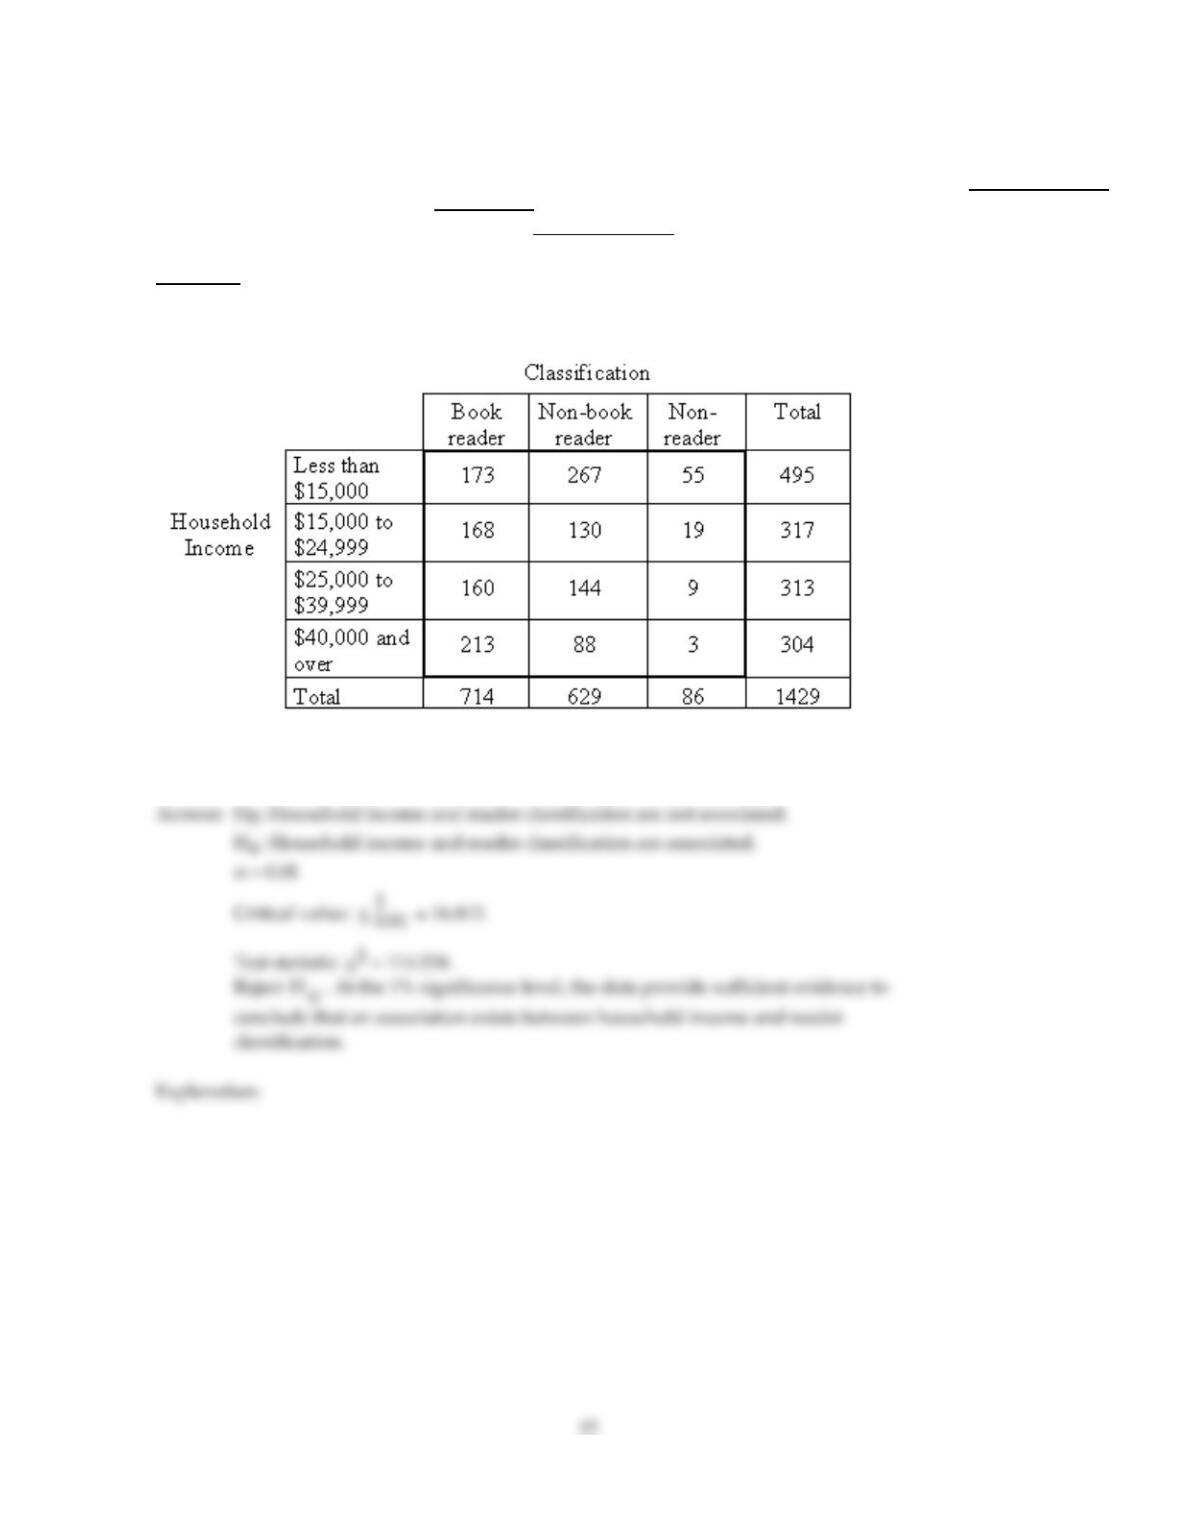
The Book Industry Study Group, Inc., performs sample surveys to obtain information on
characteristics of book readers. A book reader is defined to be one who read one or more
books in the six months prior to the survey; a non–book reader is defined to be one who
read newspapers or magazines but no books in the six months prior to the survey; a
nonreader is defined to be one who did not read a book, newspaper, or magazine in the six
months prior to the survey. The following data were obtained from a random sample of
1429 persons 16 years old and over.
At the 1% significance level, do the data provide sufficient evidence to conclude that an
association exists between “household income” and “reader classification”?
33)

Perform the indicated goodness–of–fit test using the P–value method. Be sure to state the hypotheses and the significance
level , to compute the value of the test statistic, to obtain the P–value, and to state your conclusion.
34)
A study conducted for New Woman magazine indicates that the number of children
desired by newly–married American couples is distributed as follows.
Number of children desired Percent
0 9%
1 17%
2 55%
3 11%
Over 3 8%
A random sample of 600 couples in California resulted in the following data.
Number of children desired Frequency
0 55
1 118
2 340
3 60
Over 3 27
At the 1% significance level, does it appear that the “number of children desired”
distribution of California couples is different from that of the American population as a
whole?
34)
Provide an appropriate response.
35)
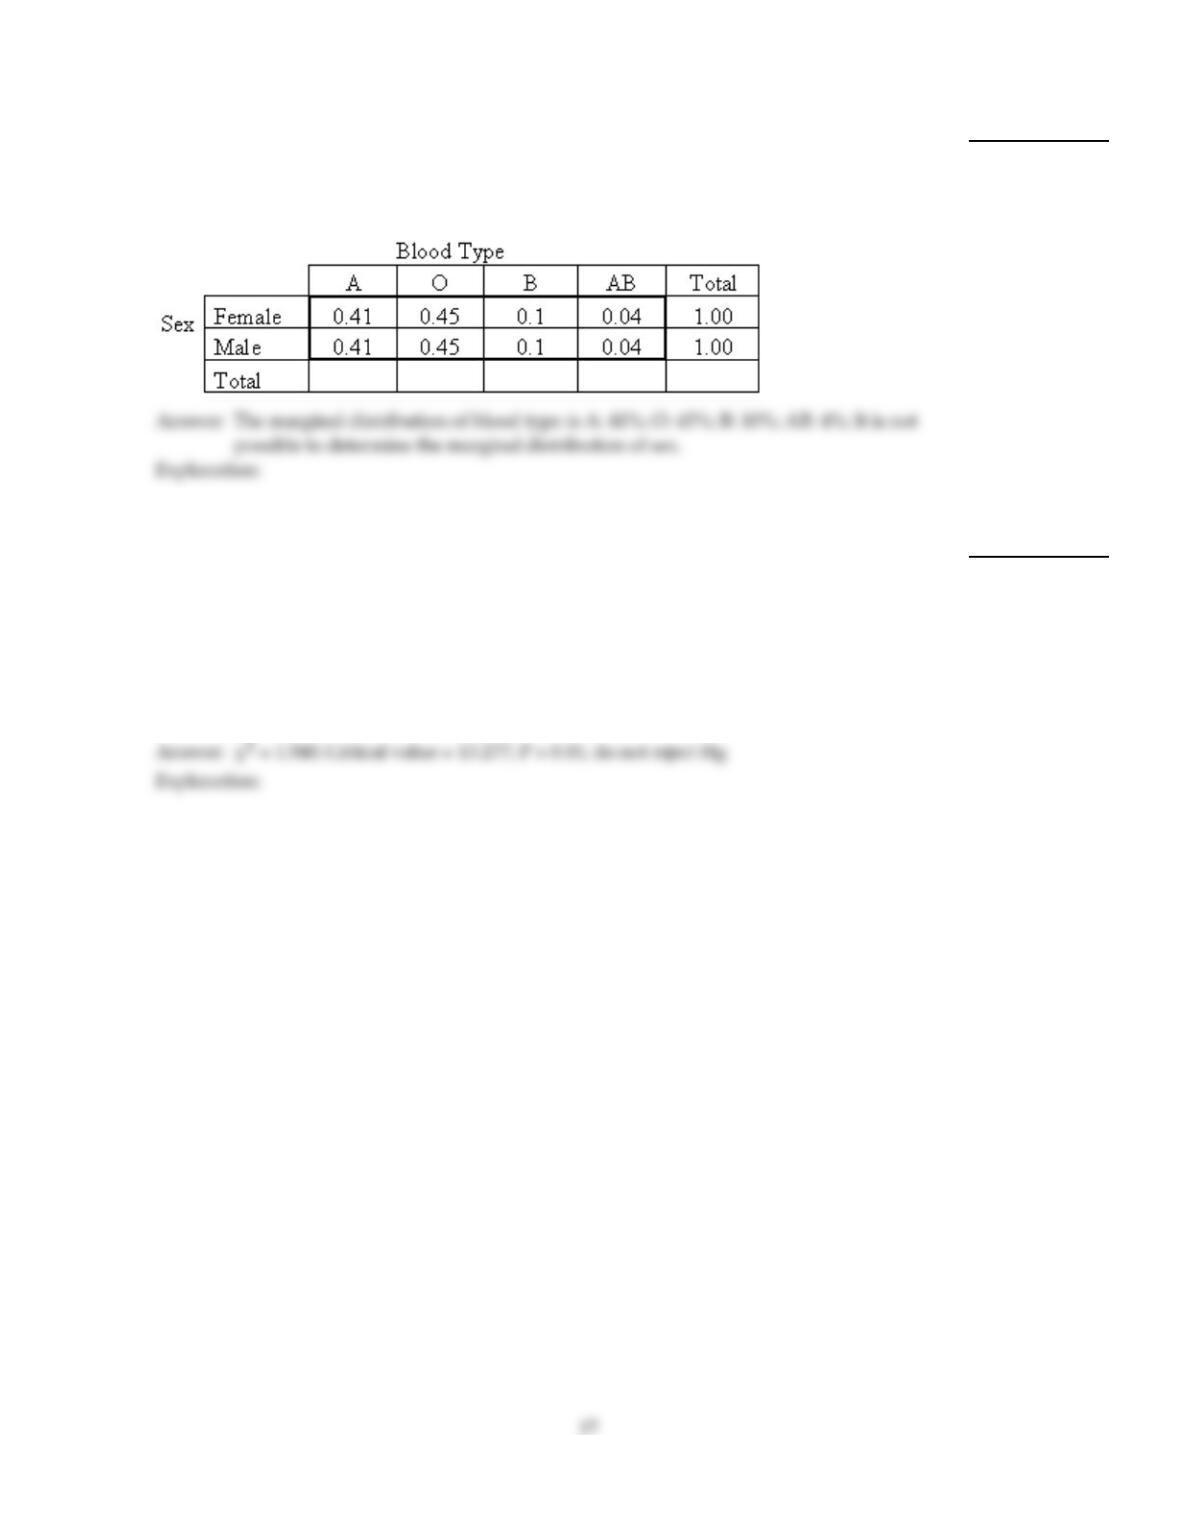
The table below shows the conditional distributions of the variable blood type for men and
for women for a certain population. Is it possible to determine the marginal distribution of
blood type? If so, what is it? Is it possible to determine the marginal distribution of sex? If
so, what is it?
35)
Solve the problem.
36)
The table below shows a distribution and the observed frequencies of the values of a
variable from a simple random sample of a population. Perform a chi–square
goodness–of–fit test, at the specified significance level, to decide whether the distribution
of the variable differs from the given distribution.
Distribution: 0.25 0.15 0.15 0.15 0.3
Observed frequencies: 26 13 18 12 31
Significance level = 0.01
36)

Perform the indicated goodness–of–fit test. Be sure to state the hypotheses and the significance level, to obtain the critical
value, to compute the value of the test statistic, and to state your conclusion.
37)
A firm that manufactures engines for racing boats gathers data from all of its plants. The
table below gives the distribution of the life span of the engines (in numbers of months) for
the entire firm.
Months Relative Frequency
Under 60 0.017
70–79 0.201
80–89 0.353
90–99 0.331
100–109 0.098
A random sample of 448 engines from the firm’s Ohio plant gives the following results.
Months Number of engines
Under 60 22
70–79 131
80–89 46
90–99 154
100–109 95
At the 5% significance level, do the data provide evidence that the distribution of the life
spans of the engines manufactured at the Ohio plant is different from the firm’s overall
distribution?
37)
Provide an appropriate response.
38)
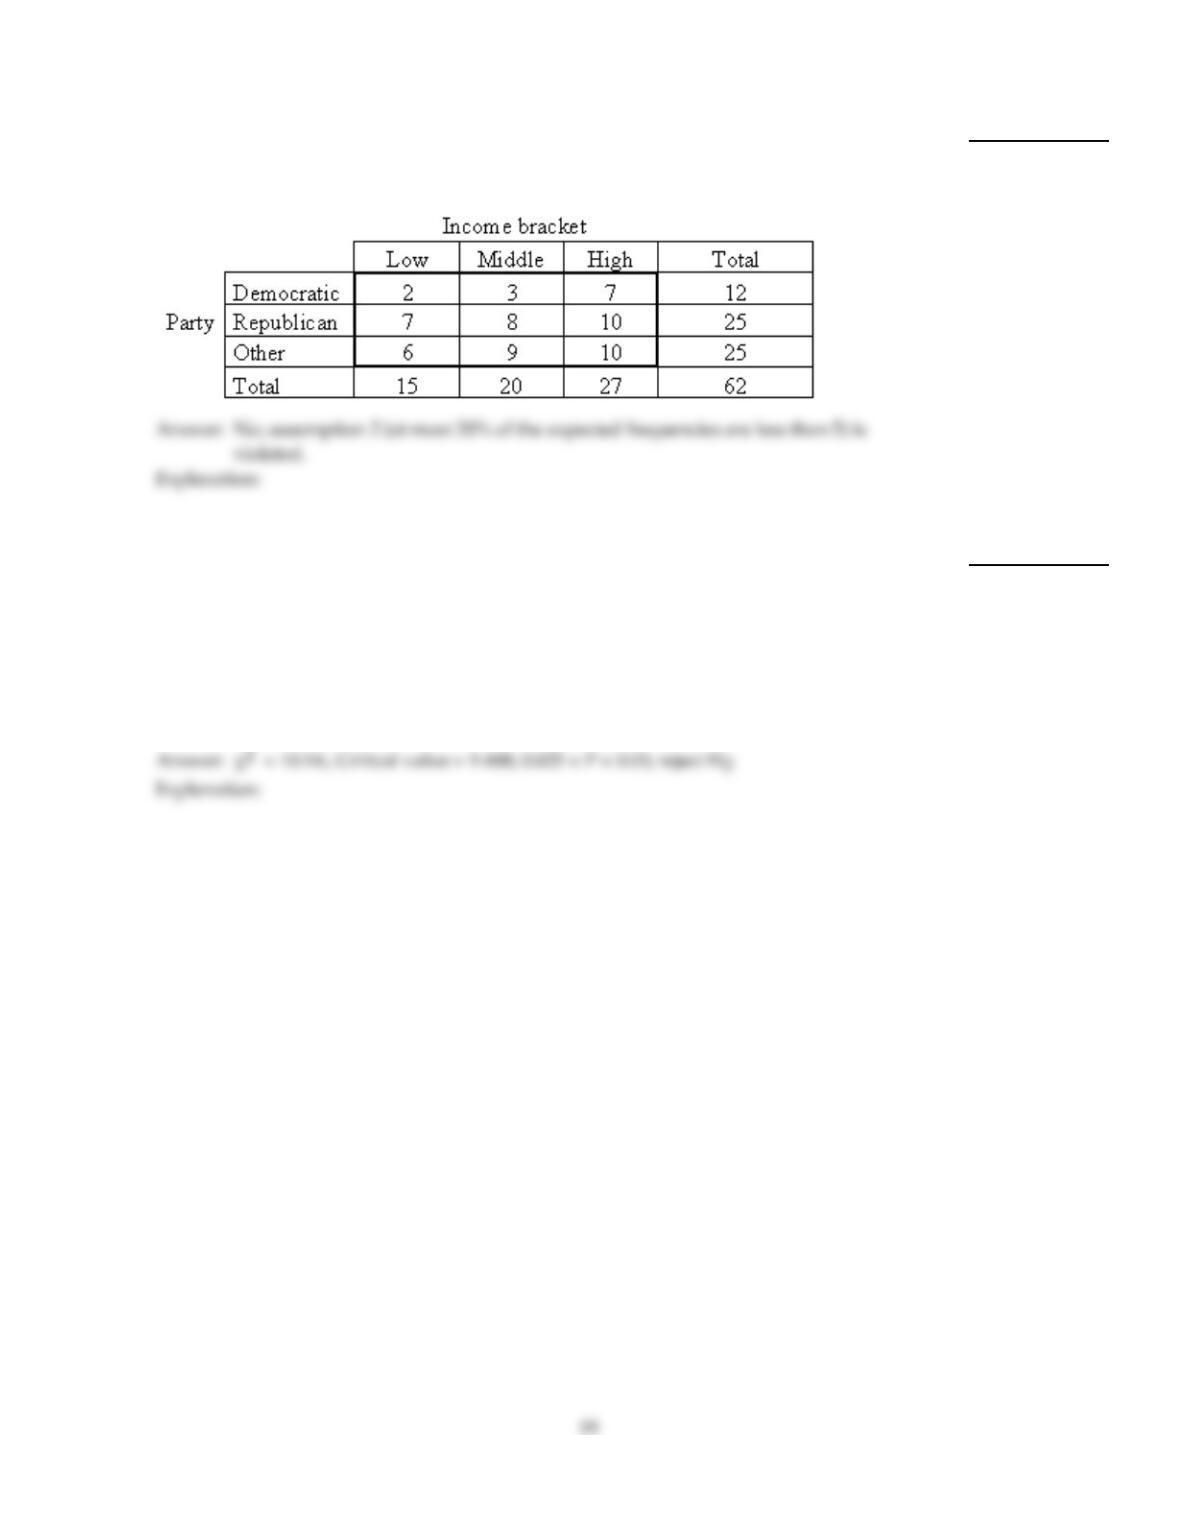
Suppose that you wish to perform a chi–square test of independence. The sample data is
given in the contingency table below. Are the assumptions for the test met? If not, which
assumption is violated?
38)
Solve the problem.
39)
The table below shows a distribution and the observed frequencies of the values of a
variable from a simple random sample of a population. Perform a chi–square
goodness–of–fit test, at the specified significance level, to decide whether the distribution
of the variable differs from the given distribution.
Distribution: 0.2 0.2 0.1 0.2 0.3
Observed frequencies: 37 15 12 23 43
Significance level = 0.05
39)
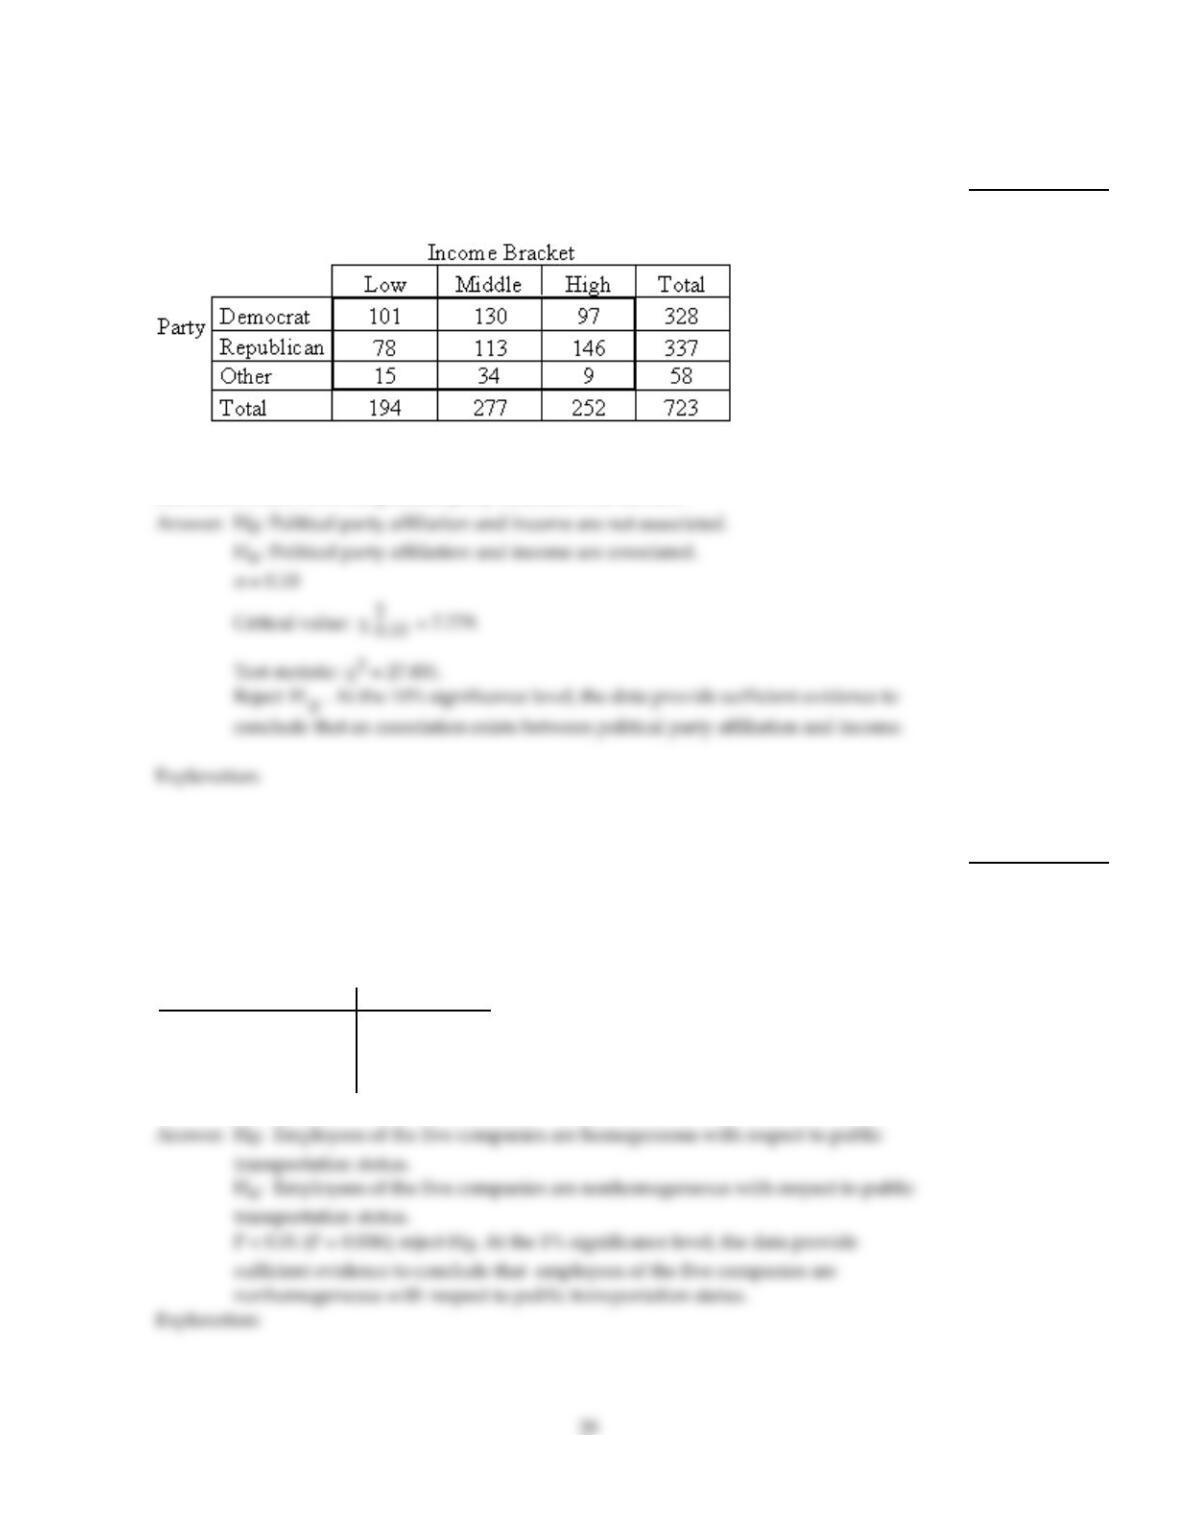
Perform a chi–square independence test using the critical value approach, provided the conditions for using the test are
met. Be sure to state the hypotheses and the significance level, to obtain the expected frequencies, to obtain the critical
value, to compute the value of the test statistic, and to state your conclusion.
40)
A researcher performed a study to determine whether an association exists between
political party affiliation and income. She obtained the following sample data.
At the 10% significance level, do the data provide sufficient evidence to conclude that an
association exists between political party affiliation and income?
40)
Perform a chi–square homogeneity test, provided the conditions for the test are met. Use the P–value approach.
41)
An independent simple random sample of 100 employees from 5 different companies was
selected, and the number who take public transportation to work was recorded. The results
are listed below, showing public transportation status and the five companies. At the 1%
significance level, test the claim that employees of the five companies are
nonhomogeneous with respect to public transportation status.
Companies
1 2 3 4 5
Use Public Trans. 18 25 12 33 22
Don’t Use Public Trans. 82 75 88 67 78
41)