
Exam
Name___________________________________
MULTIPLE CHOICE. Choose the one alternative that best completes the statement or answers the question.
Provide an appropriate response.
1)
Traditionally in hypothesis testing the null hypothesis represents the “status quo” which will be
overturned only if there is evidence against it. Which of the statements below might represent a
null hypothesis?
1)
A)
The treatment has no effect.
B)
The teaching method raises SAT scores.
C)
The defendant is guilty.
D)
None of the above

Solve the problem.
2)
A high school biology student wishes to test the hypothesis that hummingbird feeders can affect
the mean mass of ruby–throated hummingbirds in the area surrounding the feeder. She captures
and weighs several of the hummingbirds near a science museum where several feeders are located.
She obtains the following masses in grams:
4.4 3.9 4.5 4.3 4.1 3.8
3.8 4.1 3.9 3.8 3.2 4.3
The student’s hypotheses are:
H0: µ= 3.65 g
Ha: µ> 3.65 g
Use technology to calculate the P–value, then determine whether the data provide sufficient
evidence to conclude that the mean mass of the birds in the area surrounding the feeder is greater
than the mean mass of the general population. Test at the 5% significance level and assume that the
population standard deviation is 0.35 g. Also, assess the strength of the evidence against the null
hypothesis.
2)
A)
P = 0.9998; since P >0.05, do not reject the null hypothesis.
At the 5% significance level, the data do not provide sufficient evidence to conclude that the
mean mass of the birds in the area surrounding the feeder is greater than the mean mass of
the general population. The evidence against the null hypothesis is weak or none.
B)
P = 0.0004; since P <0.05, do not reject the null hypothesis.
At the 5% significance level, the data do not provide sufficient evidence to conclude that the
mean mass of the birds in the area surrounding the feeder is greater than the mean mass of
the general population. The evidence against the null hypothesis is weak or none.
C)
P = 0.0004; since P <0.05, reject the null hypothesis.
At the 5% significance level, the data do provide sufficient evidence to conclude that the mean
mass of the birds in the area surrounding the feeder is greater than the mean mass of the
general population. The evidence against the null hypothesis is very strong.
D)
P = 0.0002; since P <0.05, reject the null hypothesis.
At the 5% significance level, the data do provide sufficient evidence to conclude that the mean
mass of the birds in the area surrounding the feeder is greater than the mean mass of the
general population. The evidence against the null hypothesis is very strong.
Provide an appropriate response.
3)
A hypothesis test is to be performed for a population mean. Which of the following does the
probability of a Type II error not depend on?
3)
A)
The sample size
B)
The true mean, µ
C)
The significance level
D)
The sample mean
Solve the problem. Use the critical–value approach.
2
4)
A sheet–metal press stamps out bolt washers with a nominal inner diameter of 0.25 inches.
Measurement of the inner diameters of a random sample of 14 washers produced the following
results (in inches):
0.253 0.251 0.253 0.251 0.264 0.252 0.259
0.252 0.264 0.263 0.253 0.268 0.266 0.268
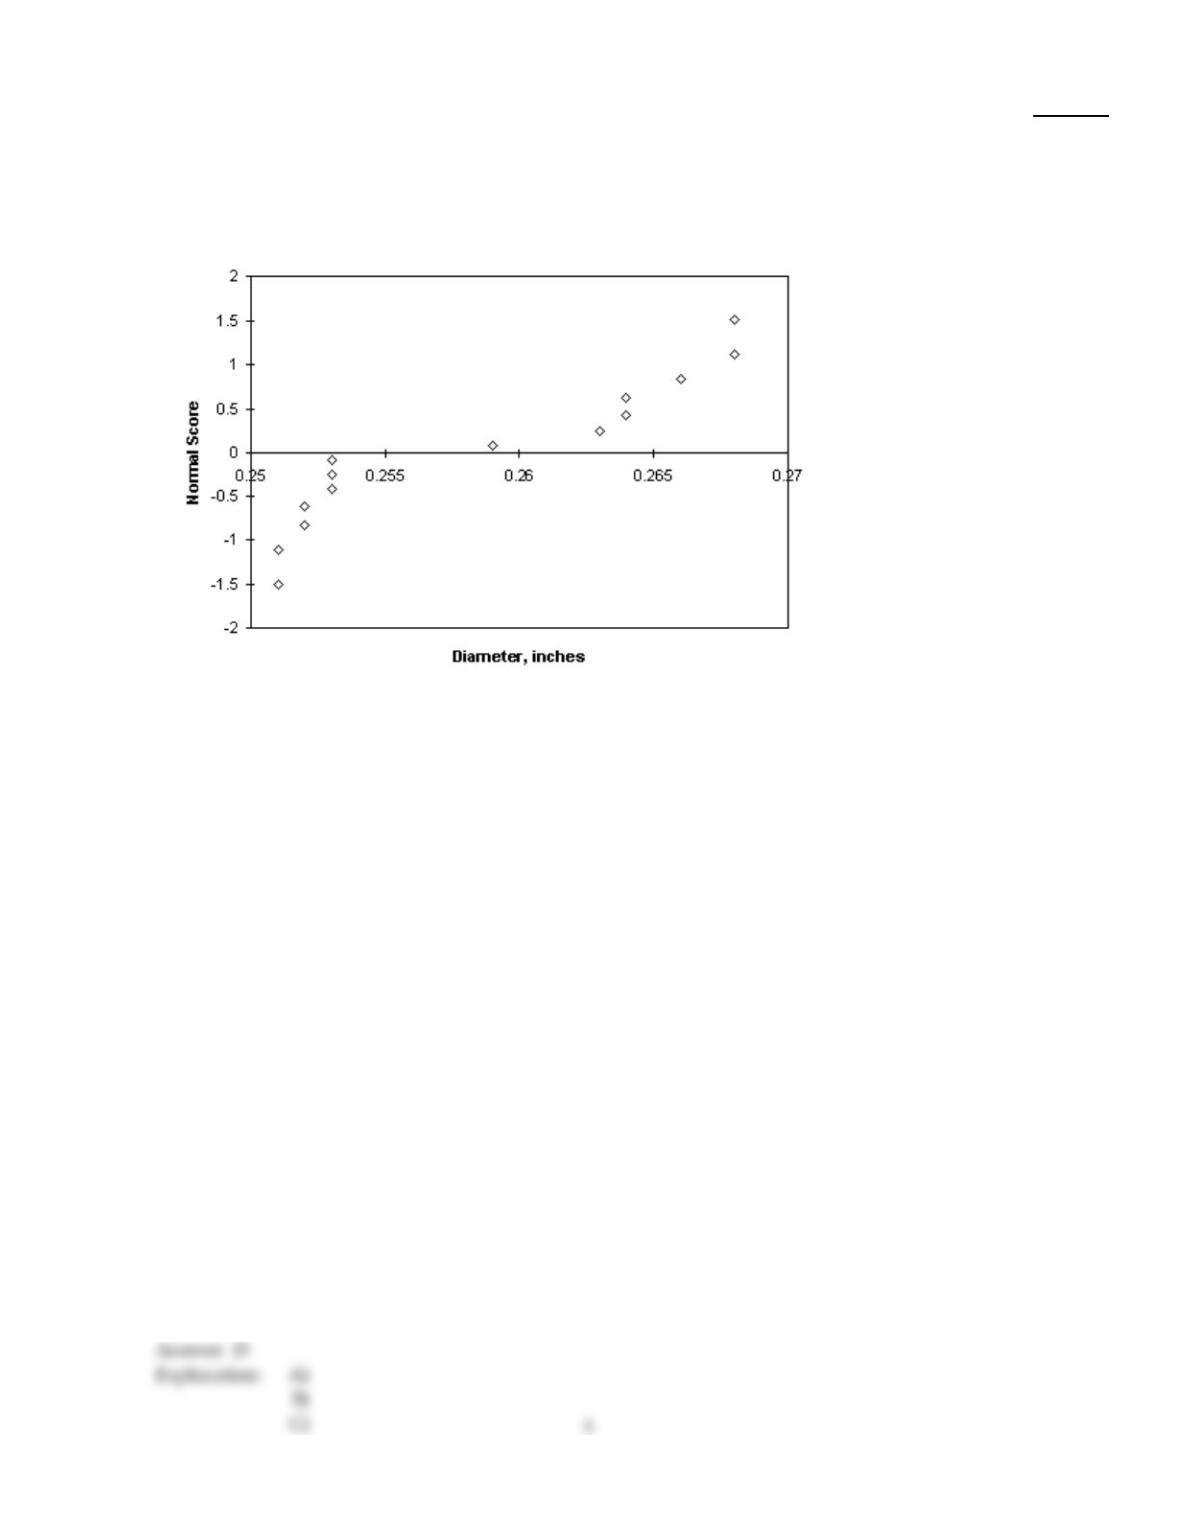
The normal scores of the data are summarized below:
Using technology, perform the following hypothesis test: at the 1% significance level, determine
whether the mean washer diameter for this machine exceeds the nominal value. Comment on the
appropriateness of the test.
4)
A)
Test statistic: t = 2.6503; Critical value: 4.5865.
Since the test statistic is less than the critical value, do not reject the null hypothesis
H0: µ= 0.25 inches. There is insufficient evidence to conclude that the inner diameter is larger
than the nominal value. However, the normal probability plot indicates that the data are not
distributed normally, so the t–test may not be appropriate.
B)
Test statistic: t = 2.6503; Critical value: 4.5865.
Since the test statistic is less than the critical value, do not reject the null hypothesis
H0: µ= 0.25 inches. There is insufficient evidence to conclude that the inner diameter is larger
than the nominal value. The normal probability distribution plot indicates that the t–test is an
appropriate test.
C)
Test statistic: t = 4.5865; Critical value: 1.7709.
Since the test statistic is greater than the critical value, reject the null hypothesis H0: µ= 0.25
inches.
There is sufficient evidence to conclude that the inner diameter is larger than the nominal
value. However, the normal probability plot indicates that the data are not distributed
normally, so the t–test may not be appropriate.
D)
Test statistic: t = 4.5865; Critical value: 2.650.
Since the test statistic is greater than the critical value, reject the null hypothesis H0: µ= 0.25
inches.
There is sufficient evidence to conclude that the inner diameter is larger than the nominal
value. However, the normal probability plot indicates that the data are not distributed
normally, so the t–test may not be appropriate.

Solve the problem.
5)
A high school biology student wishes to test the hypothesis that hummingbird feeders can affect
the mean mass of ruby–throated hummingbirds in the area surrounding the feeder. She captures
and weighs several of the hummingbirds near a science museum where several feeders are located.
She obtains the following masses in grams:
4.2 3.9 3.6 3.5 3.9 3.8
3.8 4.1 3.9 3.8 3.2 3.4
The student’s hypotheses are:
H0: µ= 3.65 g
Ha: µ> 3.65 g
Use technology to calculate the P–value, then determine whether the data provide sufficient
evidence to conclude that the mean mass of the birds in the area surrounding the feeder is greater
than the mean mass of the general population. Test at the 5% significance level and assume that the
population standard deviation is 0.35 g. Also, assess the strength of the evidence against the null
hypothesis.
5)
A)
P = 0.255; since P >0.05, reject the null hypothesis.
At the 5% significance level, the data do provide sufficient evidence to conclude that the mean
mass of the birds in the area surrounding the feeder is greater than the mean mass of the
general population. The evidence against the null hypothesis is moderate.
B)
P = 0.1418; since P >0.05, do not reject the null hypothesis.
At the 5% significance level, the data do not provide sufficient evidence to conclude that the
mean mass of the birds in the area surrounding the feeder is greater than the mean mass of
the general population. The evidence against the null hypothesis is weak or none.
C)
P = 0.509; since P >0.05, reject the null hypothesis.
At the 5% significance level, the data do provide sufficient evidence to conclude that the mean
mass of the birds in the area surrounding the feeder is greater than the mean mass of the
general population. The evidence against the null hypothesis is strong.
D)
P = 0.745; since P >0.05, do not reject the null hypothesis.
At the 5% significance level, the data do not provide sufficient evidence to conclude that the
mean mass of the birds in the area surrounding the feeder is greater than the mean mass of
the general population. The evidence against the null hypothesis is weak or none.
Solve the problem. Use the critical–value approach.
4
6)
A machine that fills soda bottles is supposed to fill them to a mean volume of 16.2 fluid ounces. A
random sample of 20 filled bottles produced the following volumes in fluid ounces:
16.3 15.9 16.7 15.3 17.1 16.4 3.9 15.9 16.2 3.4
16.4 8.2 15.5 16.5 16.0 16.3 15.8 16.7 16.5 15.5
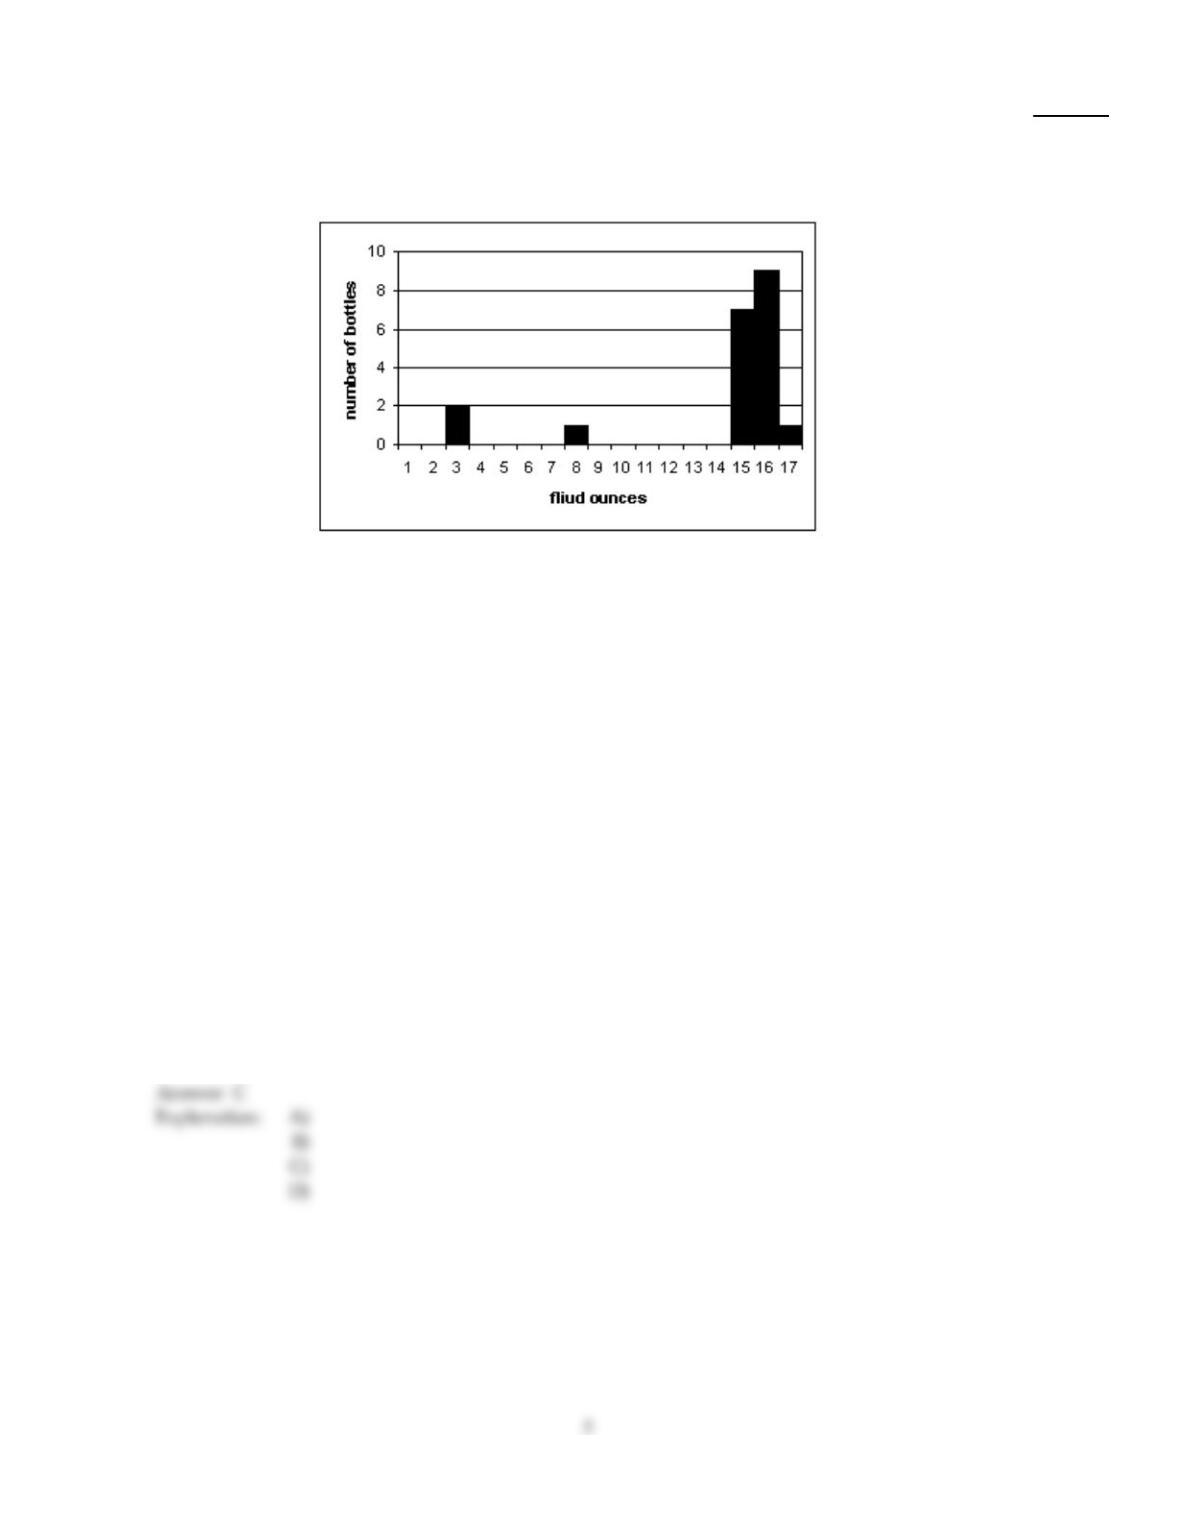
These data are summarized on the following histogram:
Using technology, perform the following hypothesis test: at the 5% significance level, determine
whether the fill volume is less than the supposed value. Comment on the appropriateness of the
test.
6)
A)
Test statistic: t = – 1.8063; Critical value: –2.0921.
Since the test statistic is greater than the critical value, do not reject the null hypothesis
H0: µ= 16.2 oz. There is insufficient evidence to conclude that the fill volume is below 16.2
oz. However, the data exhibits 3 outliers. Elimination of these outliers may alter the
conclusion.
B)
Test statistic: t = – 1.8063; Critical value: –2.0921.
Since the test statistic is greater than the critical value, do not reject the null hypothesis
H0: µ= 16.2 oz. There is insufficient evidence to conclude that the fill volume is below 16.2
oz. The conclusion is on sound statistical ground.
C)
Test statistic: t = – 1.8063; Critical value: –1.729.
Since the test statistic is less than the critical value, reject the null hypothesis H0: µ= 16.2 oz.
There is sufficient evidence to conclude that the fill volume is below 16.2 oz. However, the
data exhibits 3 outliers. Elimination of these outliers may alter the conclusion.
D)
Test statistic: t = – 1.8063; Critical value: –1.7254.
Since the test statistic is less than the critical value, do not reject the null hypothesis H0: µ=
16.2 oz.
There is insufficient evidence to conclude that the fill volume is below 16.2 oz. However, the
data exhibits 3 outliers. Elimination of these outliers may alter the conclusion.
Provide an appropriate response.
7)
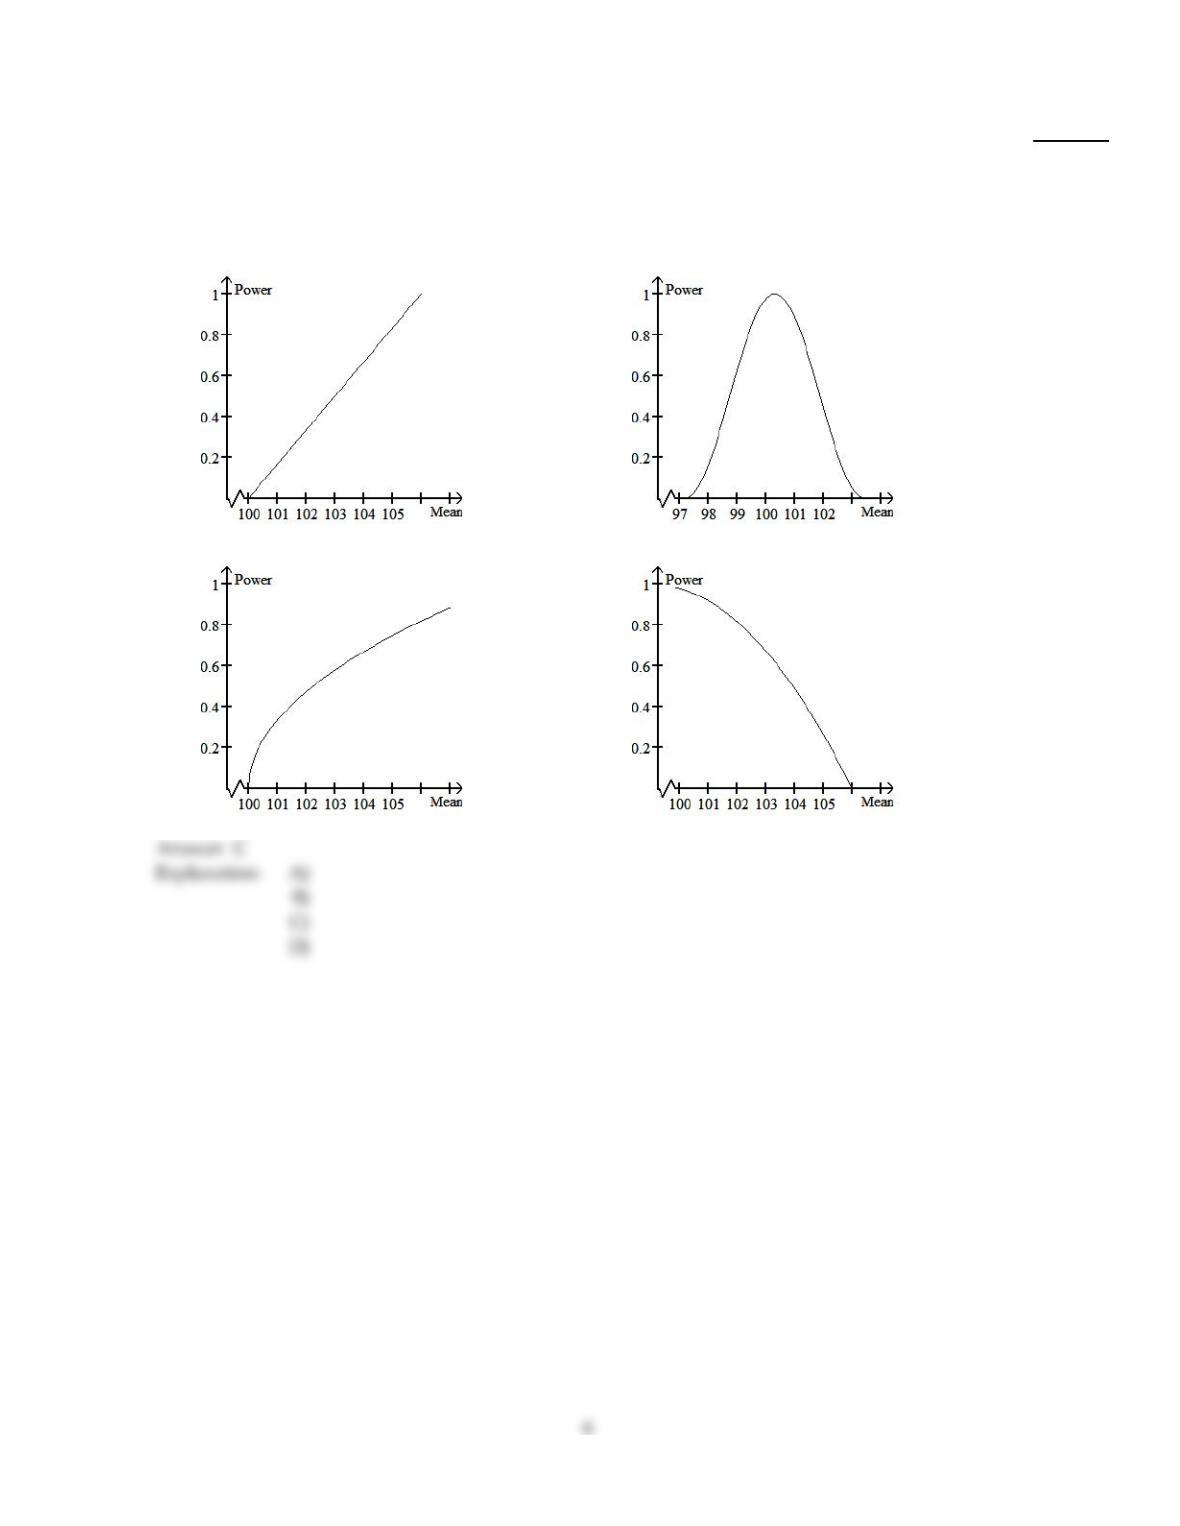
A hypothesis test for a population mean is to be performed. The hypotheses are
H0: µ= 100
Ha: µ> 100.
Which of the sketches below could represent the power curve for the test?
7)
A)
B)
C)
D)
8)
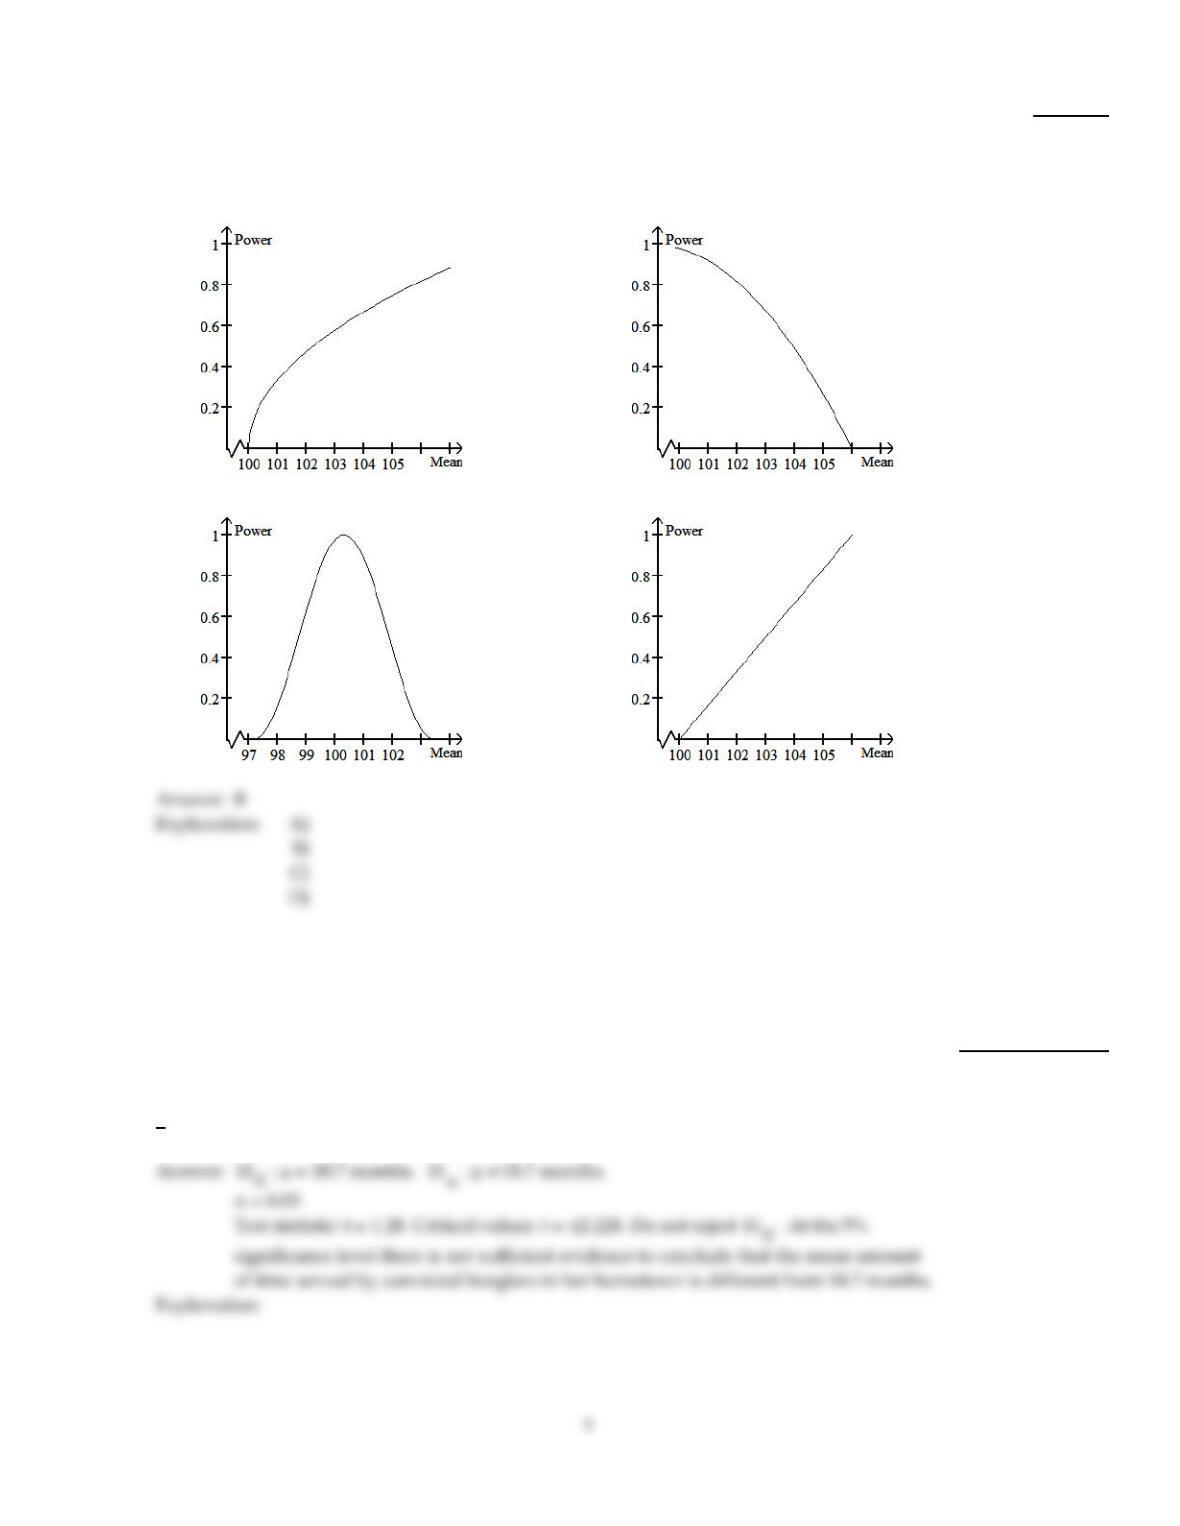
A hypothesis test for a population mean is to be performed. The hypotheses are
H0: µ= 106
Ha: µ< 106.
Which of the sketches below could represent the power curve for the test?
8)
A)
B)
C)
D)
SHORT ANSWER. Write the word or phrase that best completes each statement or answers the question.
Preliminary data analyses indicate that it is reasonable to use a t–test to carry out the specified hypothesis test. Perform
the t–test using the critical–value approach.
9)
In one state, the mean time served in prison by convicted burglars is 18.7 months. A
researcher would like to perform a hypothesis test to determine whether the mean amount
of time served by convicted burglars in her hometown is different from 18.7 months. She
takes a random sample of 11 such cases from court files in her home town and finds that
x=21.4 months and s =7 months. Use a 5% significance level to perform the test.
9)
Preliminary data analyses indicate that it is reasonable to use a t–test to carry out the specified hypothesis test. Perform
the t–test using the P–value approach.
10)
Use a significance level of = 0.05 to test whether µ differs from0.32. The sample data
consist of 8 scores for which x= – 0.11 and s =0.38. State the null and alternative
hypotheses, compute the value of the test statistic, and find the P–value. State your
conclusion.
10)
Use the Wilcoxon signed–rank test to perform the required hypothesis test. Be sure to state the hypotheses and the
significance level, to obtain the critical value(s), to compute the value of the test statistic, and to state your conclusion.
11)
The forced vital capacity (FVC) is often used by physicians to assess a person’s ability to
move air in and out of their lungs. It is the maximum amount of air that can be exhaled
after a deep breath. For adult males, the average FVC is 5.0 liters. A researcher wants to
perform a hypothesis test to determine whether the average forced vital capacity for
women differs from this value. A random sample of 12 women yielded the following
values for FVC, in liters.
4.7 4.5 5.2 5.1 4.0 5.4
4.1 3.7 3.2 4.3 4.4 3.5
At the 1% significance level, do the data provide sufficient evidence to conclude that the
mean forced vital capacity for women differs from the mean value for men of 5.0 liters?
11)
Provide an appropriate response.
12)
Suppose that you want to perform a hypothesis test for a population mean. Give an
example of a situation in which both the z–test and the Wilcoxon signed–rank test are
permissible but the Wilcoxon signed–rank test is preferable. Specify the distribution of the
variable under consideration, the sample size, and whether or not the population standard
deviation is known.
12)
Construct a graph portraying the decision criterion for the specified hypothesis test.
13)
A hypothesis test for a population mean is conducted. The hypotheses are:
H0: µ=µ0
Ha: µ<µ0
The significance level is 0.10 and the critical value is –1.28. Sketch a normal curve
displaying the decision criterion. This curve will represent the normal curve for the test
statistic under the assumption that the null hypothesis is true. On your graph indicate the
area in the tail, the critical value, the rejection region, and the nonrejection region.
13)
Perform a one–sample z–test for a population mean using the P–value approach. Be sure to state the hypotheses and the
significance level, to compute the value of the test statistic, to obtain the P–value, and to state your conclusion. Also,
assess the strength of the evidence against the null hypothesis.
14)
The forced vital capacity (FVC) is often used by physicians to assess a person’s ability to
move air in and out of their lungs. It is the maximum amount of air that can be exhaled
after a deep breath. For adult males, the mean FVC is 5.0 liters. A researcher wants to
perform a hypothesis test to determine whether the mean forced vital capacity for women
differs from this value. The mean forced vital capacity for a random sample of 85 women
was 4.8 liters. Do the data provide sufficient evidence to conclude that the mean forced
vital capacity for women differs from 5.0 liters, the mean value for men? Perform the
appropriate hypothesis test using a significance level of 5%. Assume that = 0.9 liters.
14)
Provide an appropriate response.
15)
A hypothesis test for a population mean is to be performed. Suppose that the sample size is
50 but that the data contain outliers. Is it reasonable to use the z–test? How should you
proceed?
15)
Perform a hypothesis test for the population mean. Assume that preliminary data analyses indicate that it is reasonable to
apply the z–test. Use the critical–value approach.
16)
The Maine Department of Natural Resources reported that the mean weight of lobsters
trapped in the state is 1.7 pounds. Carl Lewis is a lobster trapper off the coast of Maine.
Carl suspects that this figure is too high so he records the weights of a random sample of
45 lobsters that he trapped. The mean weight of the lobsters in the sample was
1.5 pounds. Using a 1% level of significance, perform a hypothesis test to determine
whether the population mean is lower than 1.7 pounds. Assume that the population
standard deviation is 0.6 pounds.
16)
Provide an appropriate response.
17)
A one–sample z–test for a population mean is to be performed. The hypotheses are
H0: µ= 100
Ha: µ 100.
Let z0 denote the observed value of the test statistic, z. Suppose that z0 is positive and
the P–value for the test is 0.07. Is the following a correct interpretation of the P–value? If
not, give a correct interpretation of the P–value. If the null hypothesis were true, the
probability of observing a value of the test statistic as large or larger than that observed
would be 0.07.
17)
Preliminary data analyses indicate that it is reasonable to use a t–test to carry out the specified hypothesis test. Perform
the t–test using the critical–value approach.
18)
Use a 1% significance level to test the claim that µ> 2.85. The sample data consists of
9 scores for which x=3.27 and s =0.56.
18)
Perform a one–sample z–test for a population mean using the P–value approach. Be sure to state the hypotheses and the
significance level, to compute the value of the test statistic, to obtain the P–value, and to state your conclusion. Also,
assess the strength of the evidence against the null hypothesis.
19)
In 2000, the average duration of long–distance telephone calls originating in one town was
9.4 minutes. A long–distance telephone company wants to perform a hypothesis test to
determine whether the average duration of long–distance phone calls has changed from
the 2000 mean of 9.4 minutes. They randomly sampled 50 calls originating in the town and
found that the mean duration of these 50 calls was 8.6 minutes. Do the data provide
sufficient evidence to conclude that the mean call duration, µ, has changed from the 2000
mean of 9.4 minutes? Perform the appropriate hypothesis test using a significance level of
1%. Assume that = 4.8 minutes.
19)
Provide an appropriate response.
20)
Suppose that you want to perform a hypothesis test for a population mean. Assume the
variable under consideration has a symmetric nonnormal distribution, the population
standard deviation is known, and the sample size is large. Is it permissible to use the z–test
to perform the hypothesis test? Is it permissible to use the Wilcoxon signed–rank test?
Which procedure is preferable?
20)

21)
Suppose that you wish to perform a hypothesis test for a population mean using the
P–value method. Suppose that the population standard deviation is unknown. The correct
procedure to use is the t–test. If you mistakenly use the standard normal table to obtain the
P–value, will the value that you obtain be larger or smaller than the correct value? Does
the mistaken use of the normal table make it more or less likely that the null hypothesis
will be rejected?
21)
Preliminary data analyses indicate that it is reasonable to use a t–test to carry out the specified hypothesis test. Perform
the t–test using the P–value approach.
22)
A light–bulb manufacturer advertises that the mean life for its light bulbs is 900 hours. A
random sample of 15 of its light bulbs resulted in the following lives in hours.
995 590 510 539 739 917 571 555
916 728 664 693 708 887 849
At the 10% significance level, do the data provide evidence that the mean life for the
company’s light bulbs differs from the advertised mean?
22)
Provide an appropriate response.
23)
When performing a one–sample z–test for a population mean, what criterion do you use
for rejecting the null hypothesis using the critical value approach? using the P–value
approach? Assume that a right–tailed test is being performed.
23)
24)
Give an example of a situation in which you might wish to conduct a right–tailed
hypothesis test concerning a population mean. State in words what you wish to determine
and write the null and alternative hypotheses in words and symbolically.
24)

Perform a one–sample z–test for a population mean using the P–value approach. Be sure to state the hypotheses and the
significance level, to compute the value of the test statistic, to obtain the P–value, and to state your conclusion. Also,
assess the strength of the evidence against the null hypothesis.
25)
A car insurance company has determined that the mean annual car insurance cost for a
family in the town of Watlington is $1716. A researcher wants to perform a hypothesis test
to determine whether the mean insurance cost for a family in the town of Putford is higher
than this. The mean insurance cost for a random sample of 32 families in Putford was
$1761. At the 10% significance level, do the data provide sufficient evidence to conclude
that the mean insurance cost for a family in Putford is higher than $1716, the mean cost for
a family in Watlington.? Assume that the population standard deviation is $35.50.
25)
Perform a hypothesis test for the population mean. Assume that preliminary data analyses indicate that it is reasonable to
apply the z–test. Use the critical–value approach.
26)
A newspaper in a large midwestern city reported that the National Association of Realtors
said that the mean home price last year was $116,800. The city housing department feels
that this figure is too low. They randomly selected 63 home sales and obtained a sample
mean price of $118,900. Assume that the population standard deviation is $3,700. Using a
5% level of significance, perform a hypothesis test to determine whether the population
mean is higher than $116,800.
26)
Provide an appropriate response.
27)
Give an example of a hypothesis test for which it is important to have a small probability.
Explain why it is important to have a small value for .
27)
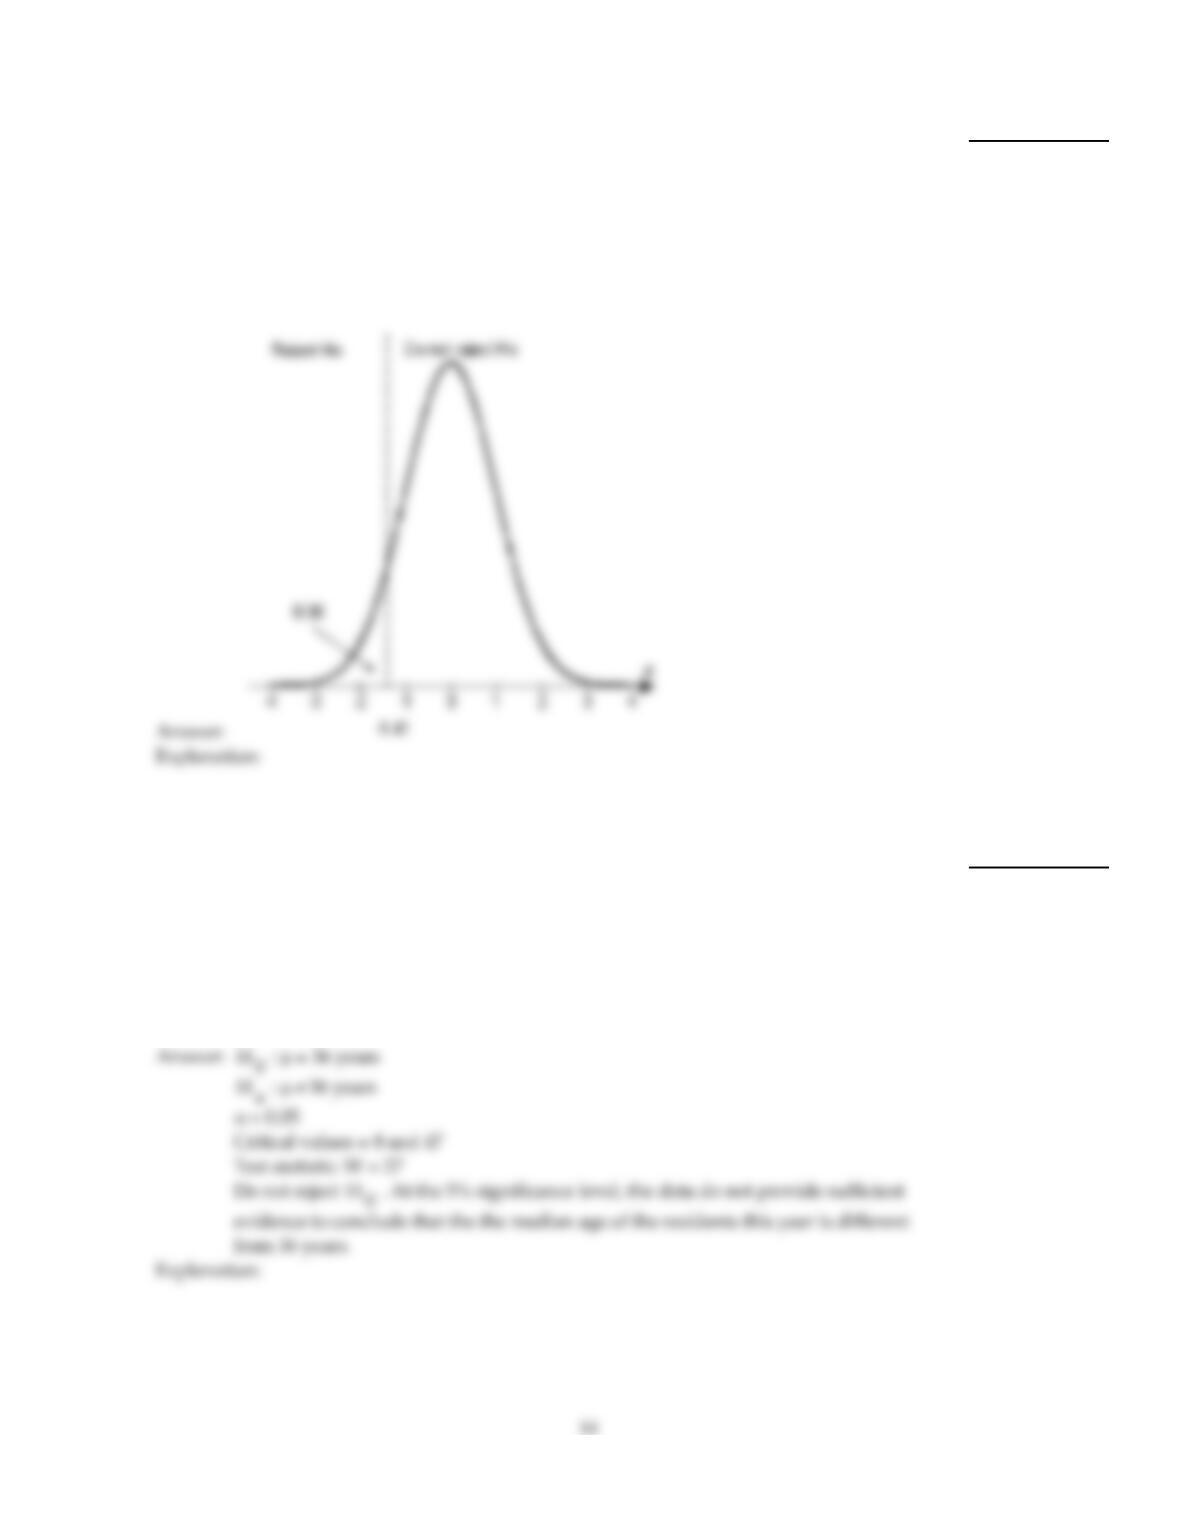
Construct a graph portraying the decision criterion for the specified hypothesis test.
28)
A hypothesis test for a population mean is conducted. The hypotheses are:
H0: µ=µ0
Ha: µ<µ0
The significance level is 0.08 and the critical value is –1.41. Sketch a normal curve
displaying the decision criterion. This curve will represent the normal curve for the test
statistic under the assumption that the null hypothesis is true. On your graph indicate the
area in the tail, the critical value, the rejection region, and the nonrejection region.
28)
Use the Wilcoxon signed–rank test to perform the required hypothesis test. Be sure to state the hypotheses and the
significance level, to obtain the critical value(s), to compute the value of the test statistic, and to state your conclusion.
29)
In 1995, the median age of the residents of one city was 36 years. A random sample taken
this year of 10 residents of the town yielded the following ages in years.
528 37 49 30
68 11 58 40 34
At the 5% significance level, do the data provide sufficient evidence to conclude that the
median age of the residents this year is different from the 1995 median age of 36 years?
29)
Provide an appropriate response.
30)
In 1995, the mean math SAT score for students at one school was 488. A teacher introduces
a new teaching method to prepare students for the SAT. One year later, he performs a
hypothesis test to determine whether the mean math SAT score has increased. The
hypotheses are
H0: µ= 488
Ha: µ> 488.
If the null hypothesis is rejected at the 10% level of significance, do you think the teacher
would feel confident that his teaching method works? What about if the null hypothesis is
rejected at the 1% level of significance? Which of these two results would constitute
stronger evidence that his teaching method works? Explain your thinking.
30)
Preliminary data analyses indicate that it is reasonable to use a t–test to carry out the specified hypothesis test. Perform
the t–test using the P–value approach.
31)
A large software company gives job applicants a test of programming ability and the mean
for that test has been 160 in the past. Twenty–five job applicants are randomly selected
from a large university and they produce a mean score of 183 with a standard deviation of
12. Use a 0.05 level of significance to test whether the mean score for students from this
university is greater than 160.
31)
A hypothesis testing situation is given. The population standard deviation, sample size, and significance level are given.
Complete the table to give the probability of a Type II error and the power for each of the given values of µ. Use the table
to draw the power curve.
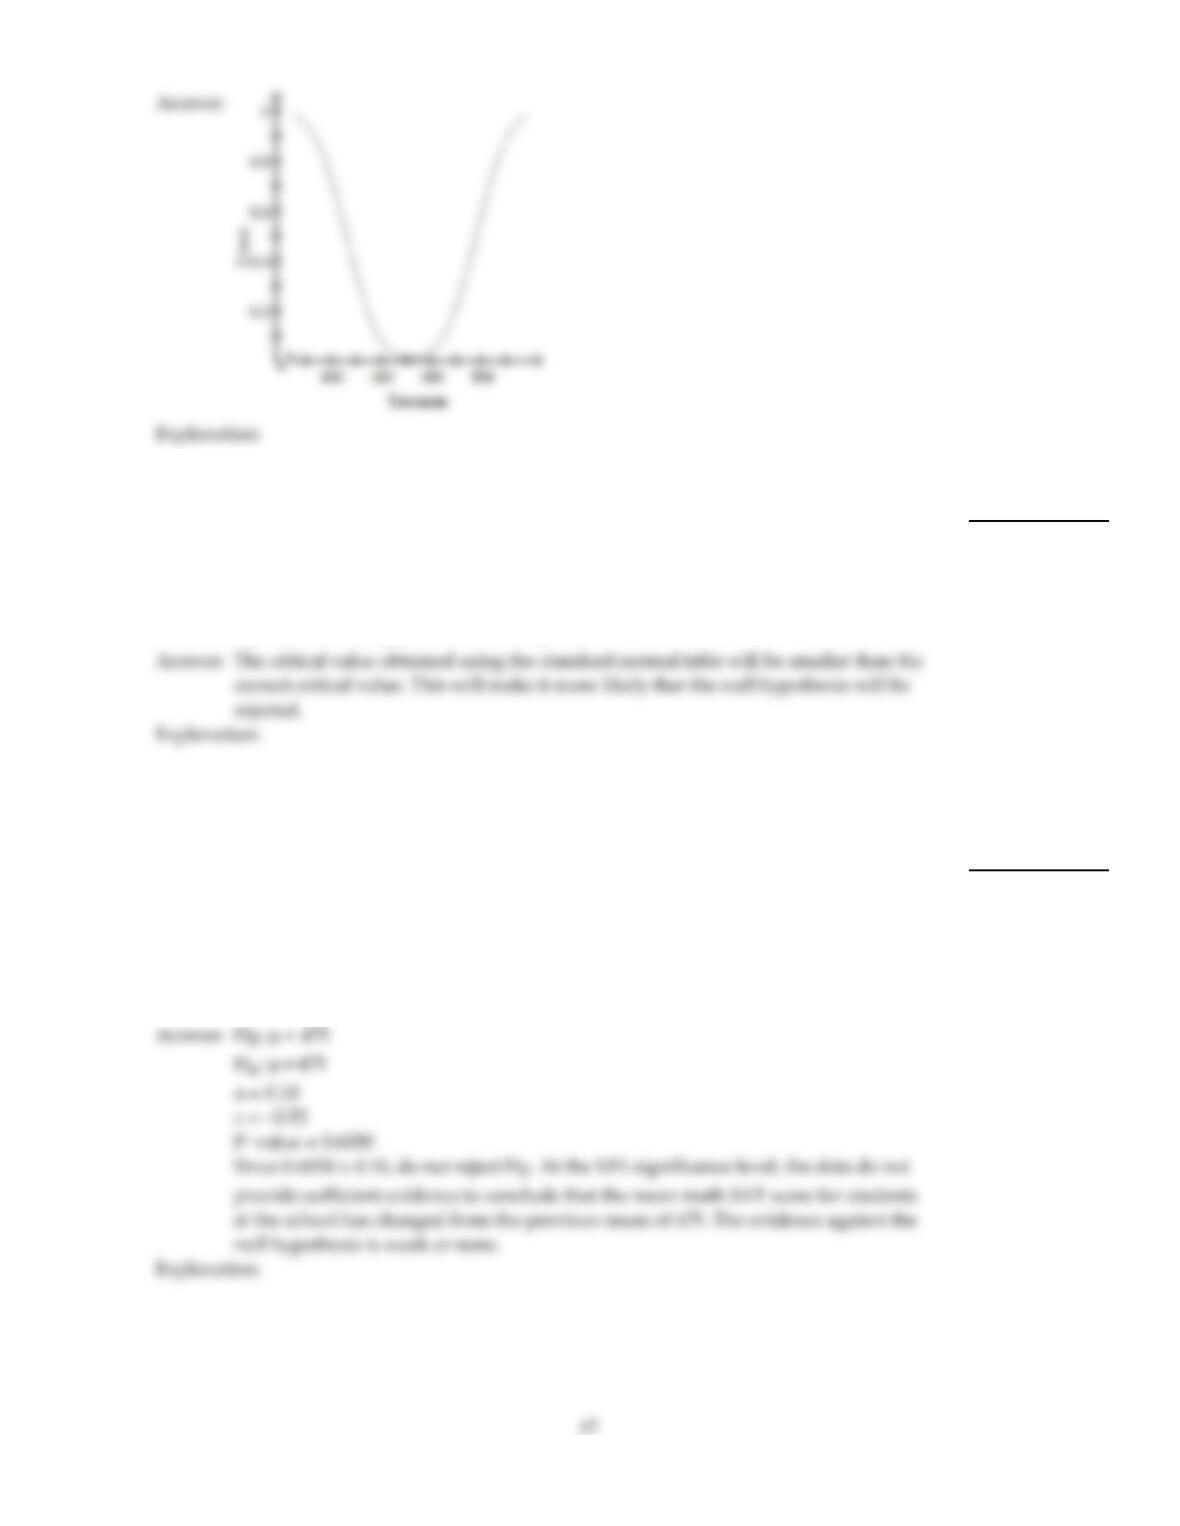
32)
In 1990, the average math SAT score for students at one school was 472. Five years later, a
teacher wants to perform a hypothesis test to determine whether the average SAT score of
students at the school has changed from the 1990 mean of 472. Preliminary data analyses
indicate that it is reasonable to apply a z–test. The hypotheses are
H0: µ= 472
Ha: µ 472.
Assume that = 74, n = 54, and the significance level is 0.01. Find the probability of a Type
II error and the power for µ = 424, 430, 440, 450, 460, 470, 474, 484, 494, 504, 514, 520.
True mean P(Type II error) Power
µ 1 –
424
32)
15
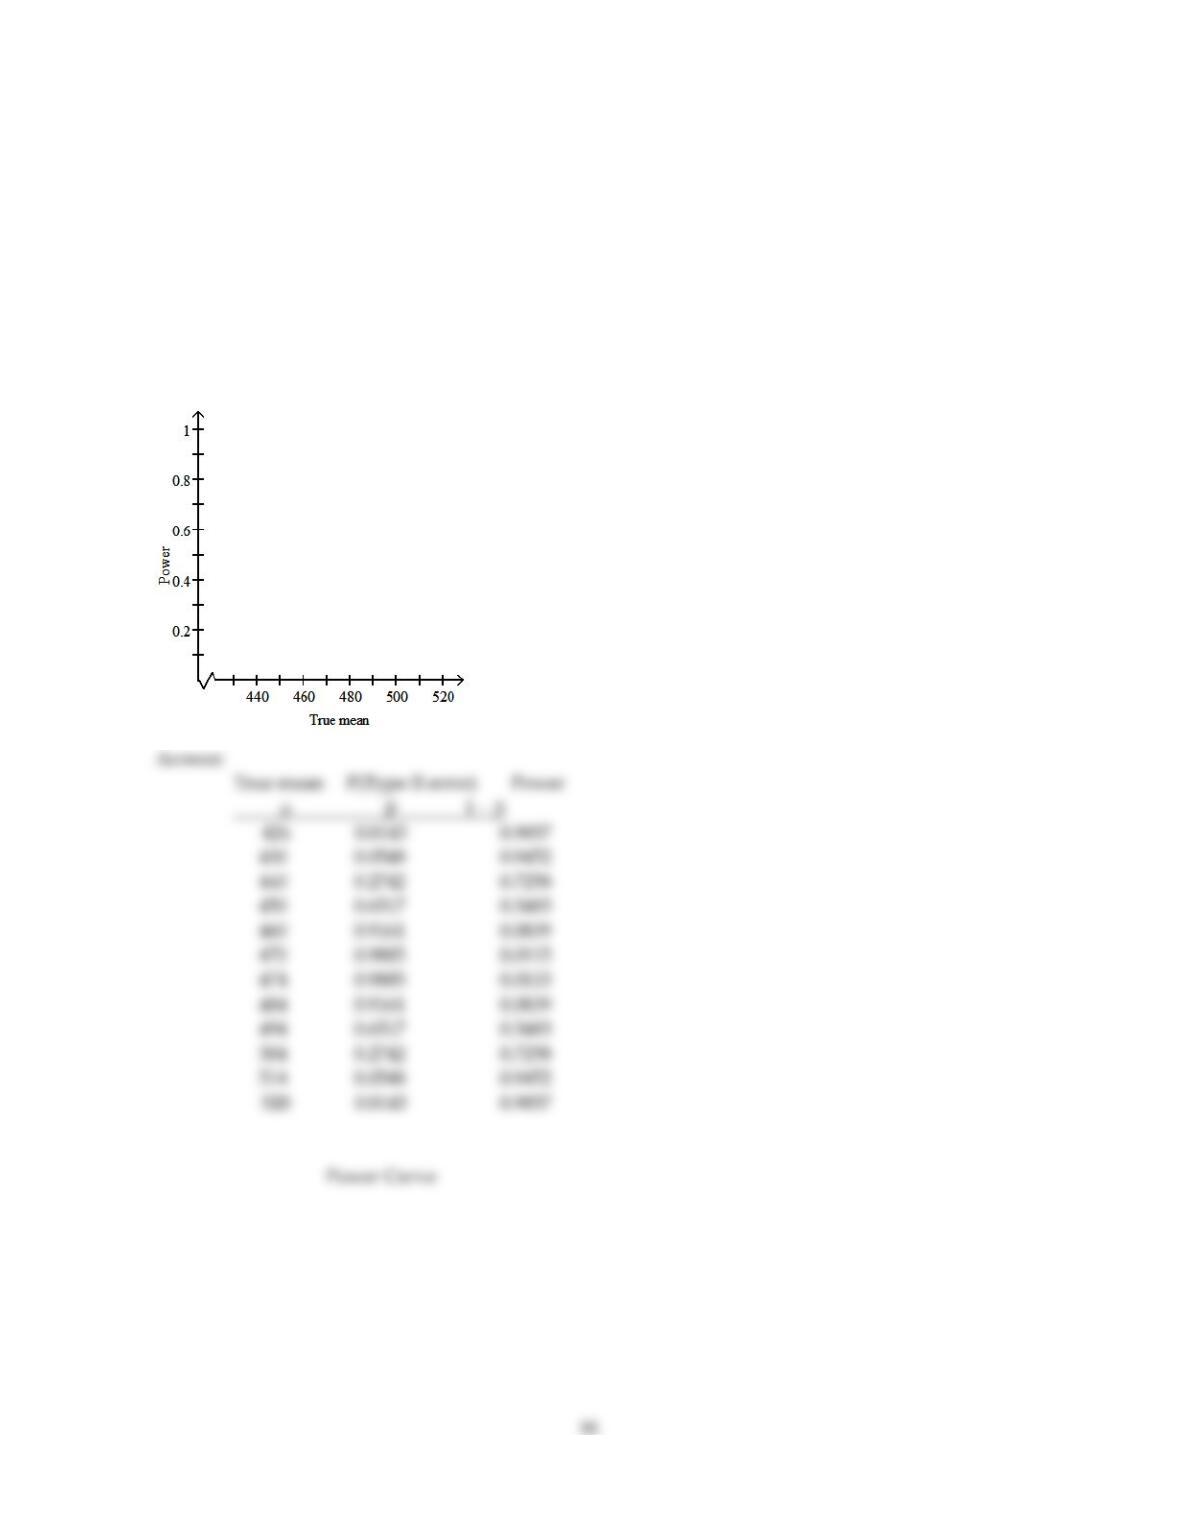
430
440
450
460
470
474
484
494
504
514
520
Power Curve
Provide an appropriate response.
33)
Suppose that you wish to perform a hypothesis test for a population mean using the
critical value method. The test is right–tailed. Suppose that the population standard
deviation is unknown. The correct procedure to use is the t–test. If you mistakenly use the
standard normal table to obtain the critical value, will the value that you obtain be larger
or smaller than the correct value? Does the mistaken use of the normal table make it more
or less likely that the null hypothesis will be rejected?
33)
Perform a one–sample z–test for a population mean using the P–value approach. Be sure to state the hypotheses and the
significance level, to compute the value of the test statistic, to obtain the P–value, and to state your conclusion. Also,
assess the strength of the evidence against the null hypothesis.
34)
Five years ago, the average math SAT score for students at one school was 475. A teacher
wants to perform a hypothesis test to determine whether the mean math SAT score of
students at the school has changed. The mean math SAT score for a random sample of 40
students from this school is 469. Do the data provide sufficient evidence to conclude that
the mean math SAT score for students at the school has changed from the previous mean of
475? Perform the appropriate hypothesis test using a significance level of 10%. Assume
that = 73.
34)
Use the Wilcoxon signed–rank test to perform the required hypothesis test. Be sure to state the hypotheses and the
significance level, to obtain the critical value(s), to compute the value of the test statistic, and to state your conclusion.
35)
Last year, the mean waiting time for the number 14 bus was 11.4 minutes. This year, a
random sample of 12 waits for the bus yielded the following waiting times, in minutes.
10.2 14.6 6.0 20.5 2.7 23.6
14.1 8.6 30.6 4.7 12.0 16.9
At the 1% significance level, do the data provide sufficient evidence to conclude that the
mean waiting time this year is higher than last year’s mean time of 11.4 minutes?
35)
Provide an appropriate response.
36)
Give an example of a hypothesis test for which it is important to have a small probability.
Explain why it is important to have a small value for .
36)
37)
A right–tailed hypothesis test for a population mean is to be performed. If the null
hypothesis is rejected at the 5% level of significance, does this necessarily mean that it
would be rejected at the 1% level of significance? at the 10% level of significance? Explain
your reasoning. In your explanation, refer to the critical values corresponding to the
different significance levels.
37)
Preliminary data analyses indicate that it is reasonable to use a t–test to carry out the specified hypothesis test. Perform
the t–test using the critical–value approach.
38)
The mean waiting time for bus number 14 during peak hours used to be 10 minutes. A
public bus company official claims that more buses are now in service and that the mean
waiting time for bus number 14 during peak hours is now less than 10 minutes. Karen
took bus number 14 during peak hours on 18 different occasions. Her mean waiting time
was 7.1 minutes with a standard deviation of 2 minutes. At the 1% significance level, test
the claim that the mean is less than 10 minutes.
38)
Decide whether it appears reasonable to use a t–test to perform a hypothesis test for the mean in question. Explain your
answer and include any relevant graphs, such as a normal probability plot, histogram, or stem–and–leaf diagram. If there
are outliers, explain how to proceed.
39)
The hourly salaries (in dollars) of 28 randomly selected working adults are as follows:
9 20 18 24 19 12 35
16 20 13 15 22 10 30
12 8 21 40 38 24 14
22 50 16 19 23 10 120
39)

Provide an appropriate response.
40)
A bottle filling machine fills 16–ounce bottles with juice. The amount of juice varies from
bottle to bottle, however the average amount of juice is supposed to be 16.0 ounces. The
manufacturer performs a hypothesis test to determine whether the machine is working
properly. The hypotheses are:
H0: µ= 16.0 ounces
Ha: µ< 16.0 ounces
Do you think that a consumer advocacy group would prefer to have a small probability
or a small probability? Why? Do you think that the manufacturer would prefer to have a
small probability or a small probability? Why?
40)
41)
Describe parametric and nonparametric tests. Explain why nonparametric tests are
important.
41)