Archives: Solution Manual
978-1285867045 Chapter 4 Case
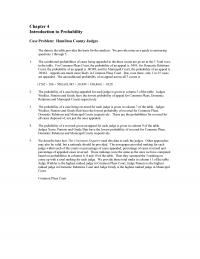
Chapter 4 Introduction to Probability Case Problem: Hamilton County Judges The data in the table provides the basis for the analysis. We provide notes as a guide to answering questions 1 through 5. 1. The conditional probabilities of cases being […]
978-1285867045 Chapter 3 Solution Manual Part 4
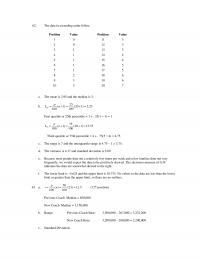
62. The data in ascending order follow. Position Value Position Value 1 0 11 3 2 0 12 3 3 1 13 3 4 1 14 4 5 1 15 4 6 1 16 5 7 1 17 5 8 […]
978-1285867045 Chapter 3 Solution Manual Part 3
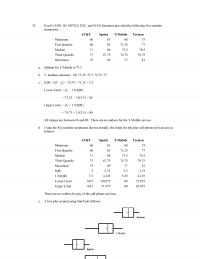
52. Excel’s MIN, QUARTILE.EXC, and MAX functions provided the following five-number summaries: AT&T Sprint T-Mobile Verizon Minimum 66 63 68 75 First Quartile 68 65 71.25 77 Median 71 66 73.5 78.5 Third Quartile 73 67.75 74.75 79.75 Maximum 75 […]
978-1285867045 Chapter 3 Solution Manual Part 2
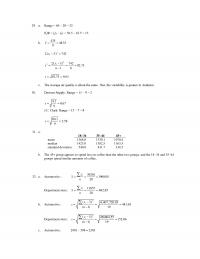
29. a. Range = 60 – 28 = 32 b. IQR = Q3 – Q1 = 56.5 – 43.5 = 13 x= = 435 94833. 2 ( ) 742 i xx − = 18 sn = = = − 92.75 […]
978-1285867045 Chapter 3 Solution Manual Part 1
Chapter 3 Descriptive Statistics: Numerical Measures Learning Objectives 1. Understand the purpose of measures of location. 2. Be able to compute the mean, weighted mean, geometric mean, median, mode, quartiles, and various percentiles. 3. Understand the purpose of measures of […]
978-1285867045 Chapter 3 Case
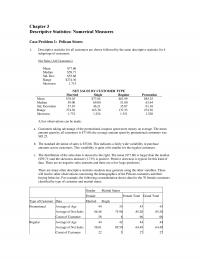
Chapter 3 Descriptive Statistics: Numerical Measures Case Problem 1: Pelican Stores 1. Descriptive statistics for all customers are shown followed by the same descriptive statistics for 4 subgroups of customers. Net Sales (All Customers) Mean $77.60 Median $59.71 Std. Dev. […]
978-1285867045 Chapter 2 Solution Manual Part 5
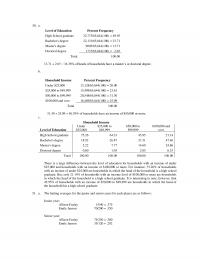
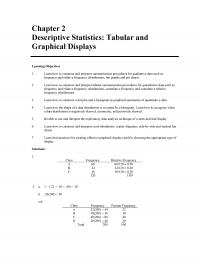
50. a. Level of Education Percent Frequency High School graduate 32,773/65,644(100) = 49.93 Bachelor’s degree 22,131/65,644(100) = 33.71 Master’s degree 9003/65,644(100) = 13.71 Doctoral degree 1737/65,644(100) = 2.65 Total 100.00 13.71 + 2.65 = 16.36% of heads of households have […]
978-1285867045 Chapter 2 Solution Manual Part 4
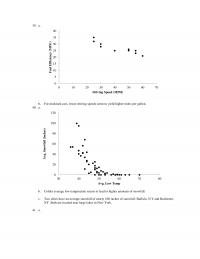
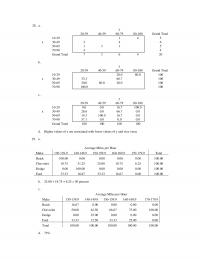
39. a. b. For midsized cars, lower driving speeds seem to yield higher miles per gallon. 40. a. b. Colder average low temperature seems to lead to higher amounts of snowfall. 41. a. c. Two cities have an average snowfall […]
978-1285867045 Chapter 2 Solution Manual Part 3
28. a. y 20–39 40–59 60–79 80-100 Grand Total 10–29 1 4 5 x 30–49 2 4 6 50–69 1 3 1 5 70–90 4 4 Grand Total 7 3 6 4 20 b. y 20–39 40–59 60–79 80-100 Grand […]
978-1285867045 Chapter 2 Solution Manual Part 2
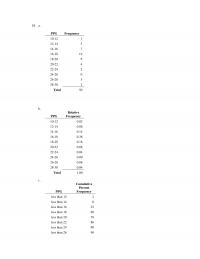
18. a. PPG Frequency 10–12 1 12–14 3 14–16 7 16–18 19 18–20 9 20–22 4 22–24 2 24–26 0 26–28 3 28–30 2 Total 50 b. PPG Relative Frequency 10–12 0.02 12–14 0.06 14–16 0.14 16–18 0.38 18–20 0.18 […]
978-1285867045 Chapter 2 Solution Manual Part 1
Chapter 2 Descriptive Statistics: Tabular and Graphical Displays Learning Objectives 1. Learn how to construct and interpret summarization procedures for qualitative data such as: frequency and relative frequency distributions, bar graphs and pie charts. 2. Learn how to construct and […]
978-1285867045 Chapter 2 Case
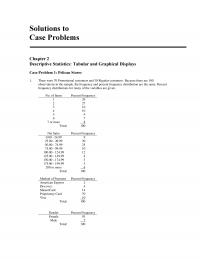
Solutions to Case Problems Chapter 2 Descriptive Statistics: Tabular and Graphical Displays Case Problem 1: Pelican Stores 1. There were 70 Promotional customers and 30 Regular customers. Because there are 100 observations in the sample, the frequency and percent frequency […]
978-1285867045 Chapter 15 Solution Manual
Chapter 15 Statistical Methods for Quality Control Learning Objectives 1. Learn about the importance of total quality, quality control, and how statistical methods can assist in the quality control process. 2. Be able to construct quality control charts and understand […]
978-1285867045 Chapter 14 Solution Manual Part 6
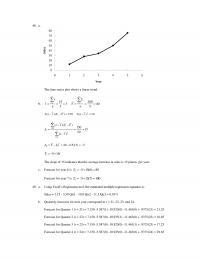
48. a. The time series plot shows a linear trend. b. 12 1 10 () t b tt = = = = − 01 40 (15)(3) 5b Y b t= − = − = − 5 15 t Tt= […]
978-1285867045 Chapter 14 Solution Manual Part 5
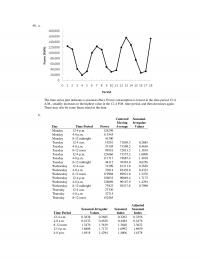
40. a. The time series plot indicates a seasonal effect. Power consumption is lowest in the time period 12–4 A.M., steadily increases to the highest value in the 12-4 P.M. time period, and then decreases again. There may also be […]
978-1285867045 Chapter 14 Solution Manual Part 4
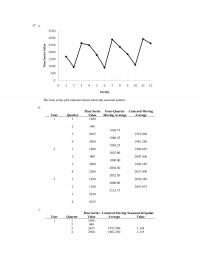
37. a. The time series plot indicates linear trend and seasonal pattern. b. Year Quarter Time Series Value Four-Quarter Moving Average Centered Moving Average 1 1 1690 2 940 1938.75 3 2625 1952.500 1966.25 4 2500 1961.250 1956.25 2 1 […]
978-1285867045 Chapter 14 Solution Manual Part 3
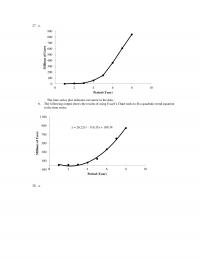
27. a. The time series plot indicates curvature in the data. b. The following output shows the results of using Excel’s Chart tools to fit a quadratic trend equation to the time series. 28. a. 0 100 200 300 400 […]
978-1285867045 Chapter 14 Solution Manual Part 2
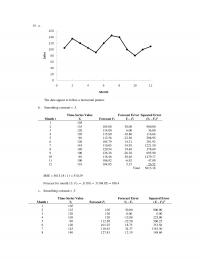
14. a. The data appear to follow a horizontal pattern. b. Smoothing constant = .3. Month t Time-Series Value Yt Forecast Ft Forecast Error Yt – Ft Squared Error (Yt – Ft)2 1 105 2 135 105.00 30.00 900.00 3 […]
978-1285867045 Chapter 14 Solution Manual Part 1
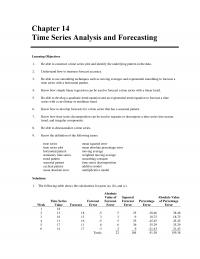
Chapter 14 Time Series Analysis and Forecasting Learning Objectives 1. Be able to construct a time series plot and identify the underlying pattern in the data. 2. Understand how to measure forecast accuracy. 3. Be able to use smoothing techniques […]
978-1285867045 Chapter 14 Case
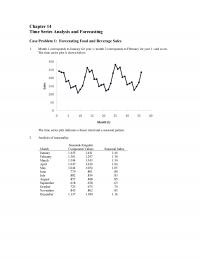
Chapter 14 Time Series Analysis and Forecasting Case Problem 1: Forecasting Food and Beverage Sales 1. Month 1 corresponds to January for year 1; month 2 corresponds to February for year 1; and so on. The time series plot is […]
978-1285867045 Chapter 13 Solution Manual Part 4
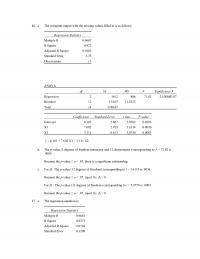
46. a. The computer output with the missing values filled in is as follows: Regression Statistics Multiple R 0.9607 R Square 0.923 Adjusted R Square 0.9102 Standard Error 3.35 Observations 15 ANOVA df SS MS F Significance F Regression 2 […]
978-1285867045 Chapter 13 Solution Manual Part 3
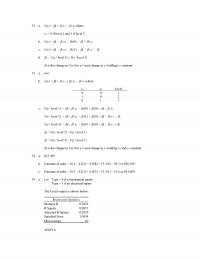
32. a. E(y) = + x1 + x2 where x2 = 0 if level 1 and 1 if level 2 33. a. two b. E(y) = + x1 + […]
978-1285867045 Chapter 13 Solution Manual Part 2
10. a. A portion of the Excel output follows. Regression Statistics Multiple R 0.6477 R Square 0.4195 Adjusted R Square 0.3873 Standard Error 0.0603 Observations 20 ANOVA df SS MS F Significance F Regression 1 0.0473 0.0473 13.0099 0.0020 Residual […]
978-1285867045 Chapter 13 Solution Manual Part 1
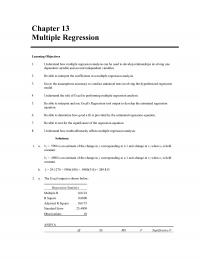
Chapter 13 Multiple Regression Learning Objectives 1. Understand how multiple regression analysis can be used to develop relationships involving one dependent variable and several independent variables. 2. Be able to interpret the coefficients in a multiple regression analysis. 3. Know […]
978-1285867045 Chapter 13 Case
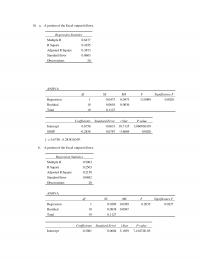
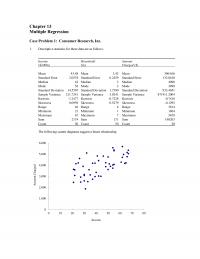
Chapter 13 Multiple Regression Case Problem 1: Consumer Research, Inc. 1. Descriptive statistics for these data are as follows: Income ($1000s) Household Size Amount Charged ($) Mean 43.48 Mean 3.42 Mean 3964.06 Standard Error 2.0578 Standard Error 0.2459 Standard Error […]
978-1285867045 Chapter 12 Solution Manual Part 5
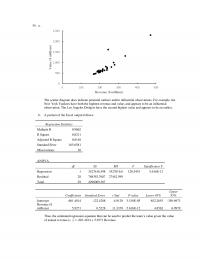
54. a. The scatter diagram does indicate potential outliers and/or influential observations. For example, the b. A portion of the Excel output follows: New York Yankees have both the hightest revenue and value, and appears to be an influential observation. […]
978-1285867045 Chapter 12 Solution Manual Part 4
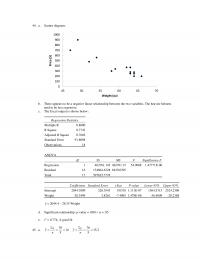
44. a. Scatter diagram: b. There appears to be a negative linear relationship between the two variables. The heavier helmets tend to be less expensive. c. The Excel output is shown below: Regression Statistics Multiple R 0.8800 R Square 0.7743 […]
978-1285867045 Chapter 12 Solution Manual Part 3
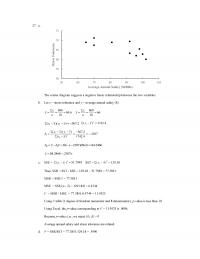
27. a. The scatter diagram suggests a negative linear relationship between the two variables. b. Let x = stress tolerance and y = average annual salary ($) 866 660 86.6 66 10 10 ii xy xy nn = = […]
978-1285867045 Chapter 12 Solution Manual Part 2
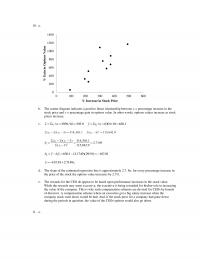
10. a. b. The scatter diagram indicates a positive linear relationship between x = percentage increase in the stock price and y = percentage gain in options value. In other words, options values increase as stock prices increase. c. / […]
978-1285867045 Chapter 12 Solution Manual Part 1
Chapter 12 Simple Linear Regression Learning Objectives 1. Understand how regression analysis can be used to develop an equation that estimates mathematically how two variables are related. 2. Understand the differences between the regression model, the regression equation, and the […]
978-1285867045 Chapter 12 Case
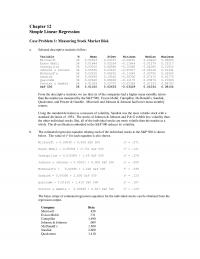
Chapter 12 Simple Linear Regression Case Problem 1: Measuring Stock Market Risk a. Selected descriptive statistics follow: Variable N Mean StDev Minimum Median Maximum Microsoft 36 0.00503 0.04537 -0.08201 0.00400 0.08883 Exxon Mobil 36 0.01664 0.05534 -0.11646 0.01279 0.23217 Caterpillar […]
978-1285867045 Chapter 11 Solution Manual Part 3
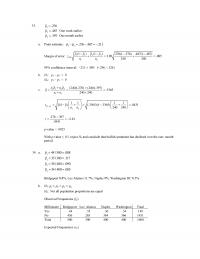
33. 1.276p= 2.487p= One week earlier 3.397p= One month earlier a. Point estimate: 12 .276 .487 .211pp− = − = − Margin of error: .025 12 1.96 .085 240 240 znn + = + = 95% confidence interval: -.211 ± […]
978-1285867045 Chapter 11 Solution Manual Part 2
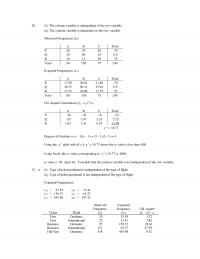
20. H0: The column variable is independent of the row variable Ha: The column variable is dependent on the row variable Observed Frequencies (fij) A B C Total P 20 30 20 70 Q 30 60 25 115 R 10 […]
978-1285867045 Chapter 11 Solution Manual Part 1
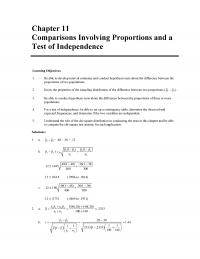
Chapter 11 Comparisons Involving Proportions and a Test of Independence Learning Objectives 1. Be able to develop interval estimates and conduct hypothesis tests about the difference between the proportions of two populations. 2. Know the properties of the sampling distribution […]
978-1285867045 Chapter 11 Case
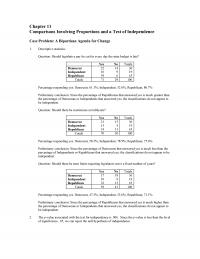
Chapter 11 Comparisons Involving Proportions and a Test of Independence Case Problem: A Bipartisan Agenda for Change 1. Descriptive statistics Question: Should legislative pay be cut for every day the state budget is late? Yes No Totals Democrat 22 14 […]
978-1285867045 Chapter 10 Solution Manual Part 3
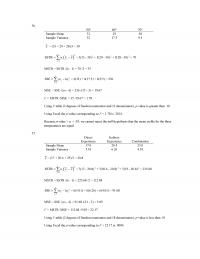
36. MSTR = SSTR /(k – 1) = 70 /2 = 35 2 1 SSE ( 1) k jj j ns = =− = 4(32) + 4(17.5) + 4(9.5) = 236 MSE = SSE /(nT – k) = 236 […]
978-1285867045 Chapter 10 Solution Manual Part 2
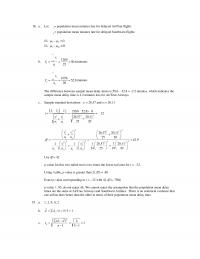
18. a. Let m 1 = population mean minutes late for delayed AirTran flights m 2 = population mean minutes late for delayed Southwest flights H0: 12 0 −= Ha: 1 22 0 − b. x1=xi i=1 n […]
978-1285867045 Chapter 10 Solution Manual Part 1
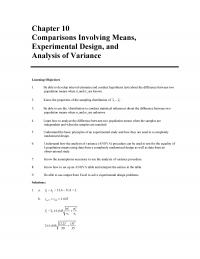
Chapter 10 Comparisons Involving Means, Experimental Design, and Analysis of Variance Learning Objectives 1. Be able to develop interval estimates and conduct hypothesis tests about the difference between two population means when 1 and 2 are known. 2. […]
978-1285867045 Chapter 10 Case
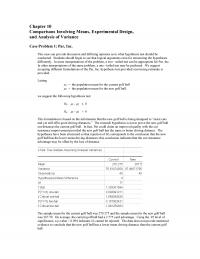
Chapter 10 Comparisons Involving Means, Experimental Design, and Analysis of Variance Case Problem 1: Par, Inc. This case can provide discussion and differing opinions as to what hypothesis test should be conducted. Students should begin to see that logical arguments […]
978-1285867045 Chapter 1 Solution Manual
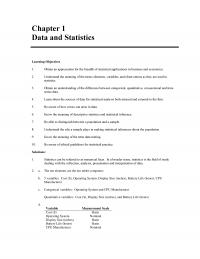
Chapter 1 Data and Statistics Learning Objectives 1. Obtain an appreciation for the breadth of statistical applications in business and economics. 2. Understand the meaning of the terms elements, variables, and observations as they are used in statistics. 3. Obtain […]
978-1260153590 Chapter 9 Solutions Manual Part 2
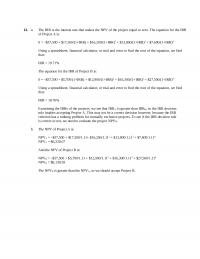
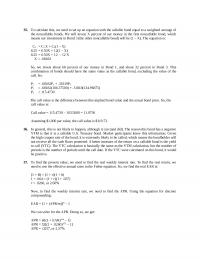
12. a. The IRR is the interest rate that makes the NPV of the project equal to zero. The equation for the IRR of Project A is: Using a spreadsheet, financial calculator, or trial and error to find the root […]
978-1260153590 Chapter 9 Solutions Manual Part 1
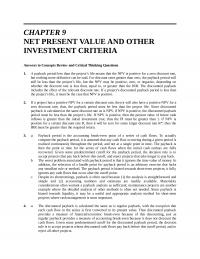
CHAPTER 9 NET PRESENT VALUE AND OTHER INVESTMENT CRITERIA Answers to Concepts Review and Critical Thinking Questions 1. A payback period less than the project’s life means that the NPV is positive for a zero discount rate, but nothing more […]
978-1260153590 Chapter 9 Case Solutions
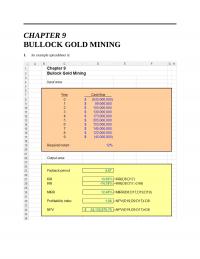
CHAPTER 9 BULLOCK GOLD MINING 1. An example spreadsheet is: Note, there is no Excel function to directly calculate the payback period. We used “If” statements in our spreadsheet. The IF statement we used is: =IF(-D8>(D9+D10+D11+D12+D13+D14),”Greater than 6 years”,IF(- D8>(D9+D10+D11+D12+D13),(5+(-D8-D9-D10-D11-D12-D13)/D14),IF(- […]
978-1260153590 Chapter 8 Solutions Manual Part 2
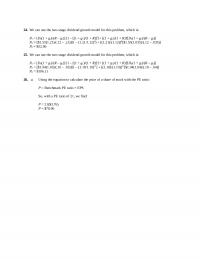
24. We can use the two-stage dividend growth model for this problem, which is: P0 = [D0(1 + g1)/(R – g1)]{1 – [(1 + g1)/(1 + R)]t}+ [(1 + g1)/(1 + R)]t[D0(1 + g2)/(R – g2)] 25. We can use […]
978-1260153590 Chapter 8 Solutions Manual Part 1
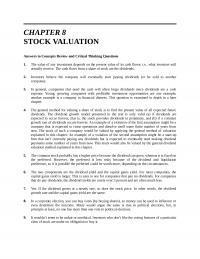
CHAPTER 8 STOCK VALUATION Answers to Concepts Review and Critical Thinking Questions 1. The value of any investment depends on the present value of its cash flows; i.e., what investors will 2. Investors believe the company will eventually start paying […]
978-1260153590 Chapter 8 Case Solutions
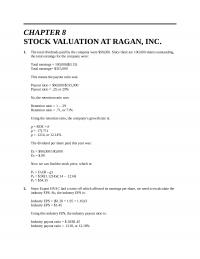
CHAPTER 8 STOCK VALUATION AT RAGAN, INC. 1. The total dividends paid by the company were $90,000. Since there are 100,000 shares outstanding, the total earnings for the company were: This means the payout ratio was: Payout ratio = $90,000/$315,000 […]
978-1260153590 Chapter 7 Solutions Manual Part 3
35. To calculate this, we need to set up an equation with the callable bond equal to a weighted average of the noncallable bonds. We will invest X percent of our money in the first noncallable bond, which means our […]
978-1260153590 Chapter 7 Solutions Manual Part 2
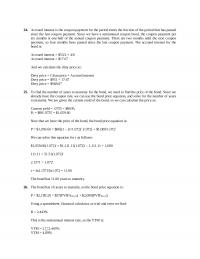
24. Accrued interest is the coupon payment for the period times the fraction of the period that has passed since the last coupon payment. Since we have a semiannual coupon bond, the coupon payment per And we calculate the dirty […]
978-1260153590 Chapter 7 Solutions Manual Part 1
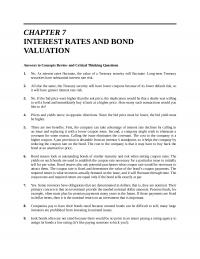
CHAPTER 7 INTEREST RATES AND BOND VALUATION Answers to Concepts Review and Critical Thinking Questions 2. All else the same, the Treasury security will have lower coupons because of its lower default risk, so it will have greater interest rate […]

978-1260153590 Chapter 7 Case Solutions
CHAPTER 7 FINANCING S&S AIR’S EXPANSION PLANS WITH A BOND ISSUE A rule of thumb with bond provisions is to determine who benefits by the provision. If the company benefits, the bond will have a higher coupon rate. If the […]