Archives: Quiz
Economics Chapter 8 4 Predictions Marginal Utility Theory Demand Curve skill
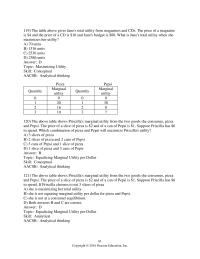
Copyright © 2016 Pearson Education, Inc. 119) The table above gives Jane’s total utility from magazines and CDs. The price of a magazine is $4 and the price of a CD is $10 and Jane’s budget is $88. What is […]
Economics Chapter 8 3 not change his current bundle of movies and pizza
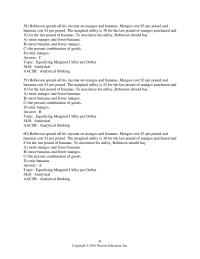
Copyright © 2016 Pearson Education, Inc. 58) Robinson spends all his income on mangos and bananas. Mangos cost $3 per pound and bananas cost $1 per pound. The marginal utility is 30 for the last pound of mangos purchased and […]
Economics Chapter 8 2 Mary Will Consume Soda And Only Chips
Copyright © 2016 Pearson Education, Inc. 68) The table above gives Jane’s total utility from magazines and CDs. The price of a magazine is $4 and the price of a CD is $10. Which of the following CORRECTLY illustrates the […]
Economics Chapter 8 1 Diminishing Marginal Utility skill Conceptual Reflective
Copyright © 2016 Pearson Education, Inc. Microeconomics, 12e (Parkin) Chapter 8 Utility and Demand 1 Consumption Choices 1) Suppose Jill’s consumption bundle is made up of 2 goods, apples and bottles of juice. If the price of an apple increases, […]
Economics Chapter 7 3 Comparative Advantage skill Concept Written And Oral Communication 2
Copyright © 2016 Pearson Education, Inc. 35) A tariff hurts A) the government by decreasing its revenue. B) domestic producers who can’t compete with cheaper imports. C) consumers who pay more for the imported good. D) All of the above […]
Economics Chapter 7 2 The Case Against Protection skill Concept Ethical
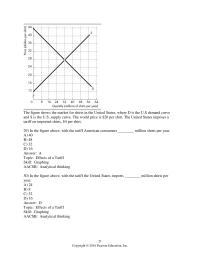
Copyright © 2016 Pearson Education, Inc. The figure shows the market for shirts in the United States, where D is the U.S demand curve and S is the U.S. supply curve. The world price is $20 per shirt. The United […]
Economics Chapter 7 1 The United States Trades Helicopters With The rest
Copyright © 2016 Pearson Education, Inc. Microeconomics, 12e (Parkin) Chapter 7 Global Markets in Action 1 How Global Markets Work 1) Which of the following is CORRECT? A) Both imports and exports include goods and services. B) Imports includes both […]
Economics Chapter 6 8 The Elasticity Supply Labor Low
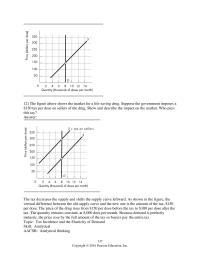
Copyright © 2016 Pearson Education, Inc. 12) The figure above shows the market for a life-saving drug. Suppose the government imposes a $150 tax per dose on sellers of the drug. Show and describe the impact on the market. Who […]
Economics Chapter 6 7 Once the tax is imposed in the market, the buyers
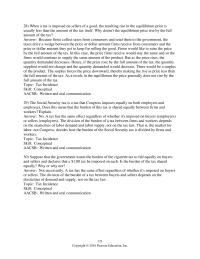
Copyright © 2016 Pearson Education, Inc. 28) When a tax is imposed on sellers of a good, the resulting rise in the equilibrium price is usually less than the amount of the tax itself. Why doesn’t the equilibrium price rise […]
Economics Chapter 6 6 Soviet Union But Are Still Present In north
Copyright © 2016 Pearson Education, Inc. 18) When a good is made illegal, which of the following definitely results in the price rising? A) a much higher fine on sellers than on buyers B) a much higher fine on buyers […]
Economics Chapter 6 5 The government imposes the sales tax shown in the figure
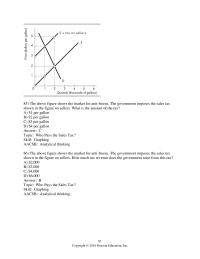
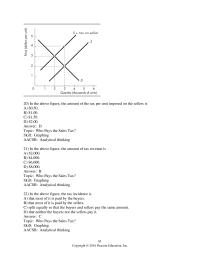
Copyright © 2016 Pearson Education, Inc. 85) The above figure shows the market for anti-freeze. The government imposes the sales tax shown in the figure on sellers. What is the amount of the tax? A) $1 per gallon B) $2 […]
Economics Chapter 6 1 Conceptual Reflective Thinking rent dollars
Copyright © 2016 Pearson Education, Inc. Microeconomics, 12e (Parkin) Chapter 6 Government Actions in Markets 1 A Housing Market with a Rent Ceiling 1) A price ceiling is a price A) below which a seller cannot legally sell. B) above […]
Economics Chapter 6 2 The Minimum Wage skill
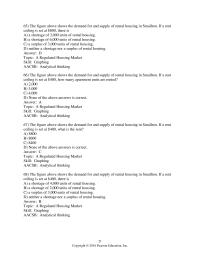
Copyright © 2016 Pearson Education, Inc. 65) The figure above shows the demand for and supply of rental housing in Smallton. If a rent ceiling is set at $800, there is A) a shortage of 3,000 units of rental housing. […]
Economics Chapter 6 4 In the above figure, the amount of the tax per unit imposed
Copyright © 2016 Pearson Education, Inc. 20) In the above figure, the amount of the tax per unit imposed on the sellers is A) $0.50. B) $1.00. C) $1.50. D) $2.00. Answer: D Topic: Who Pays the Sales Tax? Skill: […]
Economics Chapter 6 3 Market Intervention skill Graphing Analytical Thinking The Above
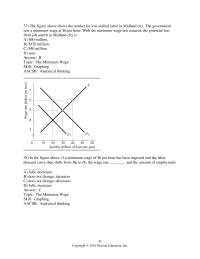
Copyright © 2016 Pearson Education, Inc. 37) The figure above shows the market for low-skilled labor in Midland city. The government sets a minimum wage at $6 per hour. With the minimum wage law enacted, the potential loss from job […]
Economics Chapter 5 8 Because She The Only Tutor She Has
Copyright © 2016 Pearson Education, Inc. 10) Jason hires Maria to tutor him in economics. Jason is willing to pay $30 for the first hour of tutoring, $25 for the second, $20 for the third, $15 for the fourth, and […]
Economics Chapter 5 9 What Is the Minimum Price That Producers Are
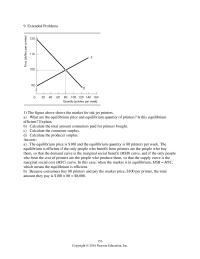
Copyright © 2016 Pearson Education, Inc. 9 Extended Problems 1) The figure above shows the market for ink-jet printers. a) What are the equilibrium price and equilibrium quantity of printers? Is this equilibrium efficient? Explain. b) Calculate the total amount […]
Economics Chapter 5 7 Subsidies Have The Opposite Effect Decreasing The
Copyright © 2016 Pearson Education, Inc. 16) The annual Great Sofa Round-up is a collaborative event between Colorado State University and the City of Fort Collins aims to help students and neighbors get rid of unwanted furniture, while giving people […]
Economics Chapter 5 6 The figure shows the competitive market for milk
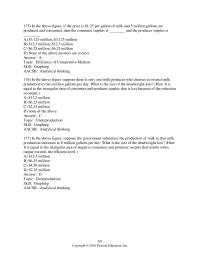
Copyright © 2016 Pearson Education, Inc. 175) In the above figure, if the price is $1.25 per gallon of milk and 5 million gallons are produced and consumed, then the consumer surplus is ________ and the producer surplus is ________. […]
Economics Chapter 5 5 The Price That Producers Must
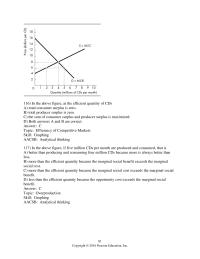
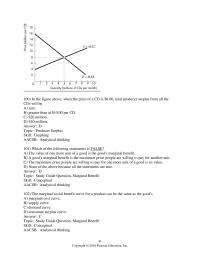
Copyright © 2016 Pearson Education, Inc. 116) In the above figure, at the efficient quantity of CDs A) total consumer surplus is zero. B) total producer surplus is zero. C) the sum of consumer surplus and producer surplus is maximized. […]
Economics Chapter 5 4 Neither Nor Correct answer topic Over production skill
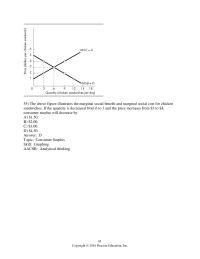
Copyright © 2016 Pearson Education, Inc. 55) The above figure illustrates the marginal social benefit and marginal social cost for chicken sandwiches. If the quantity is decreased from 6 to 3 and the price increases from $3 to $4, consumer […]
Economics Chapter 5 3 Efficiency And Inefficiency skill Conceptual
Copyright © 2016 Pearson Education, Inc. 100) In the figure above, when the price of a CD is $8.00, total producer surplus from all the CDs will be A) zero. B) greater than at $10.00 per CD. C) $20 million. […]
Economics Chapter 5 2 Atopic Market Supply skill Analytical
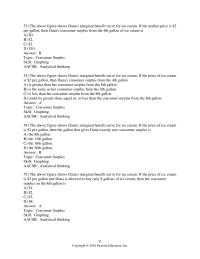
Copyright © 2016 Pearson Education, Inc. 52) The above figure shows Dana’s marginal benefit curve for ice cream. If the market price is $2 per gallon, then Dana’s consumer surplus from the 4th gallon of ice cream is A) $0. […]
Economics Chapter 5 1 Value Willingness Pay And Demand skill Concept
Copyright © 2016 Pearson Education, Inc. Microeconomics, 12e (Parkin) Chapter 5 Efficiency and Equity 1 Resource Allocation Methods 1) In the United States, resources are most often allocated by A) market price. B) command system. C) lottery. D) contest. Answer: […]
Economics Chapter 4 9 Therefore The Drivers Should Try To lower The
Copyright © 2016 Pearson Education, Inc. 3) When we calculate the price elasticity of demand, we use percentages of the average price and the average quantity in order to get the same value for the elasticity regardless of whether the […]
Economics Chapter 4 8 When The Price Elasticity Demand 06 Percent
Copyright © 2016 Pearson Education, Inc. 2) If the price of suntan lotion increases from $6 to $8 per bottle and quantity demanded decreases from 900,000 bottles to 845,000 bottles, using the midpoint method, what is the price elasticity of […]
Economics Chapter 4 7 Perfectly Elastic Demand skill Concept Reflective
Copyright © 2016 Pearson Education, Inc. 43) Which of the following leads a good to have a high elasticity of supply? I. The good must be produced using unique resources. II. The good is produced using commonly available resources. A) […]
Economics Chapter 4 6 Calculating The Elasticity Supply skill Definition
Copyright © 2016 Pearson Education, Inc. 78) If your annual income rose by 10 percent and you increased your purchases of shoes from 2 pairs to 3 pairs each year, then your demand for shoes is A) income inelastic and […]
Economics Chapter 4 5 True The Cross Elasticity Demand Between Spinach
Copyright © 2016 Pearson Education, Inc. 257) In the summer 2012 the lobster catch in Maine was especially large, but instead of celebrating the fisherman were suffering from a lower total revenue. (Source: New York Times, July 28, 2012) We […]
Economics Chapter 4 4 The Short run Demand For Their Service Less
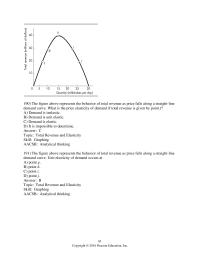
Copyright © 2016 Pearson Education, Inc. 190) The figure above represents the behavior of total revenue as price falls along a straight-line demand curve. What is the price elasticity of demand if total revenue is given by point f? A) […]
Economics Chapter 4 3 You Can Conclude That the Demand For Monica
Copyright © 2016 Pearson Education, Inc. 132) Producers’ total revenue will increase if A) income increases and the good is an inferior good. B) the price rises and demand is elastic. C) the price rises and demand is inelastic. D) […]
Economics Chapter 4 2 Elasticity Along Straight line Demand Curve skill
Copyright © 2016 Pearson Education, Inc. 72) Marvin loves chocolate truffles. As the price of a chocolate truffle increases from $1 to $2 to $3, Marvin continues to buy a dozen chocolate truffles every week. Marvin’s demand for chocolate truffles […]
Economics Chapter 4 1 Pearson Education Fall The Price Lemons
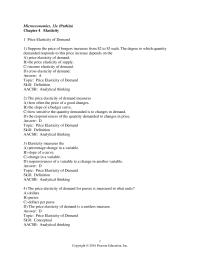
Copyright © 2016 Pearson Education, Inc. Microeconomics, 12e (Parkin) Chapter 4 Elasticity 1 Price Elasticity of Demand 1) Suppose the price of burgers increases from $2 to $3 each. The degree to which quantity demanded responds to this price increase […]
Economics Chapter 3 8 If there is a surplus, how much is the surplus?
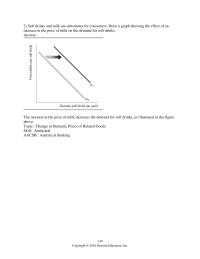
Copyright © 2016 Pearson Education, Inc. 2) Soft drinks and milk are substitutes for consumers. Draw a graph showing the effect of an increase in the price of milk on the demand for soft drinks. 139 Answer: The increase in […]
Economics Chapter 3 7 In the figure, the equilibrium price is initially
Copyright © 2016 Pearson Education, Inc. 141) In the above figure, if D2 is the demand curve, then a price of P3 would result in A) a shortage of Q3 – Q1. B) a shortage of Q4 – Q3. C) […]
Economics Chapter 3 6 increase the number of computers bought
Copyright © 2016 Pearson Education, Inc. 88) In 2014, the price of peanuts was rising, which lead peanut butter sellers and peanut butter buyers to expect the price of peanut butter would rise in the future. In the current market […]
Economics Chapter 3 5 The Equilibrium Price Falls Because The Supply
Copyright © 2016 Pearson Education, Inc. 14) If the demand for hamburgers decreases, the equilibrium price A) rises and the equilibrium quantity increases. B) falls and the equilibrium quantity increases. C) rises and the equilibrium quantity decreases. D) falls and […]
Economics Chapter 3 4 Price Adjustments Shortage skill Concept
Copyright © 2016 Pearson Education, Inc. 75) The wage rate paid by Walkman producers falls and at the same time the price of raw materials used in the production of Walkmans rises. You predict that the supply curve of Walkmans […]
Economics Chapter 3 3 Change Supply skill Concept Analytical Thinking
Copyright © 2016 Pearson Education, Inc. 6) The “law of supply” states that, other things remaining the same, firms produce A) more of a good the less it costs to produce it. B) less of a good the more it […]
Economics Chapter 3 2 Change The Quantity Demanded Versus Change
Copyright © 2016 Pearson Education, Inc. 62) If income decreases or the price of a complement rises A) the demand curve for a normal good shifts leftward. B) the demand curve for a normal good shifts rightward. C) there is […]
Economics Chapter 3 1 Atopic Demand Substitution Effect
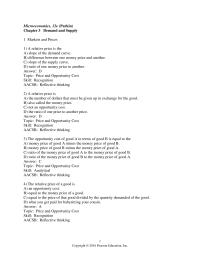
Copyright © 2016 Pearson Education, Inc. Microeconomics, 12e (Parkin) Chapter 3 Demand and Supply 1 Markets and Prices 1) A relative price is the A) slope of the demand curve. B) difference between one money price and another. C) slope […]
Economics Chapter 2 7 Increasing Opportunity Cost skill Concept Written And Oral
Copyright © 2016 Pearson Education, Inc. 14) A computer software program is most strongly an example of A) real property. B) fiat property. C) intellectual property. D) vicarious property. Answer: C Topic: Property Rights Skill: Analytical AACSB: Reflective thinking 15) […]
Economics Chapter 2 9 What The Marginalcost The 3000th Bottle Wine
Copyright © 2016 Pearson Education, Inc. 2) If a country operates on its PPF, it achieves production efficiency. Answer: TRUE Topic: Production Possibilities and Opportunity Costs Skill: Recognition AACSB: Reflective thinking 3) Moving downward along a PPF, the opportunity cost […]
Economics Chapter 2 8 John Who Can Fix Only Per Day
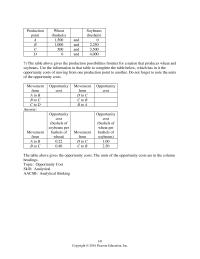
Copyright © 2016 Pearson Education, Inc. Production point Wheat (bushels) Soybeans (bushels) A 1,500 and 0 B 1,000 and 2,250 C 500 and 3,500 D 0 and 4,000 7) The table above gives the production possibilities frontier for a nation […]
Economics Chapter 2 6 Agnes can produce either 1 unit of X or 1 unit
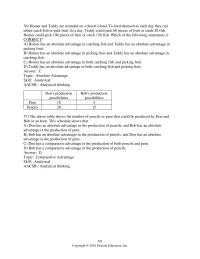
Copyright © 2016 Pearson Education, Inc. 36) Homer and Teddy are stranded on a desert island. To feed themselves each day they can either catch fish or pick fruit. In a day, Teddy could pick 60 pieces of fruit or […]
Economics Chapter 2 2 The above table shows production combinations
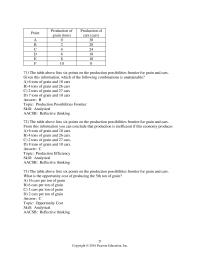
Copyright © 2016 Pearson Education, Inc. Point Production of grain (tons) Production of cars (cars) A 0 30 B 2 28 C 4 24 D 6 18 E 8 10 F 10 0 71) The table above lists six points […]
Economics Chapter 2 1 shows how many goods and services are consumed by
Copyright © 2016 Pearson Education, Inc. Microeconomics, 12e (Parkin) Chapter 2 The Economic Problem 1 Production Possibilities and Opportunity Cost 1) The production possibilities frontier is the boundary between A) those combinations of goods and services that can be produced […]
Economics Chapter 2 5 In the above figure, in order for this country to move from
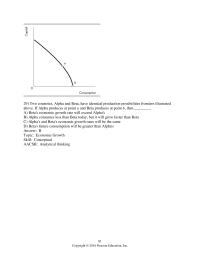
Copyright © 2016 Pearson Education, Inc. 29) Two countries, Alpha and Beta, have identical production possibilities frontiers illustrated above. If Alpha produces at point a and Beta produces at point b, then ________. A) Beta’s economic growth rate will exceed […]
Economics Chapter 2 4 Use Resources skill Analytical
Copyright © 2016 Pearson Education, Inc. 25) A marginal benefit curve shows A) the efficient use of resources. B) the quantity of one good that must be forgone to get more of another good. C) the quantity of one good […]
Economics Chapter 2 3 Atopic Parallel My Questions Production Possibilities Frontier skill
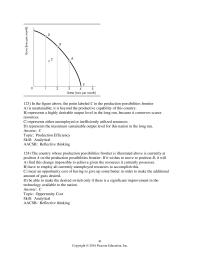
Copyright © 2016 Pearson Education, Inc. 123) In the figure above, the point labeled C in the production possibilities frontier A) is unattainable; it is beyond the productive capability of this country. B) represents a highly desirable output level in […]