25) A marginal benefit curve shows
A) the efficient use of resources.
B) the quantity of one good that must be forgone to get more of another good.
C) the quantity of one good that people are willing to forgo to get another unit of another good.
D) there are increasing opportunity costs.
26) Marginal benefit curves slope
A) upward because of increasing opportunity cost.
B) upward, but not because of increasing opportunity cost.
C) downward because of increasing opportunity cost.
D) downward, but not because of increasing opportunity cost.
27) Marginal benefit curves slope ________ and marginal cost curves slope ________.
A) upward; upward
B) upward; downward
C) downward; downward
D) downward; upward
28) Suppose that the government is trying to decide between allocating its resources to build
more dams or to build more freeways. In terms of forgone dams, as more freeways are
constructed, the marginal benefit of additional freeways ________ and the marginal cost of
additional freeways ________.
A) increases; increases
B) increases; decreases
C) decreases; increases
D) decreases; decreases
Television
sets (millions
per year)
Willingness to
pay
(computers per
television set)
1
2.5
2
2.0
3
1.5
4
1.0
5
0.5
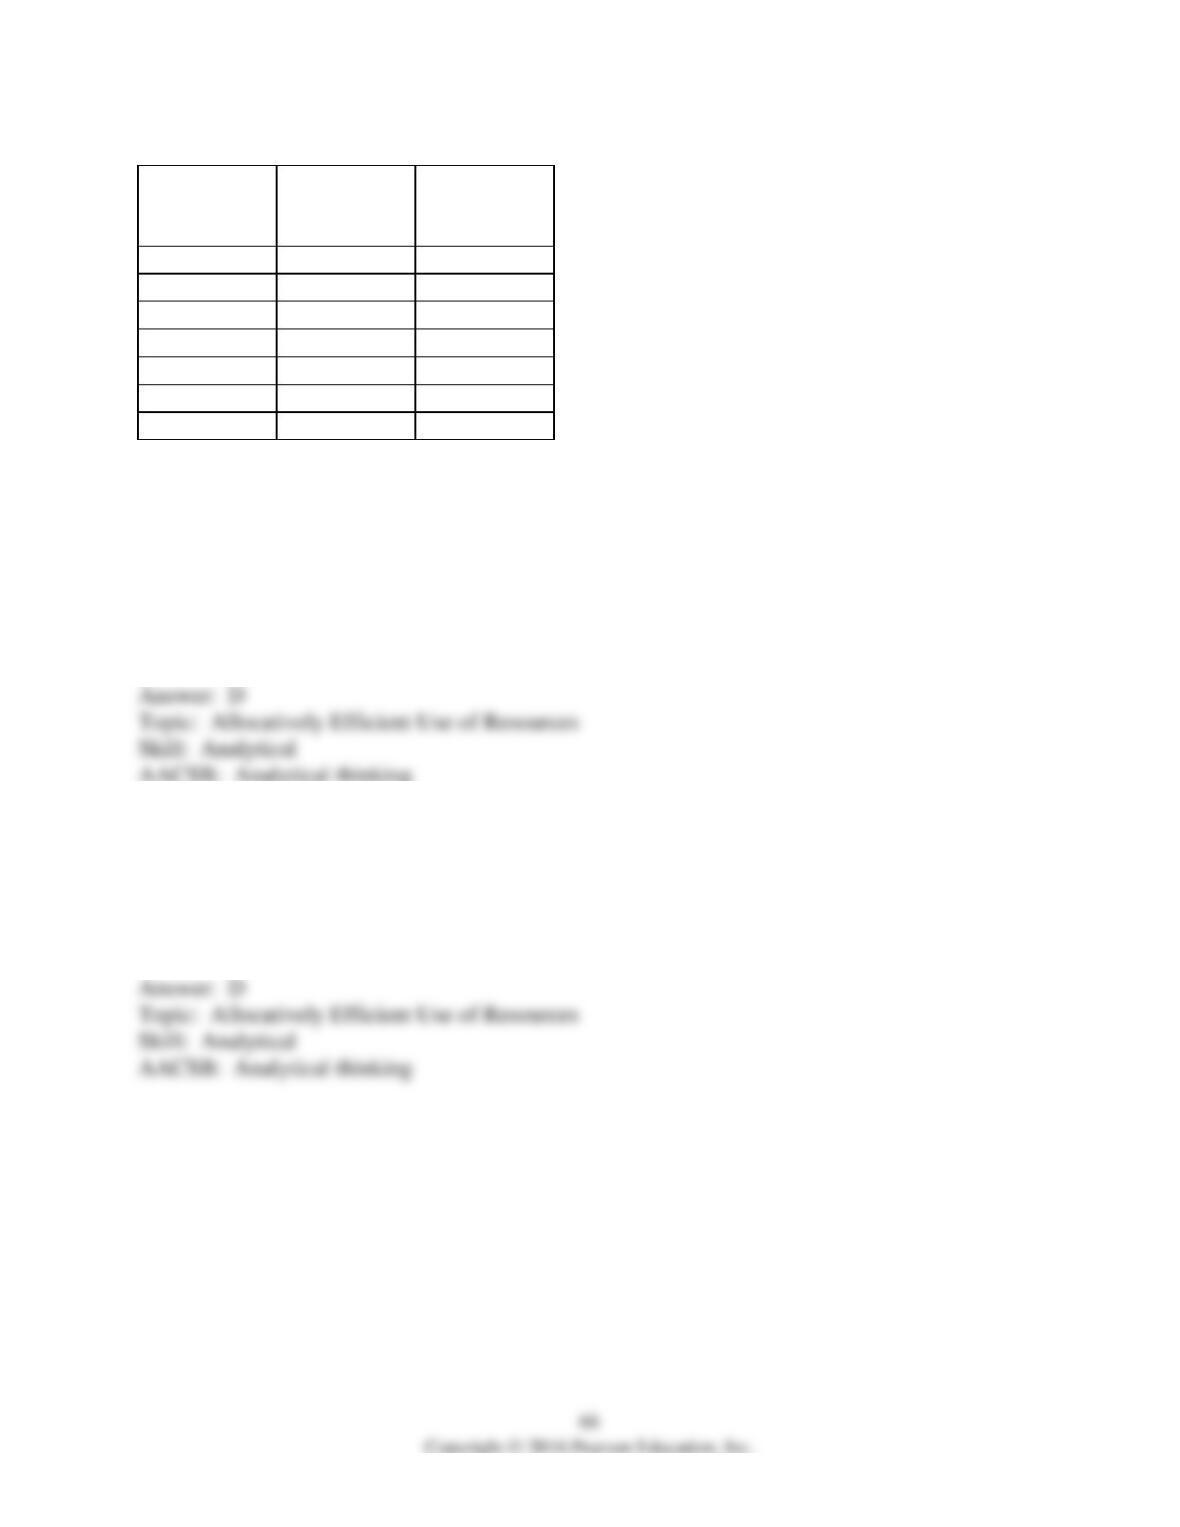
29) In the table above, the marginal benefit of the 4 millionth television set is
A) negative 0.5 computers per television set.
B) 0.25 computers per television set.
C) 0.5 computers per television set.
D) 1.0 computer per television set.
30) Resource use is allocatively efficient when
A) we produce the goods with the highest opportunity cost.
B) we produce the goods with the lowest opportunity cost.
C) we cannot produce more goods and services.
D) we produce the amount of the different goods we value most highly.
31) When we cannot produce more of any good without giving up some other good that we value
more highly, we have achieved
A) production.
B) equity.
C) allocative efficiency.
D) the production point where the marginal benefit exceeds the marginal cost by as much as
possible.
32) If the marginal benefit of a good exceeds its marginal cost
A) we’ve achieved efficient resource use.
B) we should produce more to achieve the allocatively efficient use of resources.
C) we should produce less to achieve the allocatively efficient use of resources.
D) we cannot tell if more or less should be produced to achieve the allocatively efficient use of
resources.
33) When an economy produces at its allocatively efficient production point
A) scarcity is not a problem.
B) resources are not limited.
C) a society can increase the production of all goods.
D) a society can increase the production of one good only by decreasing the production of some
other good that is valued more highly.
34) Allocative efficiency occurs when
A) we cannot produce more of any good without giving up some other good that we value more
highly.
B) we cannot produce more of any one good without giving up some other good.
C) marginal benefit exceeds marginal cost.
D) opportunity costs are decreasing.
35) Allocative efficiency occurs when it is
A) possible to produce more of one good without giving up the production of some other good.
B) possible to produce more of all goods.
C) not possible to produce more of one good without giving up the production of some other
good that is valued less highly.
D) not possible to produce more of one good without giving up the production of some other
good that is valued more highly.
36) An efficient allocation of resources occurs when we
A) produce the goods and services that people need.
B) cannot produce more of a good or service without giving up some other good or service that
we value more highly.
C) produce the goods and services that people want.
D) cannot produce more of a good or service without giving up some other good or service that
we need.
37) Which of the following statements can used to describe efficiency?
I. Efficiently using resources means that producers make the highest profits possible.
II. Using resources efficiently means that we cannot produce more of one good without
producing less of another good that has a higher value.
III. Resource use is efficient when we produce goods and services that people value most highly.
A) I only
B) I and II
C) II and III
D) I, II and III
38) Resource use is allocatively efficient when marginal benefit is
A) greater than marginal cost.
B) equal to marginal cost.
C) less than marginal cost.
D) at its maximum value.
39) Resource use is allocatively efficient
A) when marginal benefit equals marginal cost.
B) whenever marginal benefit exceeds marginal cost.
C) whenever marginal cost exceeds marginal benefit.
D) when the maximum possible quantity is being produced.
40) Resource use is allocatively efficient if the
A) total cost of what the resource produces is less than the total benefit of what is produced.
B) total cost of what the resource produces is equal to the total benefit of what is produced.
C) marginal benefit of what the resource produces has diminished to zero.
D) marginal cost of what the resource produces is equal to the marginal benefit of what is
produced.
41) A country produces only pencils and erasers. Pencil production is allocatively efficient if the
marginal ________ of a pencil equals the marginal ________ of ________.
A) cost; benefit; an eraser
B) cost; cost; an eraser
C) benefit; benefit; an eraser
D) benefit; cost; a pencil
42) If the marginal benefit of consuming another unit of a good is positive, then to reach the
allocatively efficient level of output more of the good should be produced and consumed
A) no matter what.
B) as long as the consumer can afford to pay for it.
C) if the total benefit of the good is greater than its total cost.
D) if the marginal benefit of the good is greater than its marginal cost.
Quantity
(pizzas per
day)
Marginal
benefit
(cans per day)
Marginal cost
(cans per day)
10
26
14
20
24
16
30
22
18
40
20
20
50
18
22
60
16
24
70
14
26
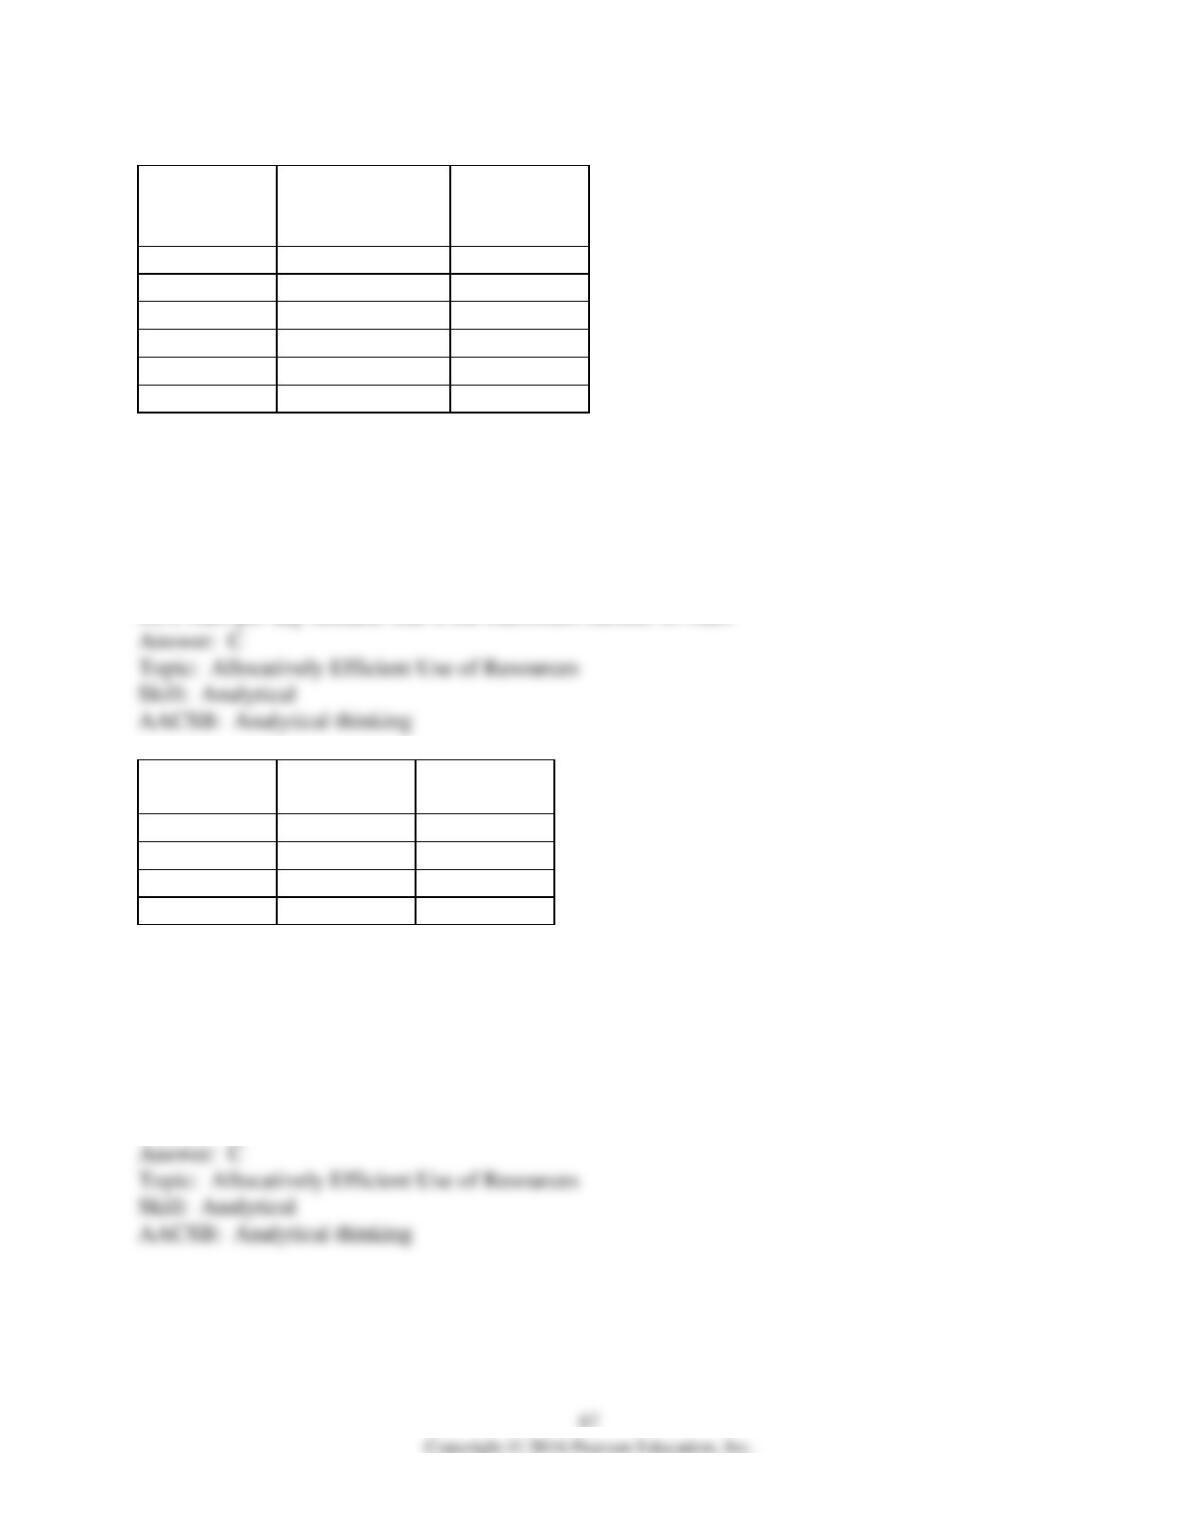
43) The table above shows the marginal benefit from pizza and the marginal cost of pizza in cans
of soda forgone. If ________ pizzas are produced, the quantity of soda that people are willing to
give up to get an additional pizza is more than the quantity of soda that they must give up to get
that additional pizza.
A) any quantity other than 40
B) 40
C) more than 40
D) fewer than 40
44) The table above shows the marginal benefit from pizza and the marginal cost of pizza in cans
of soda forgone. The allocatively efficient quantity of pizza is ________ pizzas per day.
A) 70
B) 10
C) more than 70
D) 40
Camel rides
(per day)
Marginal benefit
(tubes of
sunscreen)
Marginal cost
(tubes of
sunscreen)
1
20
11
2
18
12
3
16
13
4
14
14
5
12
15
6
10
16
45) Leisure Land produces only sun screen and camel rides. The table shows the marginal
benefit and marginal cost schedules for sun screen and camel rides. The allocatively efficient
number of camel rides is ________.
A) 1 ride per day because the marginal benefit exceeds the marginal cost by as much as possible
B) 2 rides per day
C) 4 rides per day
D) 6 rides per day because that is the maximum number of rides
Quantity of
pizza
Marginal
benefit
Marginal cost
5
25
11
6
20
13
7
15
15
8
10
17
46) The table above represents the marginal cost and marginal benefit associated with pizza (in
terms of movies). What quantity of pizza should be produced if resources are to be used
efficiently?
A) 5 pizzas
B) 6 pizzas
C) 7 pizzas
D) 8 pizzas
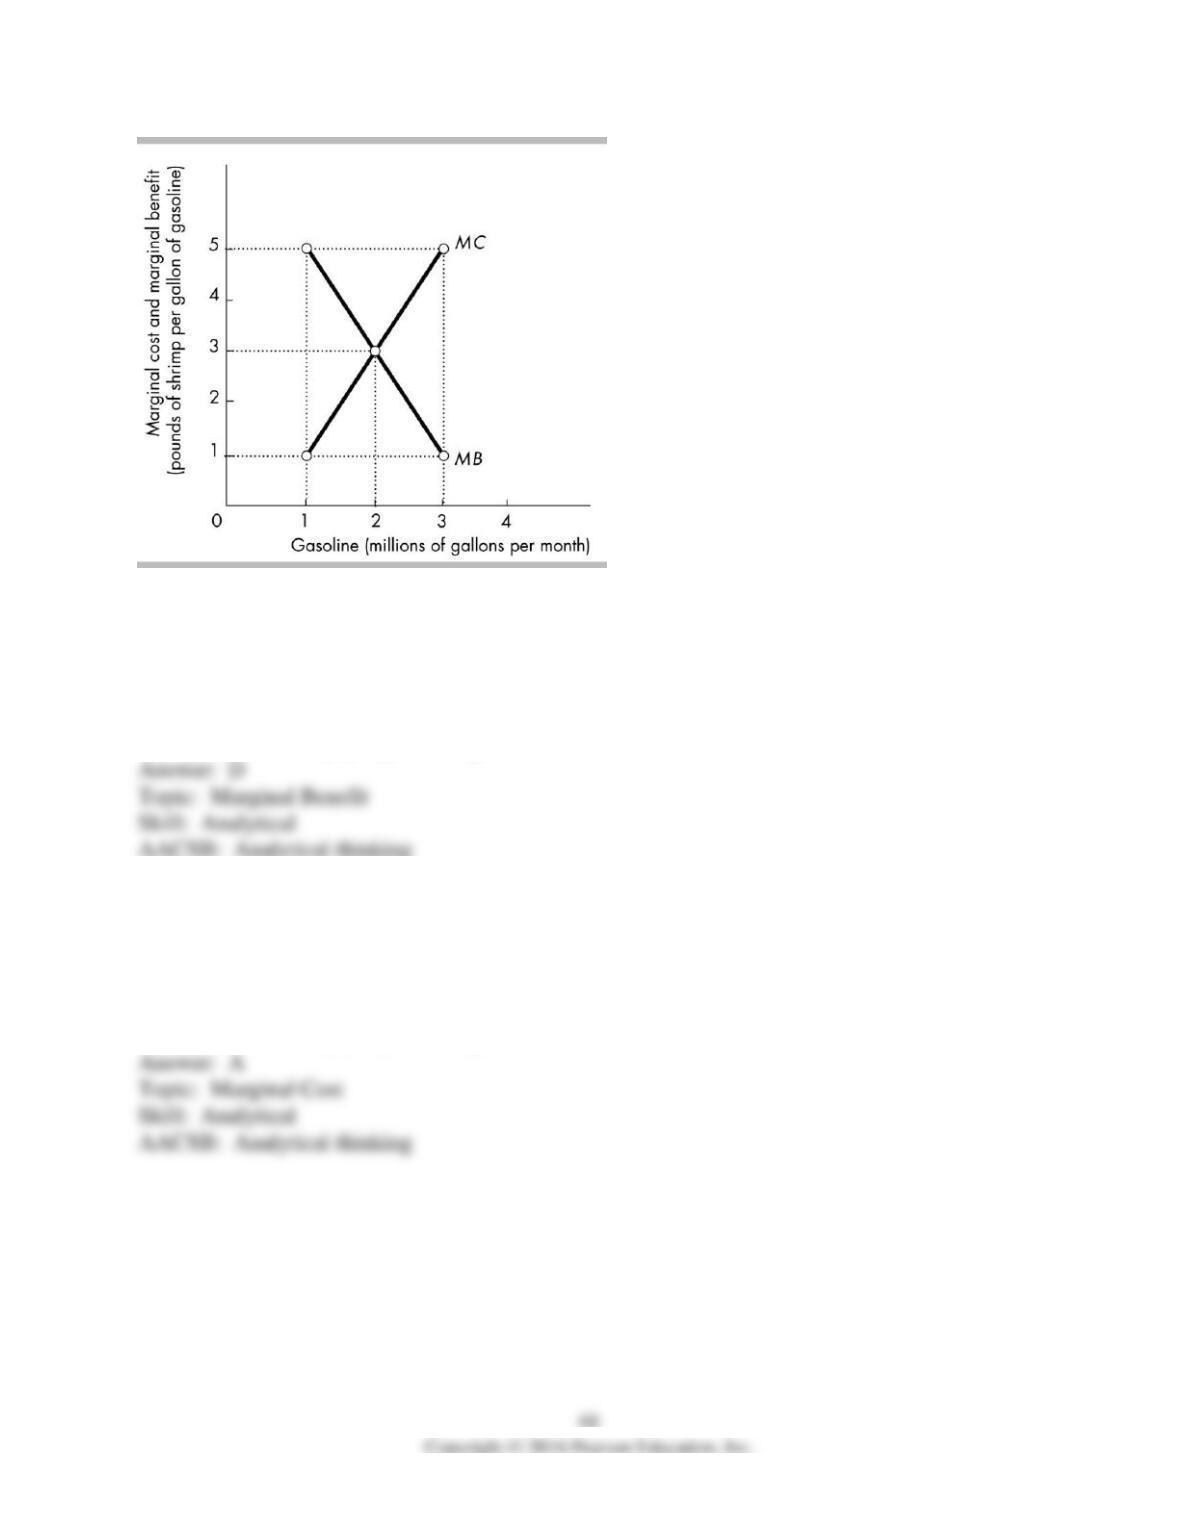
47) According to the diagram in the above figure, what is the marginal benefit of consuming the
3 millionth gallon of gasoline per month?
A) 5 pounds of shrimp per gallon of gasoline
B) 3 pounds of shrimp per gallon of gasoline
C) 2 pounds of shrimp per gallon of gasoline
D) 1 pound of shrimp per gallon of gasoline
48) According to the diagram in the figure above, what is the marginal cost of producing the 3
millionth gallon of gasoline per month?
A) 5 pounds of shrimp per gallon of gasoline
B) 4 pounds of shrimp per gallon of gasoline
C) 3 pounds of shrimp per gallon of gasoline
D) 1 pound of shrimp per gallon of gasoline
49) According to the diagram in the figure above, an allocatively efficient use of resources
requires that production and consumption of gasoline be
A) 1 million gallons of gasoline per month.
B) 2 million gallons of gasoline per month.
C) 3 million gallons of gasoline per month.
D) 4 million gallons of gasoline per month.
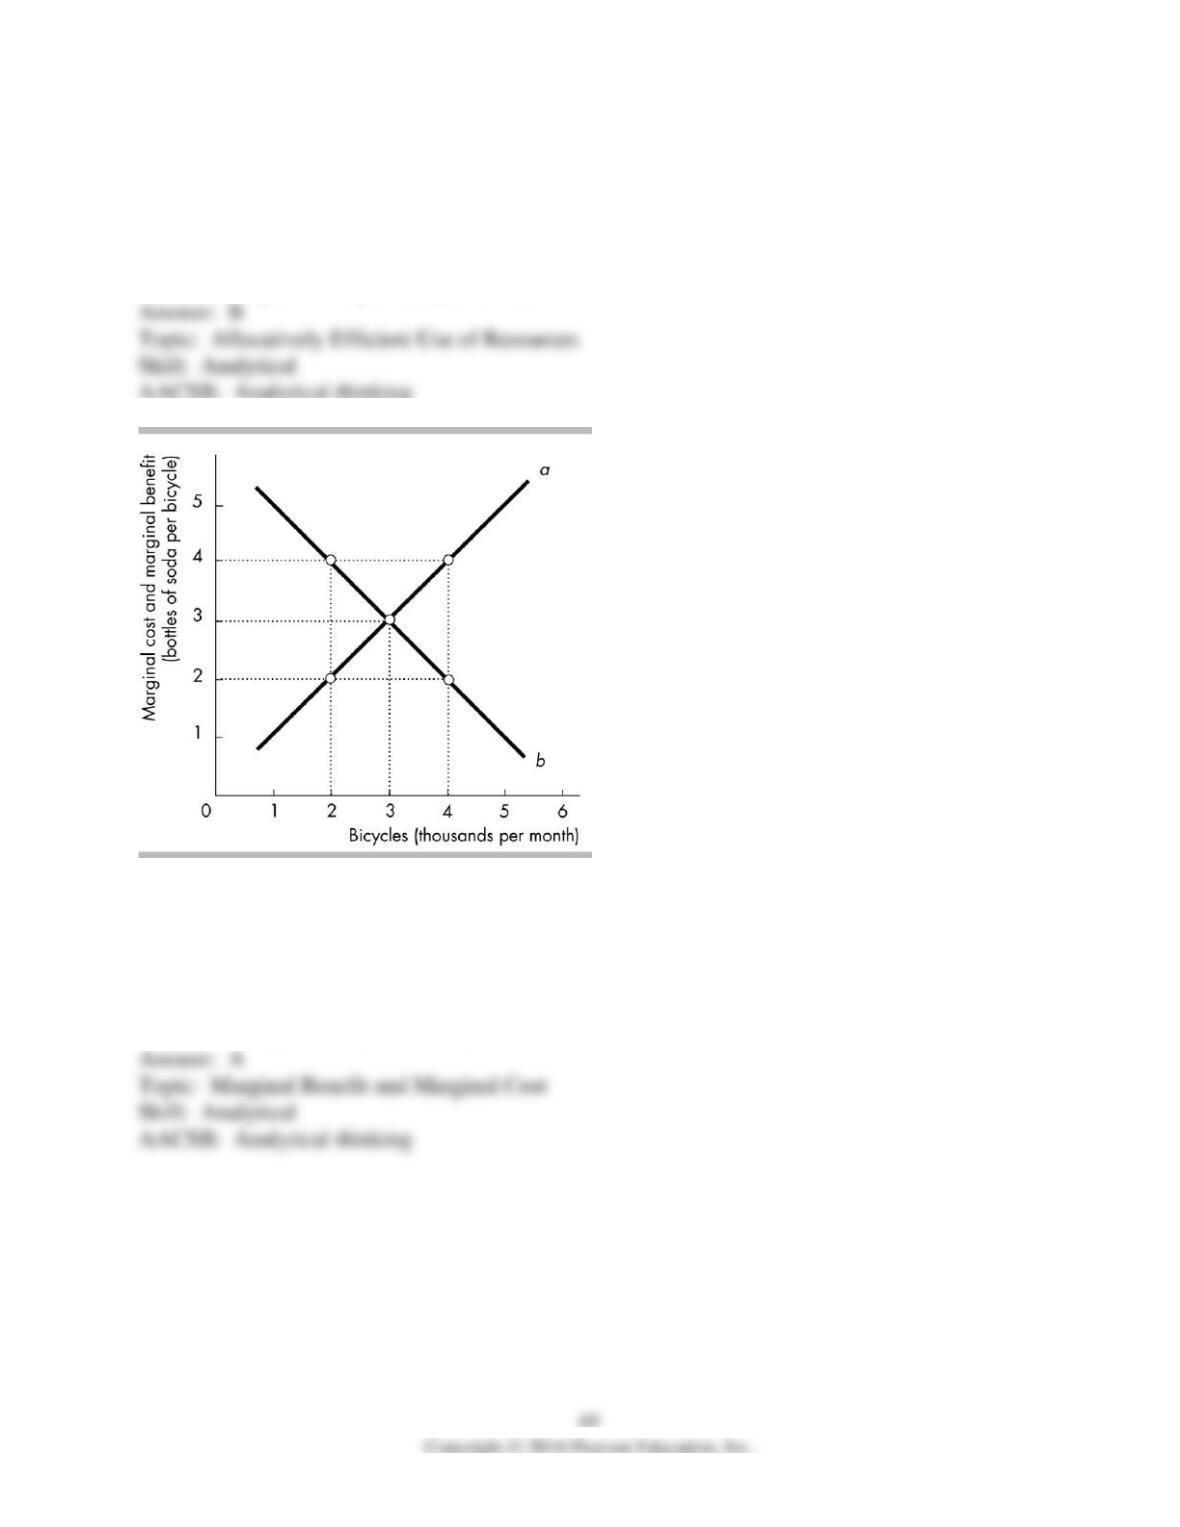
50) In the above figure, the curve labeled a is the ________ curve and the curve labeled b is the
________ curve.
A) marginal cost; marginal benefit
B) marginal cost; trade line
C) marginal benefit; trade line
D) production possibilities frontier; trade line
51) In the above figure, curve b shows the
A) bottles of soda that people are willing to forgo to get another bicycle.
B) bottles of soda that people must forgo to get another bicycle.
C) benefits of producing more bicycles is greater than the benefits of producing more soda.
D) benefits of producing more soda is greater than the benefits of producing more bicycles.
52) In the above figure, when 2000 bicycles are produced each month, we can see that
A) the marginal benefit from another bicycle is greater than the marginal cost of another bicycle.
B) more bicycles should be produced to reach the allocatively efficient level of output.
C) the economy is very efficient at the production of bicycles because the marginal benefit
exceeds the marginal cost.
D) Both answers A and B are correct.
53) In the above figure, if 4000 bicycles are produced per month,
A) marginal benefit is greater than marginal cost.
B) fewer bicycles should be produced to reach the allocatively efficient level of output.
C) the marginal cost of production is 2 bottles of soda per bicycle.
D) Both answers A and B are correct.
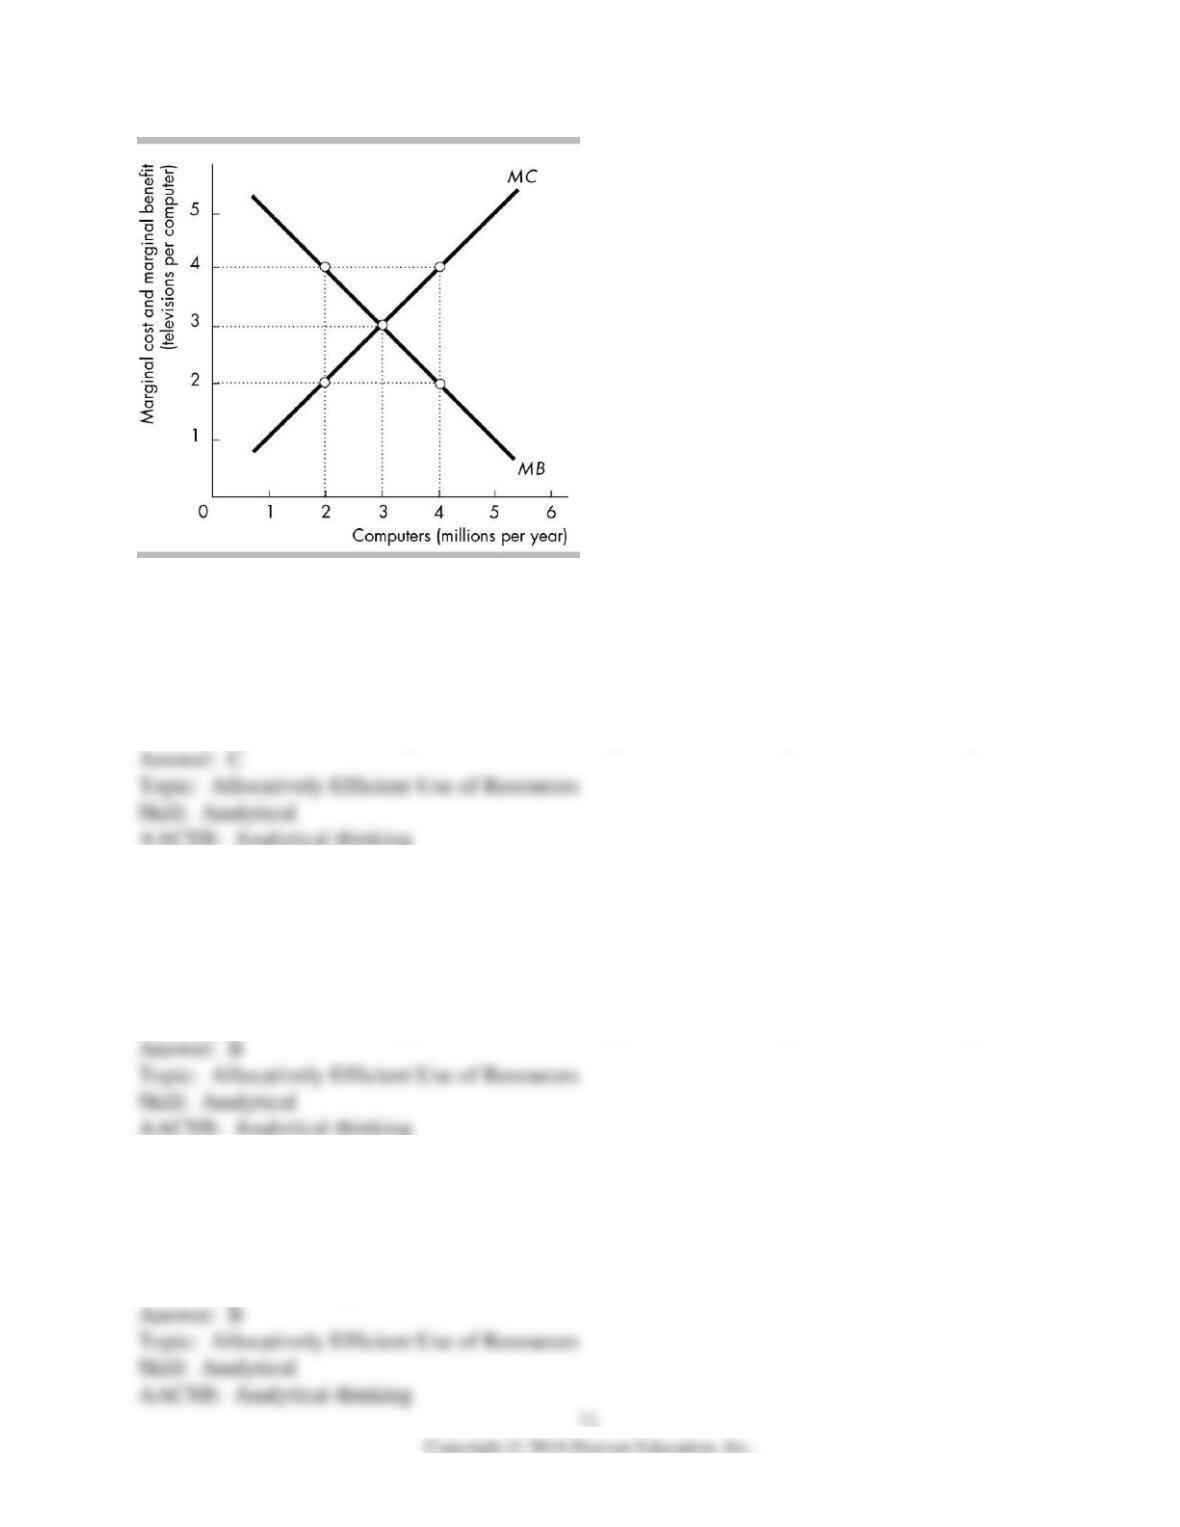
54) In the above figure, if 2 million computers are produced per year then the ________ should
be produced to achieve the allocatively efficient use of resources.
A) marginal cost of a computer exceeds the marginal benefit of a computer, so more computers
B) marginal cost of a computer exceeds the marginal benefit of a computer, so fewer computers
C) marginal benefit of a computer exceeds the marginal cost of a computer, so more computers
D) marginal benefit of a computer exceeds the marginal cost of a computer, so fewer computers
55) In the figure above, if 4 million computers are produced per year then the ________ should
be produced to achieve the allocatively efficient use of resources.
A) marginal cost of a computer exceeds the marginal benefit of a computer, so more computers
B) marginal cost of a computer exceeds the marginal benefit of a computer, so fewer computers
C) marginal benefit of a computer exceeds the marginal cost of a computer, so more computers
D) marginal benefit of a computer exceeds the marginal cost of a computer, so fewer computers
56) In the figure above, the allocatively efficient output of computers is
A) 2 million per year.
B) 3 million per year.
C) 4 million per year.
D) the largest amount possible.
57) In the figure above, at the allocatively efficient level of computer production consumers are
willing to give up
A) 0 televisions per computer.
B) between 0 and 3 televisions per computer.
C) 3 televisions per computer.
D) more than 3 televisions per computer.
58) In the figure above, at the allocatively efficient level of computer production the marginal
cost of producing a computer is
A) 0 televisions per computer.
B) between 0 and 3 televisions per computer.
C) 3 televisions per computer.
D) more than 3 televisions per computer.
59) The most anyone is willing to pay for another purse is $30. Currently the price of a purse is
$40, and the cost of producing another purse is $50. The marginal benefit of a purse is
A) $50.
B) $40.
C) $30.
D) an amount not given in the answers above.
60) If the marginal benefit from another computer exceeds the marginal cost of the computer,
then to use resources allocatively efficiently
A) more resources should be used to produce computers.
B) fewer resources should be used to produce computers.
C) if the marginal benefit exceeds the marginal cost by as much as possible, the efficient amount
of resources are being used to produce computers.
D) None of the above is correct because marginal benefit and marginal cost have nothing to do
with using resources allocatively efficiently.
3 Economic Growth
1) An expansion of the production possibilities frontier is
A) called economic growth.
B) proof that scarcity is not a binding constraint.
C) a free gift of nature.
D) something that has occurred only rarely in history.
2) Economic growth can be represented by
A) a movement down the production possibilities frontier (PPF).
B) a movement up the production possibilities frontier (PPF).
C) an inward shift of the production possibilities frontier (PPF).
D) an outward shift of the production possibilities frontier (PPF).
3) When economic growth occurs, the
A) economy moves along its production possibilities frontier.
B) production possibilities frontier shifts outward.
C) production possibilities frontier becomes steeper.
D) production possibilities frontier shifts outward but no longer limits the amount that can be
produced.
4) After Hurricane Katrina devastated parts of Mississippi and New Orleans in 2005, we can be
sure that the production possibilities frontier for that area temporarily
A) shifted inward, toward the origin.
B) shifted outward, away from the origin.
C) became flatter.
D) became steeper.
5) Economic growth is the result of all of the following EXCEPT
A) technological change.
B) capital accumulation.
C) opportunity cost.
D) investment in human capital.
6) A key factor that leads to economic growth is
A) human capital accumulation.
B) increasing current consumption.
C) avoiding the opportunity cost of investment.
D) Both answers A and B are correct.
7) Technological progress makes the production possibilities frontier
A) shift inward toward the origin.
B) become more linear and less bowed.
C) shift outward from the origin.
D) become less linear and more bowed.
8) Economic growth is shown on the production possibilities frontier as
A) a movement from one point on the PPF to another.
B) an outward shift in the PPF.
C) an inward shift in the PPF.
D) the curvature of the PPF.
9) Economic growth can be pictured in a production possibilities frontier diagram by
A) making the production possibilities frontier more bowed out.
B) making the production possibilities frontier less bowed out.
C) shifting the production possibilities frontier outward.
D) shifting the production possibilities frontier inward.
10) Using a production possibilities frontier, economic growth is illustrated by a
A) point inside the curve.
B) point on the curve.
C) movement from one point on the curve to another point on the curve.
D) rightward shift of the curve.
11) Capital accumulation definitely
A) has no impact on the production possibilities frontier.
B) shifts the production possibilities frontier inward.
C) makes the production possibilities frontier steeper.
D) shifts the production possibilities frontier outward.
12) President Obama has proposed a goal that everyone complete at least one year of formal
education or training beyond high school. This policy would
A) increase human capital and increase economic growth.
B) increase physical capital and increase economic growth.
C) increase financial capital and increase economic growth.
D) eliminate opportunity costs and increase economic growth.
13) Economic growth comes from ________.
A) people willing to increase their skills in which case, economic growth is free
B) producing more goods than people want to consume
C) capital accumulation and the avoidance of opportunity cost
D) capital accumulation and technological advance
14) The production possibilities frontier shifts as
A) tastes and preferences change.
B) the money supply grows or shrinks.
C) technology changes.
D) the unemployment rate changes.
15) Technological change
A) generates economic growth.
B) shifts the PPF leftward.
C) creates inefficiency.
D) Both answers A and C are correct.
16) As an economy’s capital stock increases, the economy
A) generally experiences increased unemployment of other resources, such as labor.
B) generally decides to engage in international trade.
C) experiences economic growth.
D) gains an absolute advantage in the production of capital goods.
17) An increase in the production of capital goods
A) must increase the current production of consumer goods.
B) must decrease the future production of consumer goods.
C) shifts the production possibilities frontier inward in the future.
D) shifts the production possibilities frontier outward in the future.
18) Suppose a scientific breakthrough made free solar power available in unlimited quantities in
the United States. The effect of this invention would be to move the
A) United States beyond its production possibilities frontier.
B) United States inside its production possibilities frontier.
C) U.S. production possibilities frontier outward.
D) U.S. production possibilities frontier inward.
19) In March a factory used new technology to produce its output. Then in August a fire destroys
half the factory. The new technology shifted the factory’s PPF ________ and the fire shifted it
________.
A) inward; outward
B) outward; inward
C) outward; outward
D) inward; inward
20) Suppose the United States discovers a way to produce clean nuclear fuel. The effect of this
discovery would be to
A) lead the United States to produce less nuclear fuel.
B) force the United States to produce at a point inside its PPF.
C) shift the U.S. PPF outward.
D) shift the U.S. PPF inward.
21) Consider a production possibilities frontier with corn on the vertical axis and cars on the
horizontal. Unusually good weather for growing corn shifts
A) the horizontal intercept rightward and the vertical intercept upward.
B) the horizontal intercept rightward but does not shift the vertical intercept.
C) the vertical intercept upward but does not shift the horizontal intercept.
D) neither the horizontal intercept nor the vertical intercept.
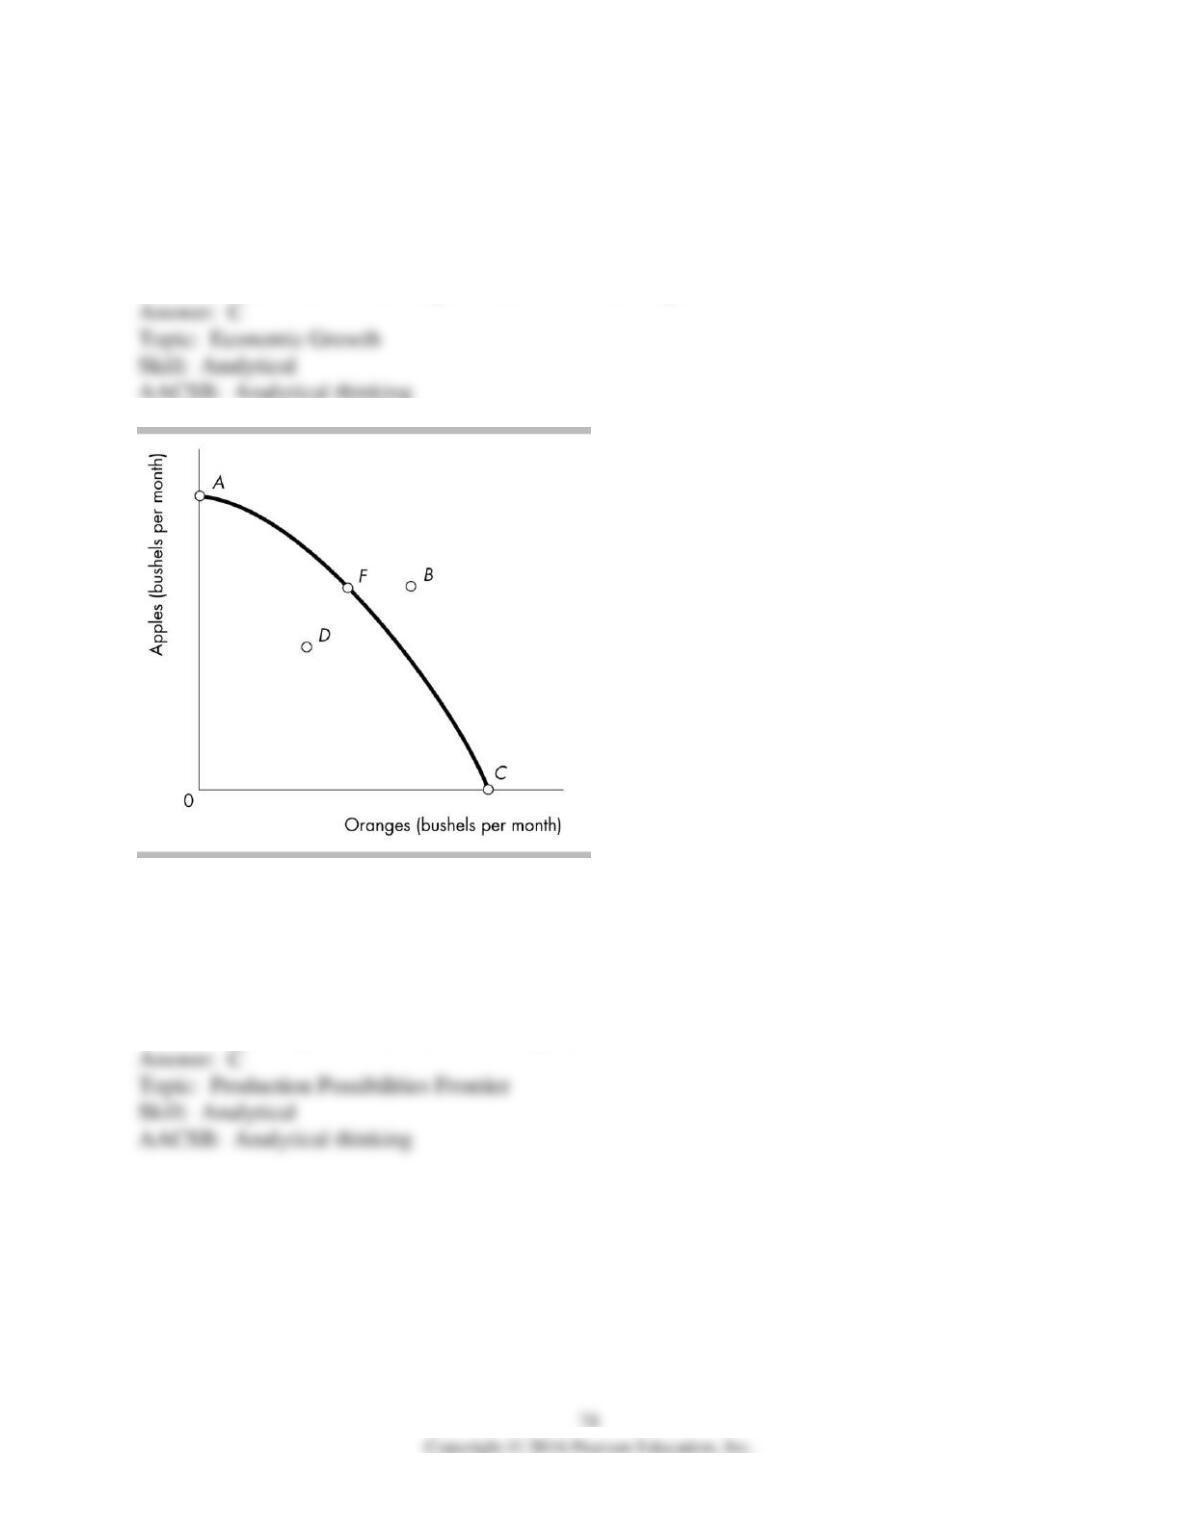
22) In the figure above, how can the economy represented by the production possibilities frontier
move from point C to point F?
A) Increase the available amount of resources.
B) Increase the level of technology.
C) Redistribute the existing resources to produce more apples and fewer oranges.
D) First move to point B and then move to point F.
23) In the figure above, a point showing an inefficient production point is point
A) A.
B) B.
C) C.
D) D.
24) In the figure above, what can be said about point B?
A) It can be reached only after economic growth occurs.
B) It can be attained only if some resources are left unused.
C) It represents all resources being devoted to the production of apples.
D) It represents all resources being devoted to the production of oranges.
25) In the figure above, point D is
A) less production efficient than point C.
B) production efficient and point A is not production efficient.
C) not production efficient and point B is production efficient.
D) production efficient and point B is not production efficient.
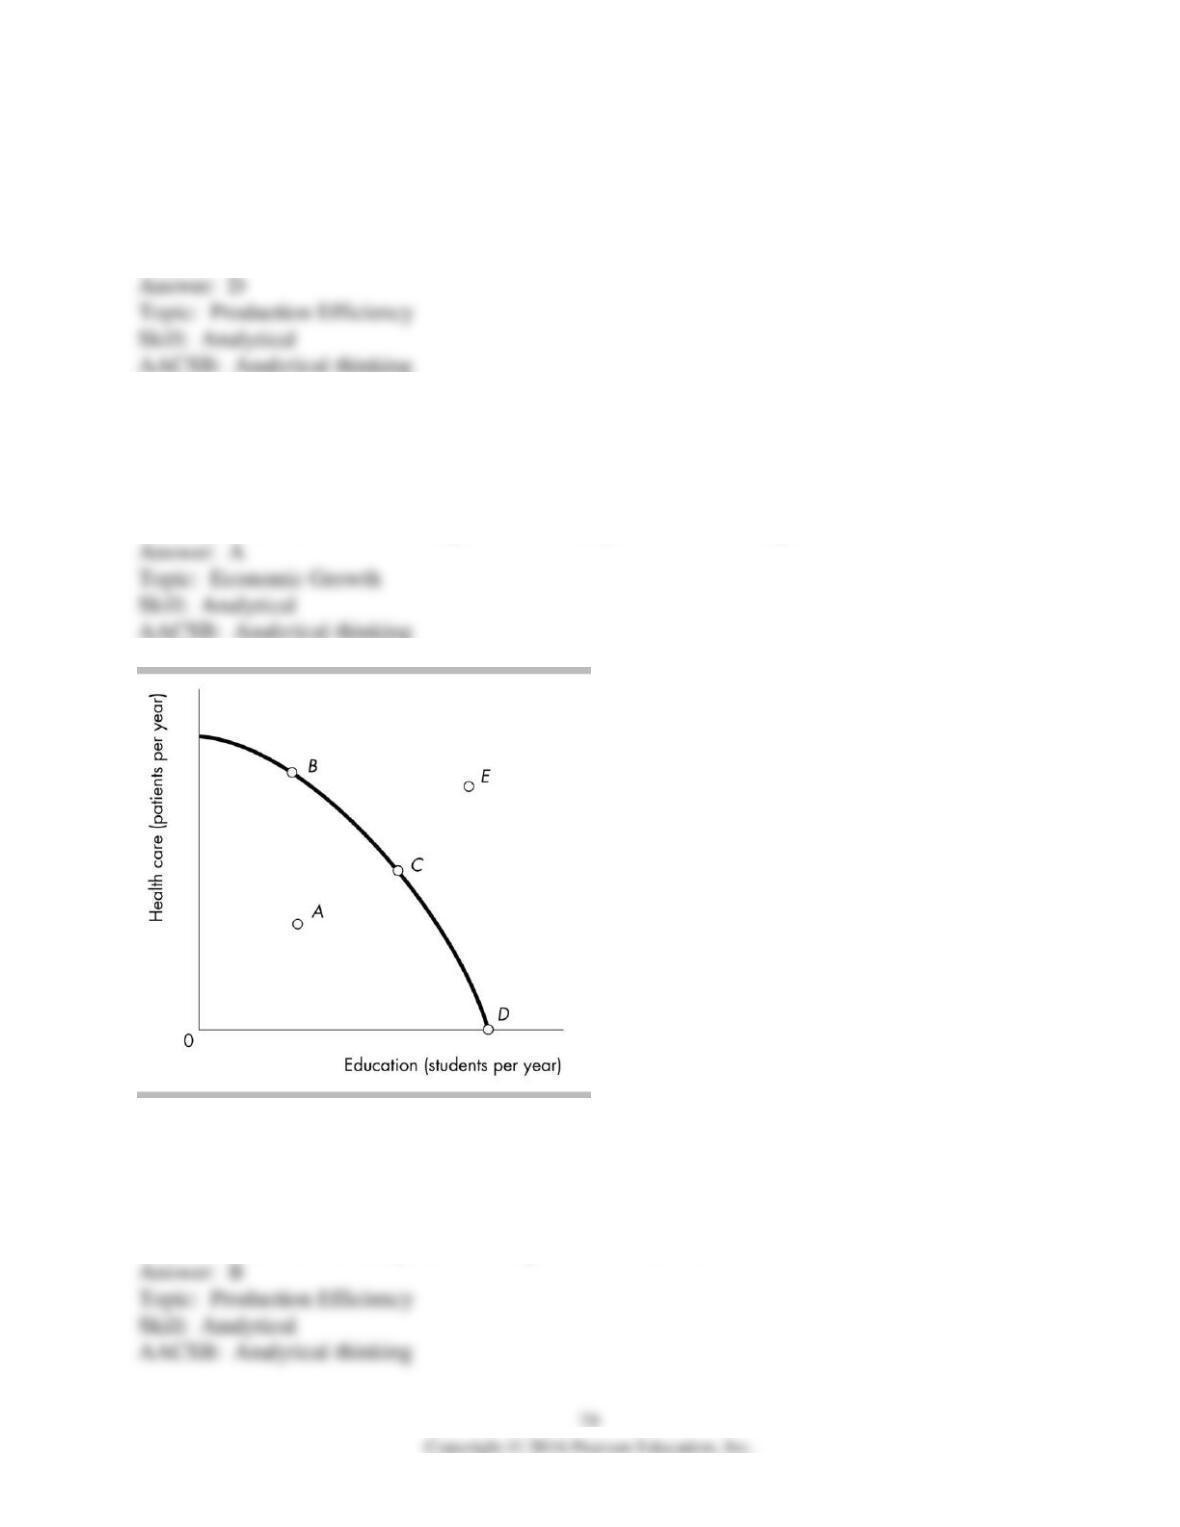
26) In the figure above, point A is undesirable because
A) there is an inefficient use of resources.
B) too much health care is being produced.
C) the opportunity costs of health care is too high.
D) point E is a more realistic option in this economy.
27) In the figure above, the opportunity cost of moving from point C to point D is
A) the loss in production in the health care sector.
B) the increase in production in the education sector.
C) zero.
D) the loss in production in the education sector.
28) In the figure above, point E could be obtained if
A) resources were shifted from education to health care.
B) resources were used more efficiently.
C) society’s resources increased.
D) resources were shifted from health care to education.