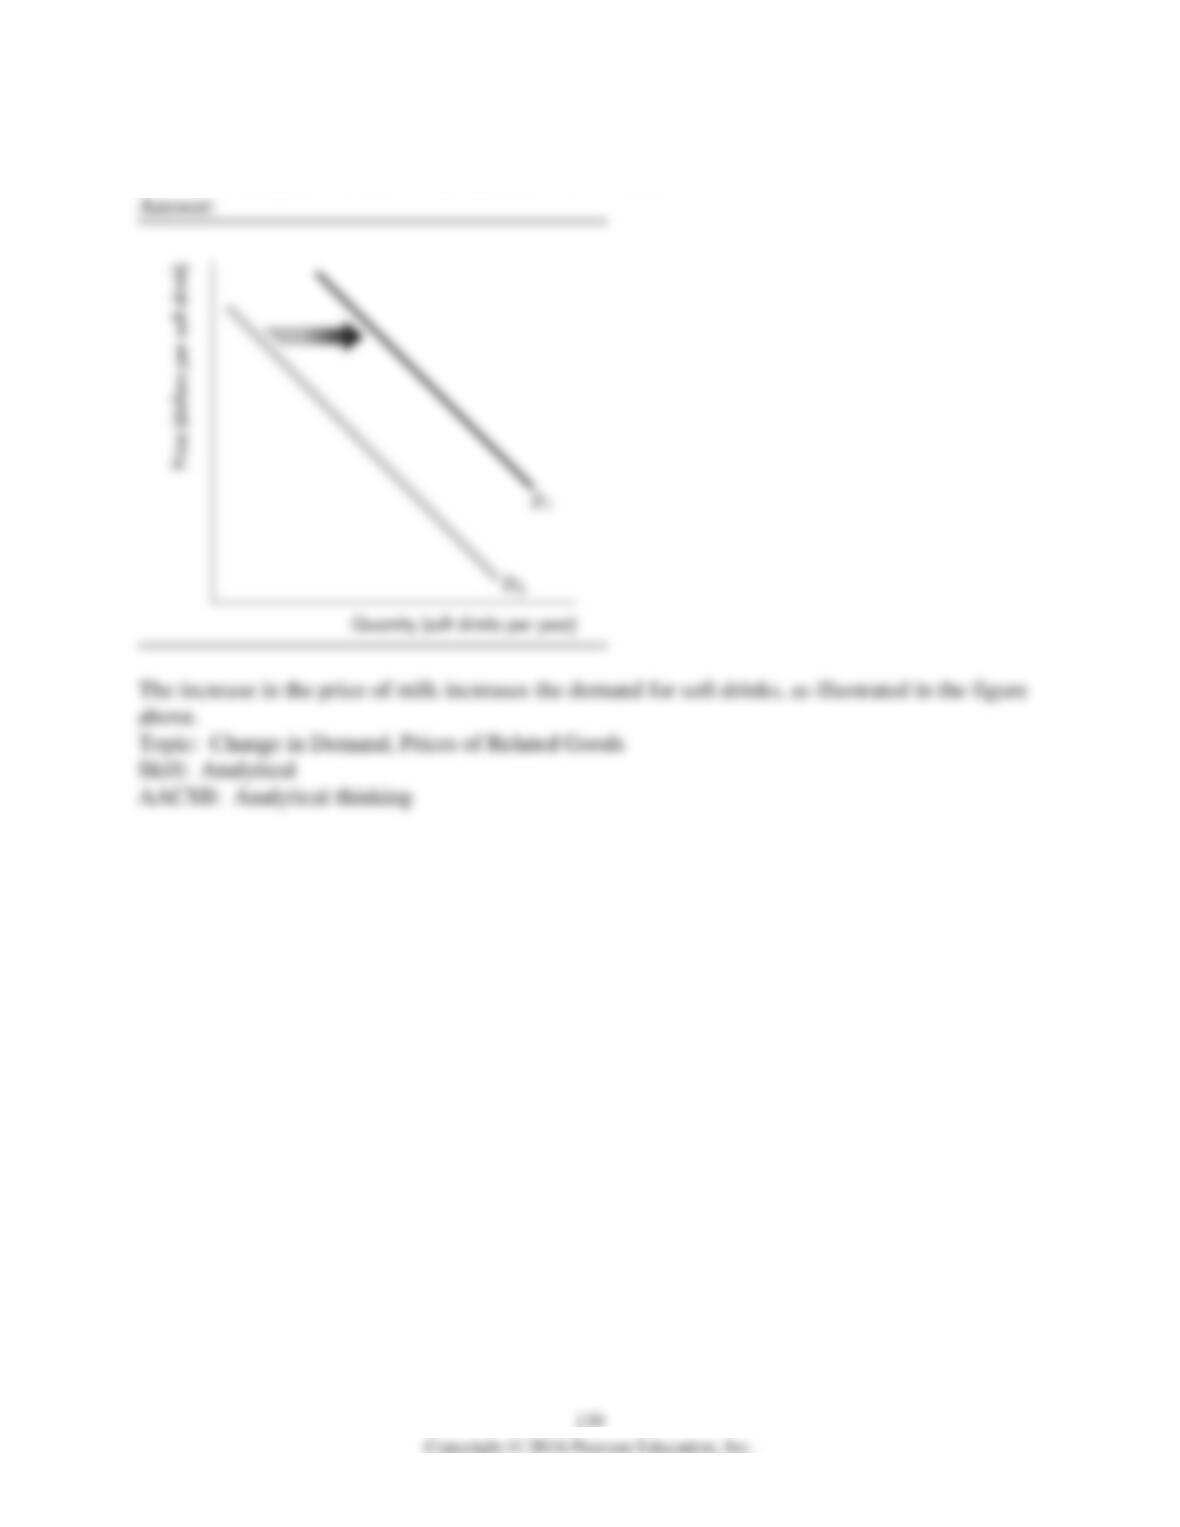
2) Soft drinks and milk are substitutes for consumers. Draw a graph showing the effect of an
increase in the price of milk on the demand for soft drinks.
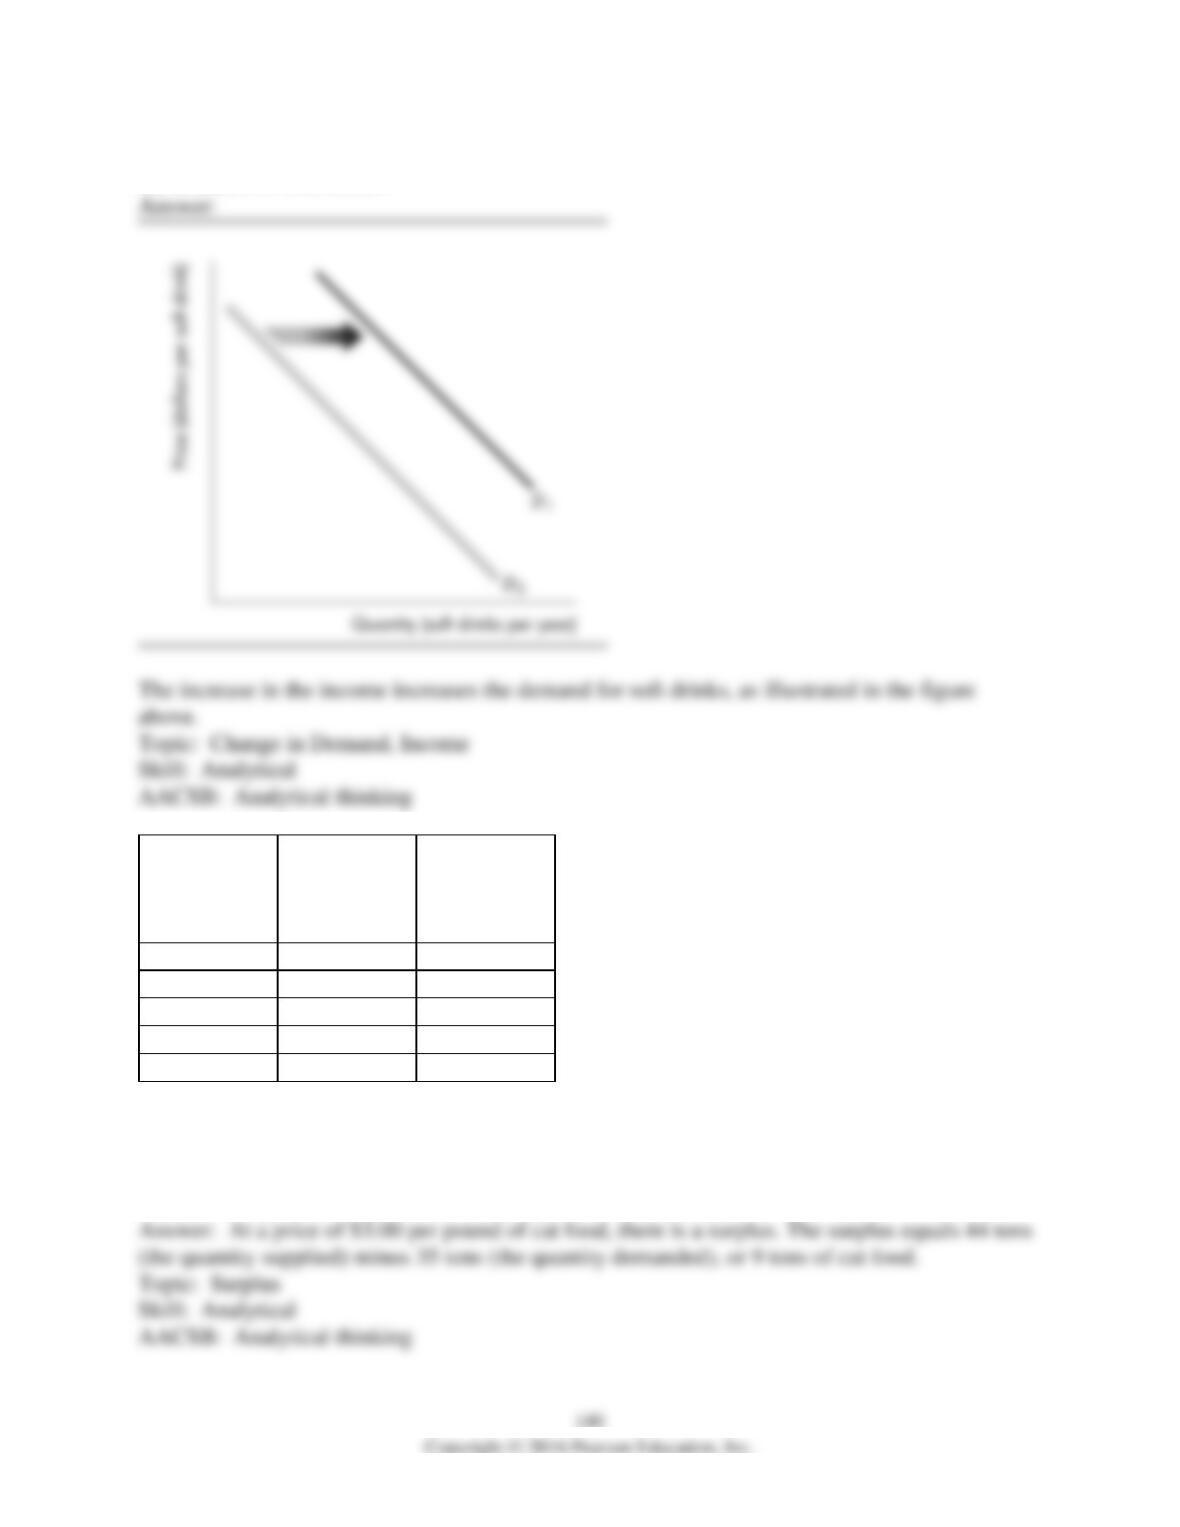
3) Soft drinks are a normal good. Draw a graph showing the effect of an increase in income on
the demand for soft drinks.
Price
(dollars per
pound of cat
food)
Quantity
demanded
(tons of cat
food per year)
Quantity
supplied
(tons of cat
food per year)
1.00
52
15
1.50
46
26
2.00
43
34
2.50
40
30
3.00
35
44
4) The above table gives the demand and supply schedules for cat food. If the price is $3.00 per
pound of cat food, will there be a shortage, a surplus, or is this price the equilibrium price? If
there is a shortage, how much is the shortage? If there is a surplus, how much is the surplus? If
$3.00 is the equilibrium price, what is the equilibrium quantity?
5) The above table gives the demand and supply schedules for cat food. If the price is $1.00 per
pound of cat food, will there be a shortage, a surplus, or is this price the equilibrium price? If
there is a shortage, how much is the shortage? If there is a surplus, how much is the surplus? If
$3.00 is the equilibrium price, what is the equilibrium quantity?
6) The above table gives the demand and supply schedules for cat food. What is the equilibrium
price and quantity?
7) The above table gives the demand and supply schedules for cat food. If the supply increases
by 20 tons at every price, what is the new equilibrium price and quantity?
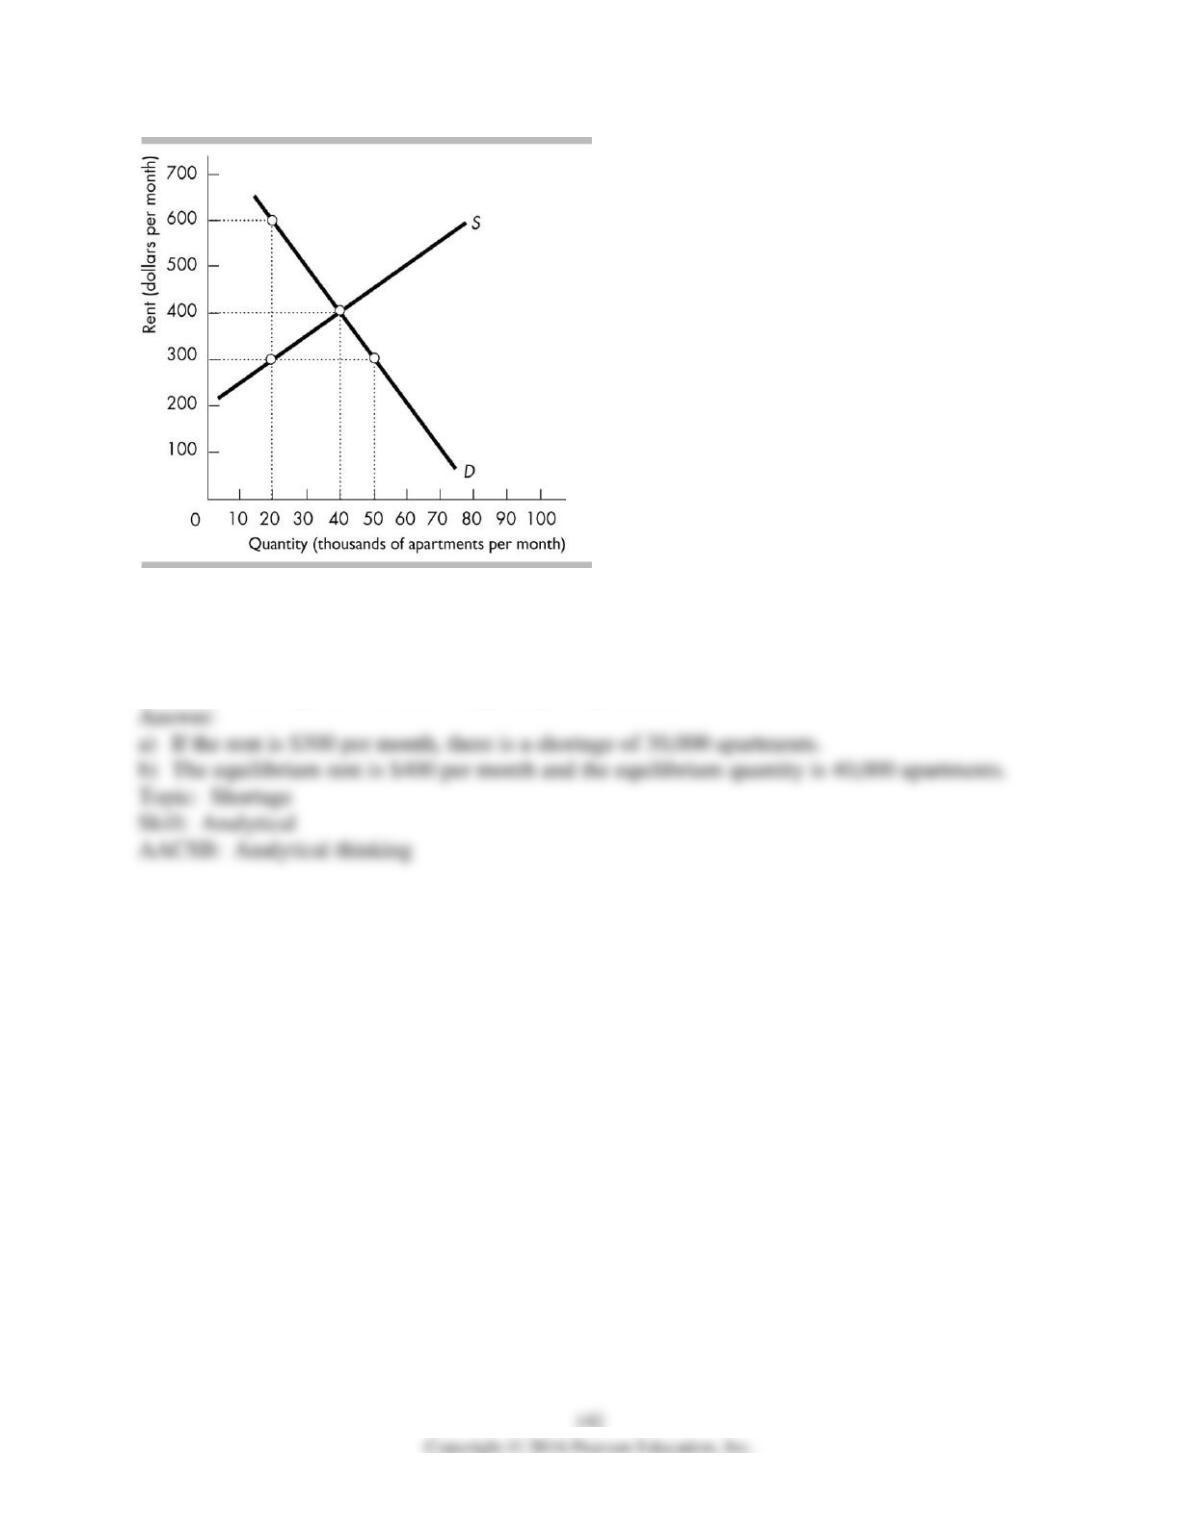
8) The diagram above illustrates the market for apartments in Victoria, British Columbia.
a) If the current rent is $300 per month, is there a shortage or surplus in the apartment market
and how much is the shortage or surplus?
b) What is the equilibrium rent and quantity of apartments?
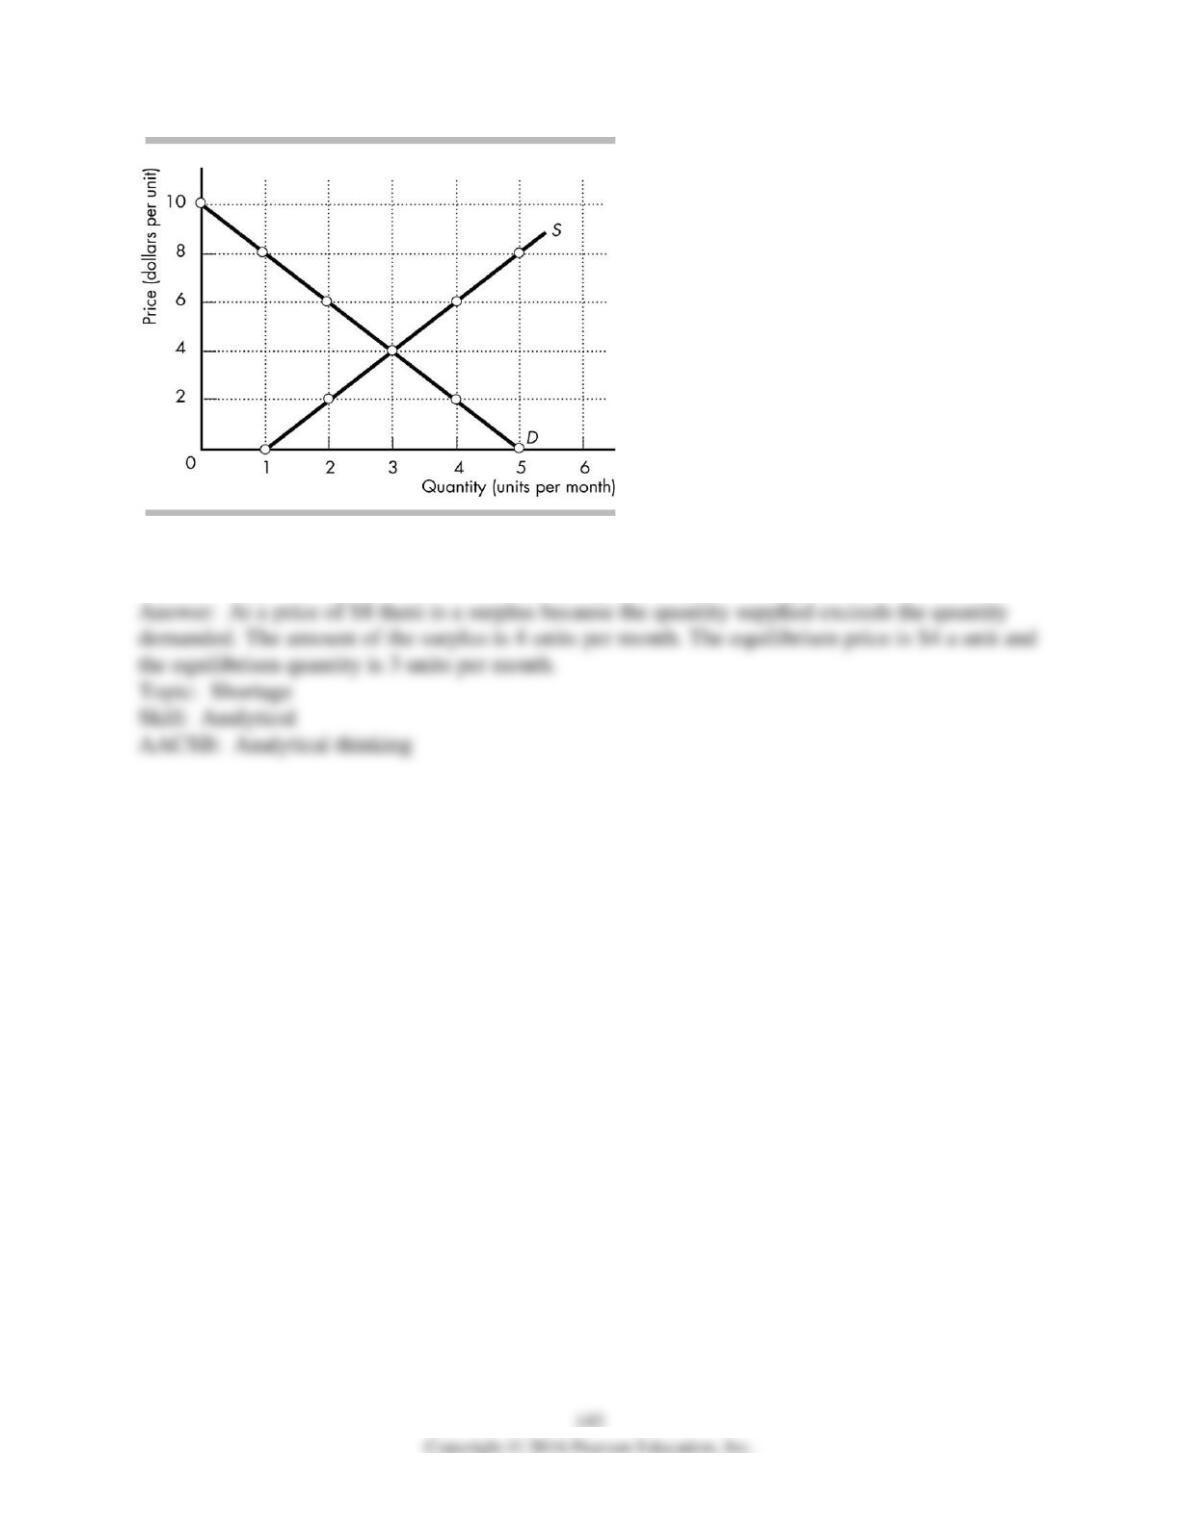
9) In the figure above, if the price is $8 a unit, is there a shortage or surplus and what is the
amount of any shortage or surplus? What is the equilibrium price and quantity?
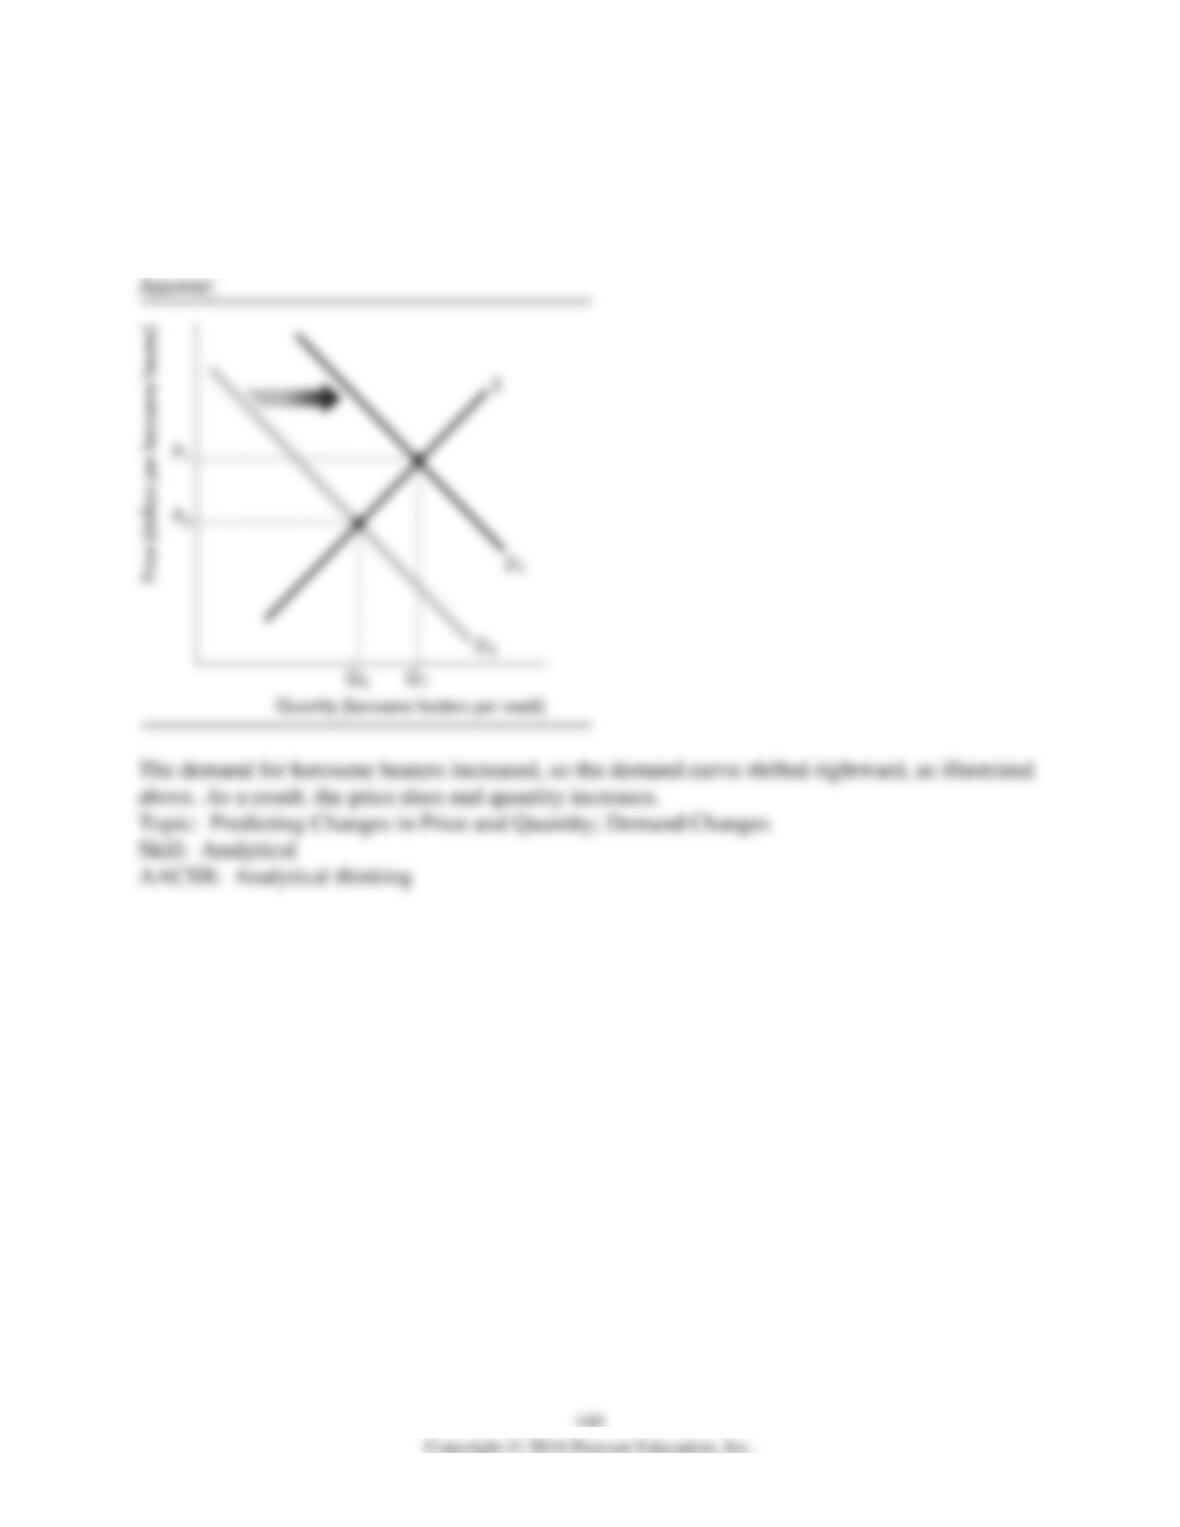
10) Last year a very severe ice storm hit the north counties of New York state, and the states of
Vermont and Maine. Electric poles were down and no one had power for days. It was reported
that the price of kerosene heaters skyrocketed and the number purchased increased during this
time. Using a supply and demand diagram, show the impact of the ice storm on the market for
kerosene heaters.
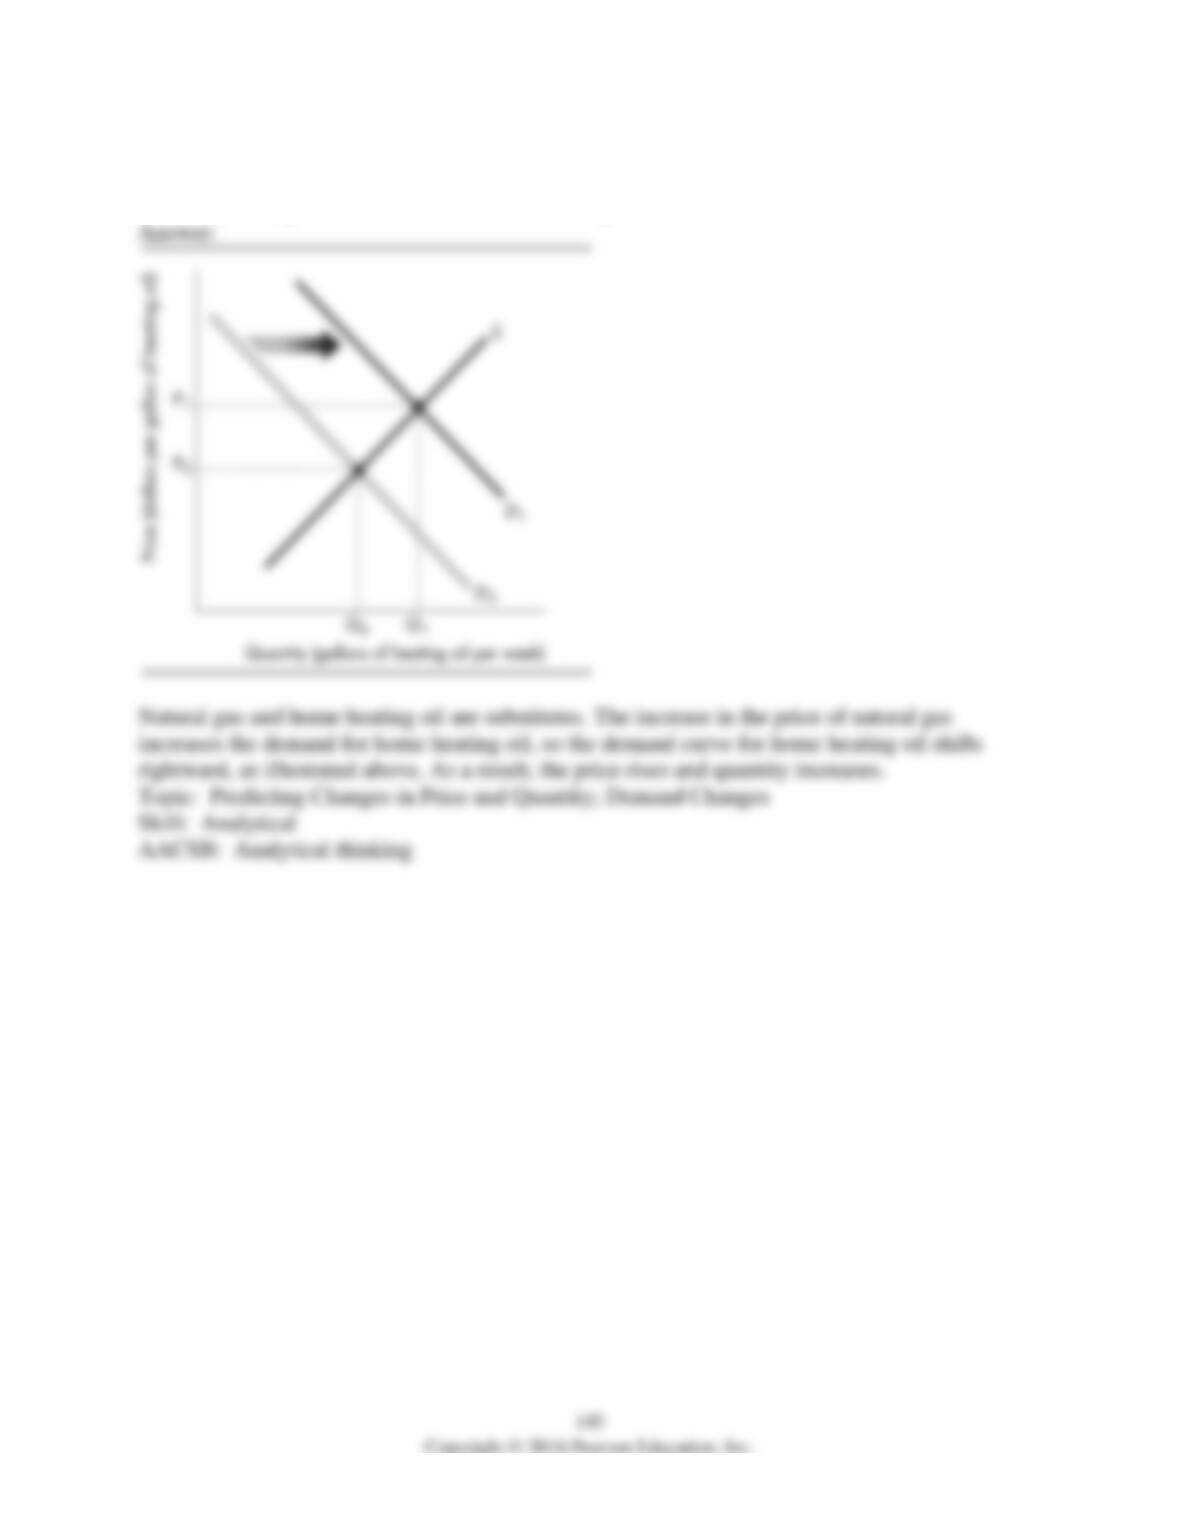
11) Consumers can use either natural gas or heating oil to warm their houses. Suppose the price
of natural gas increases. Use a demand and supply diagram to show the impact of the higher
price of natural gas on the market for home heating oil.
Price
(dollars per disk)
Quantity
demanded
(millions of disks
per month)
Quantity supplied
(millions of disks
per month)
10.50
50
0
11.00
40
15
11.50
30
30
12.00
20
45
12.50
10
60
13.00
0
75
12) Suppose the market for Blu-rays has the demand and supply schedules shown in the table
above. What is the equilibrium price and the equilibrium quantity in this market?
Suppose the current price is $12.00. What is the quantity of Blu-rays sold? Explain. Is there a
shortage or a surplus? How big is it? Explain.
13) Suppose the market for Blu-rays has the demand and supply schedules shown in the table
above. Suppose a technological advance increases the quantity of disks supplied at each price by
25 million. What is the new equilibrium price and the new equilibrium quantity of Blu-rays?
14) Suppose the market for Blu-rays has the demand and supply schedules shown in the table
above. Suppose a decrease in the price of a Blu-ray player increases the quantity of disks
demanded at each price by 20 million. What are the new equilibrium price and equilibrium
quantity of Blu-rays?
9 True or False
1) A relative price is the product of two money prices.
2) The relative price of a good is greater than the money price of a good.
3) A demand curve is also a willingness-and-ability-to-pay curve.
4) A movement along the demand curve shows a change in demand.
5) An increase in the incomes of baseball fans in New York leads to a rightward movement
along the demand curve but does not shift the demand curve for Yankees tickets.
6) For consumers, chocolate chip cookies and doughnuts are substitutes. So, an increase in the
price of chocolate chip cookies will lead to a rightward shift in the demand curve for doughnuts.
7) Young drivers often buy used cars. An increase in the legal driving age to twenty-one would
result in a leftward movement along the demand curve for used cars, whereas lowering the age to
fifteen would result in a rightward movement along the demand curve.
8) Young drivers often buy used cars. An increase in the legal driving age to twenty-one shifts
the demand curve for used cars leftward, whereas lowering the age to fifteen shifts the demand
curve rightward.
9) The supply curve indicates the minimum quantity that a producer would be willing to supply
at alternative prices.
10) A supply curve is also a maximum-supply-price curve.
11) An increase in price results in increase in supply but not an increase in the quantity supplied.
12) An increase in technology will shift the good’s supply curve rightward.
13) If house purchases and renting an apartment are substitutes, then an increase in the price of a
new house results in a rise in the rent charged for apartments.
14) During the mid-2000s, the average price of a used car fell by nearly $500 and the quantity
sold nation-wide decreased by several thousands each year. This set of results is a contradiction
of the law of demand.
15) When both the demand for a good increases and the supply of the good increases, the
equilibrium quantity definitely increases.
16) In the market for chocolate chip cookies, if the demand decreases while the supply increases,
the price definitely falls but the quantity might increase, decrease, or remain the same.
17) If the demand and supply curves are described by the following equations P = a – bQ and P
= c + dQ, respectively, the equilibrium quantity is Q* = (a – c) / (b + d).
18) If the demand and supply curves are described by the following equations P = a – bQ and P
= c + dQ, respectively, the equilibrium price is P* = (ad + bc) / (b + d).
10 Extended Problems
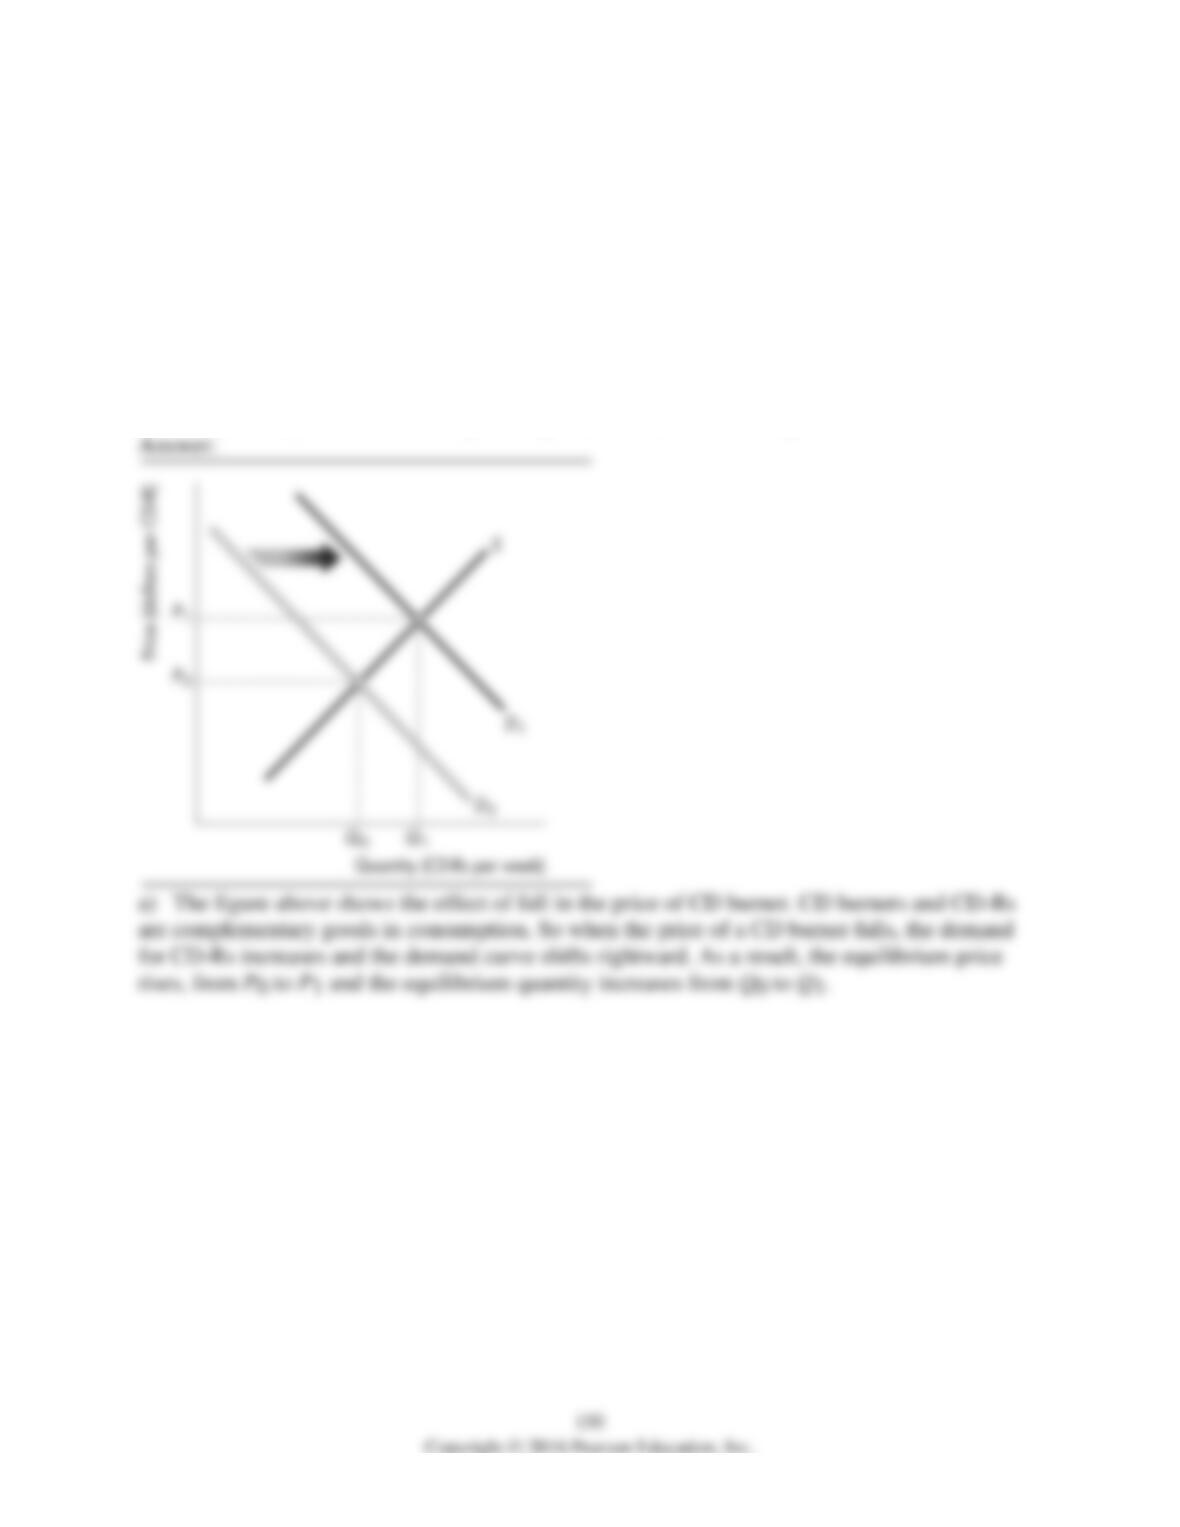
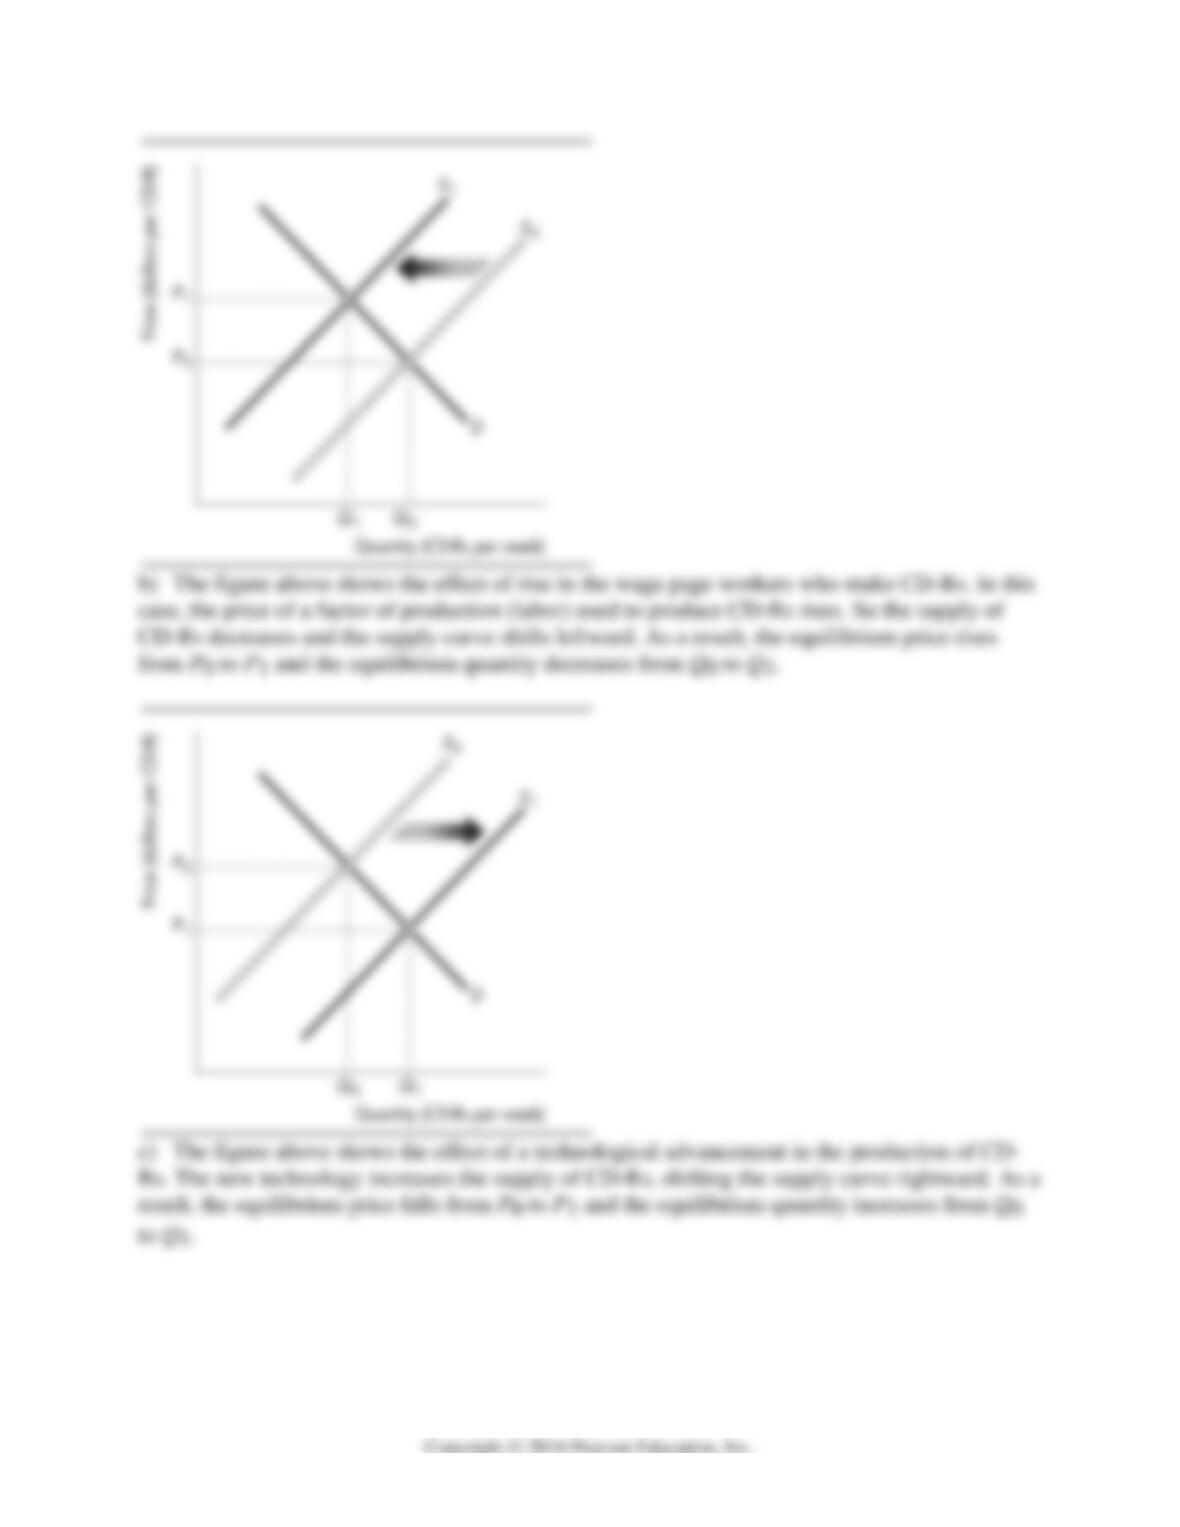
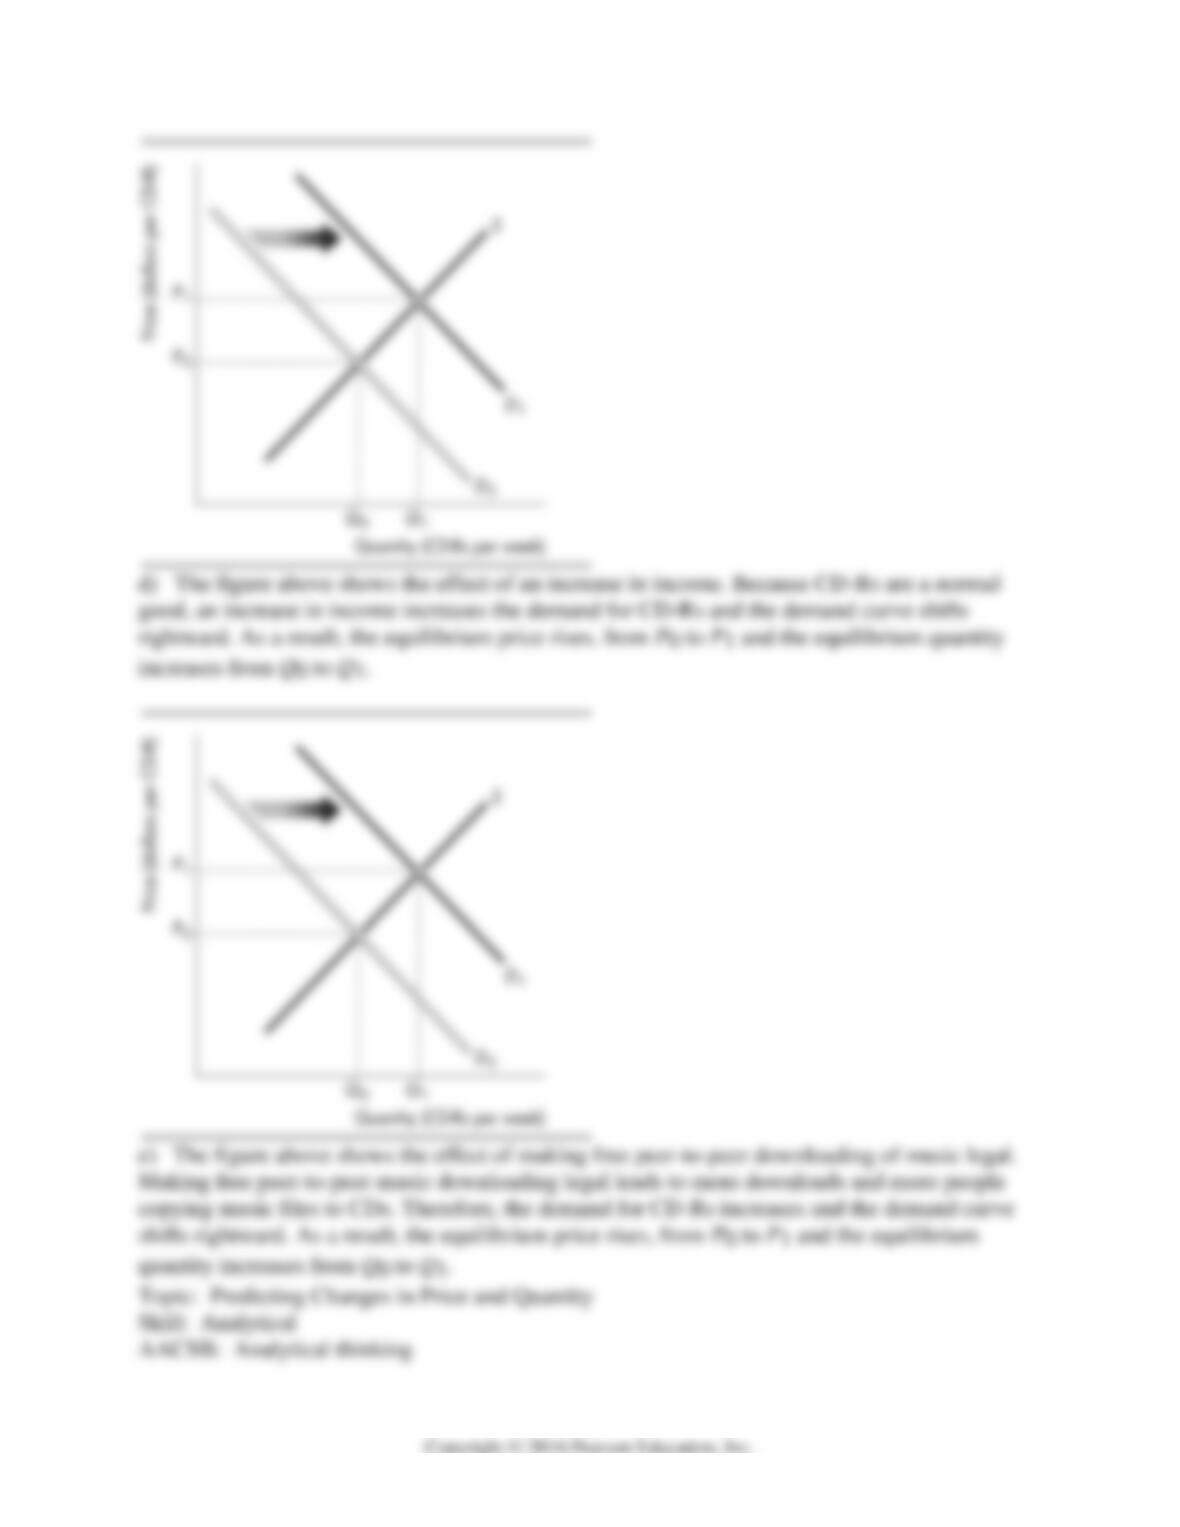
1) Using supply-and-demand diagrams, show and explain the effects of the following events on
the price of CD-Rs and the quantity of CD-Rs sold. For each event, identify which of the
determinants of demand or supply is affected, how it influences demand or supply, and what
happens to the equilibrium price and quantity.
a) The price of a CD burner falls.
b) Workers who make CD-Rs get a pay raise.
c) Producers introduce new cost-saving technologies in their CD-R production plants.
d) Consumers’ incomes increase and CD-Rs are a normal good.
e) Free peer-to-peer music exchange through the Internet becomes legal.
151
152
Price
(cents per
gallon)
Quantity demanded
(thousands of
gallons per week)
Quantity supplied
(thousands of
gallons per week)
290
80
20
300
70
30
310
60
40
320
50
50
330
40
60
340
30
70
350
20
80
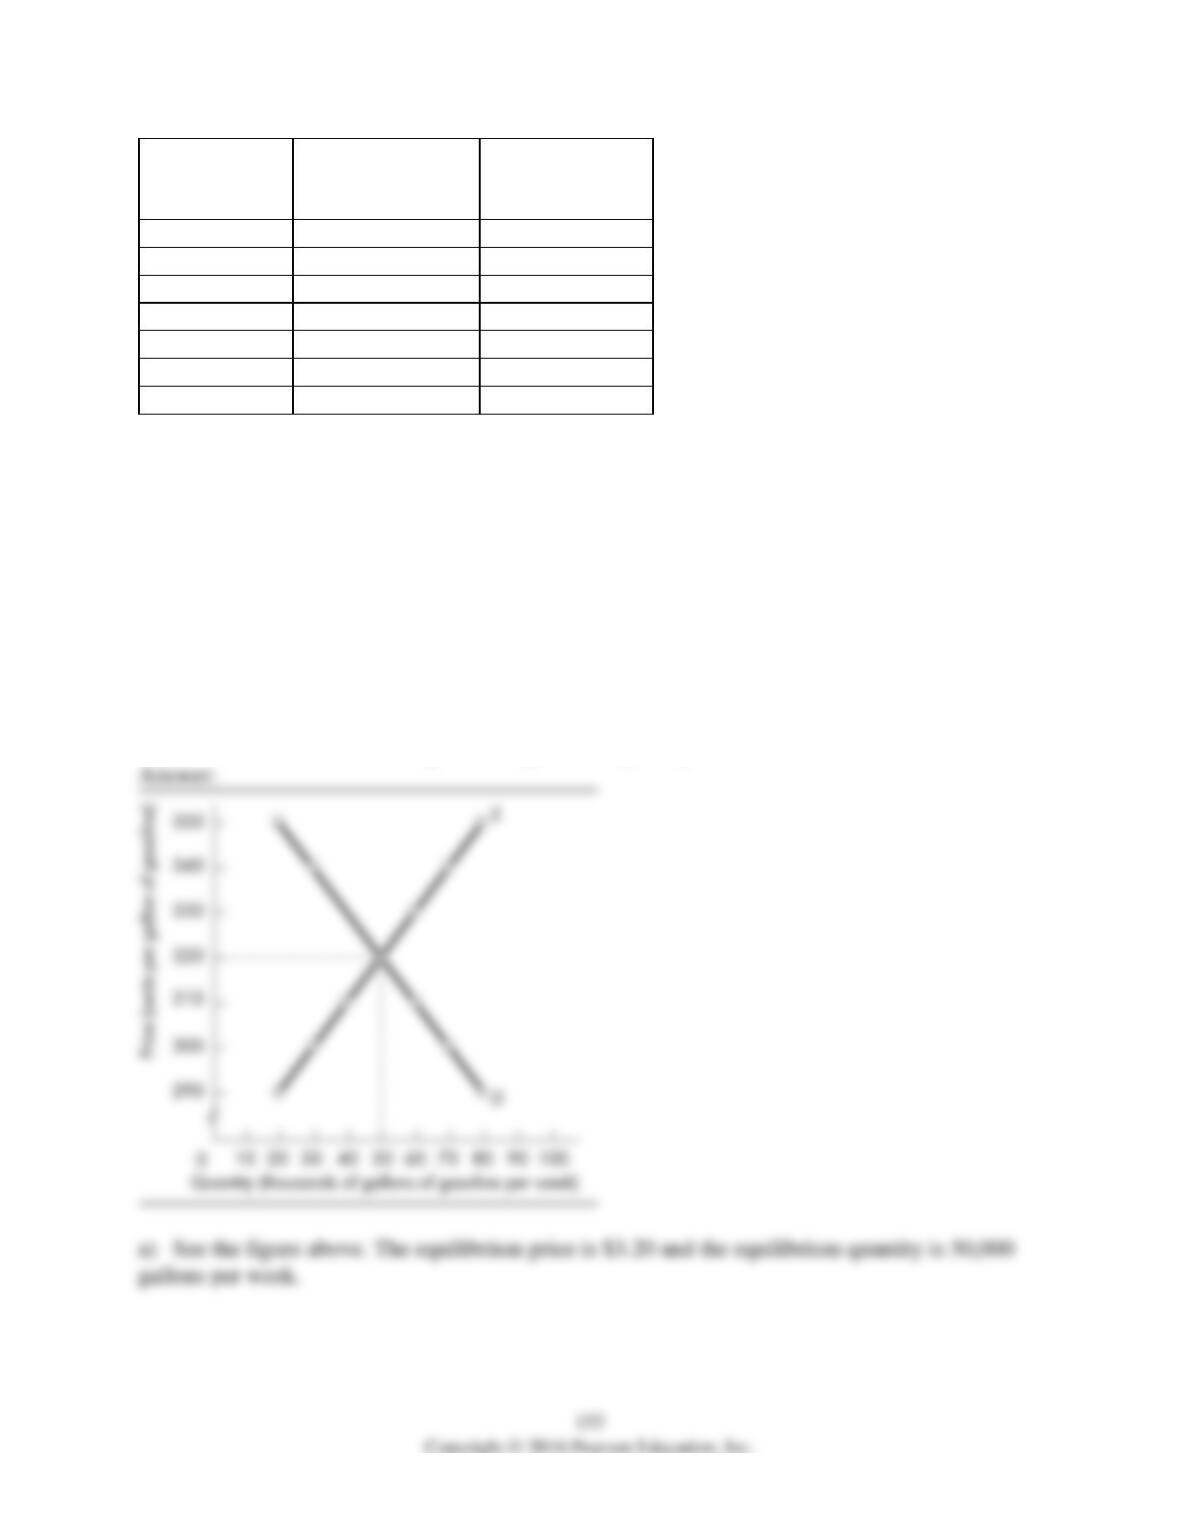
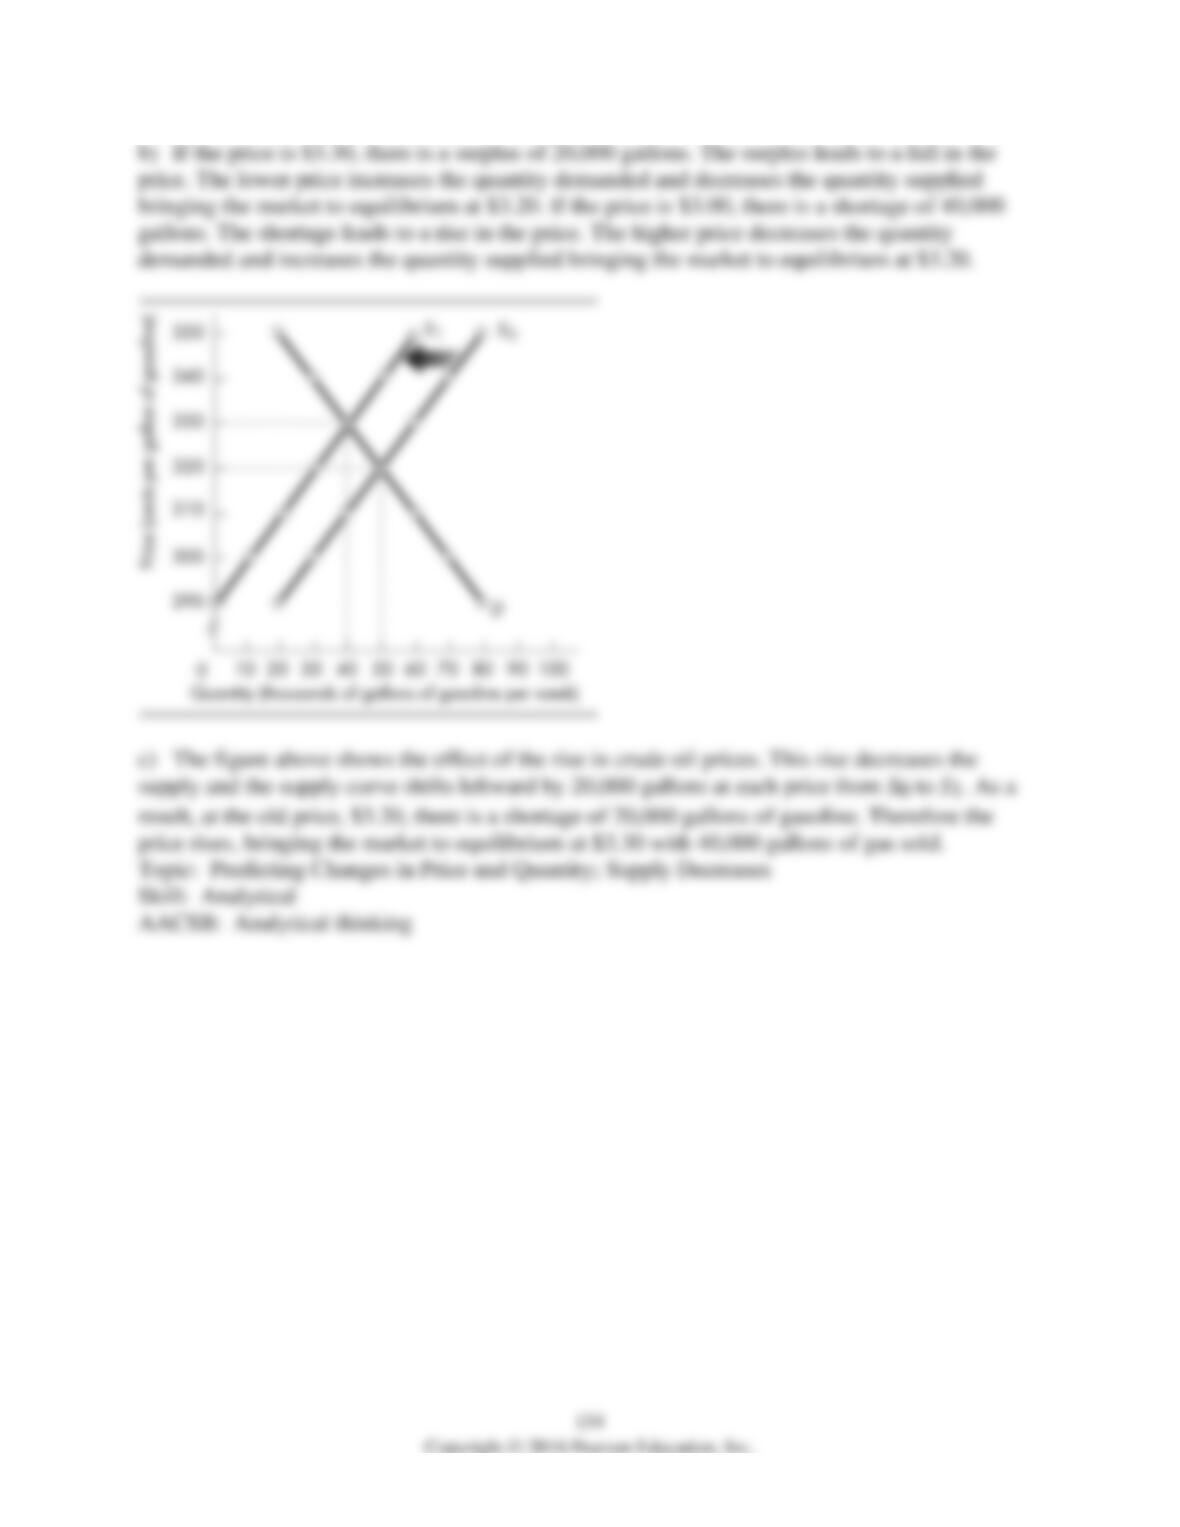
2) A market research team has come up with the demand and supply schedules for gasoline in
Motorville in the table above. Use these data to analyze the situation in the market for gas in
Motorville.
a) Draw a figure showing the demand curve for gasoline and the supply curve of gasoline. What
are the equilibrium price and quantity?
b) Suppose the price is $3.30. Describe the situation in the market and explain how the market
adjusts. Now suppose the price is $3.00. Describe the situation in the market and explain how the
market adjusts.
c) The market research report also predicts that a rise in the price of crude oil will decrease the
quantity of gas supplied by 20,000 gallons a week at each price. Suppose the price of crude oil
does rise. Use your figure to show how this will affect the market for gas. How will the market
adjust? What will be the new equilibrium price and quantity?
Price
(dollars per
pizza)
Quantity demanded
(pizzas per week)
Quantity supplied
(pizzas per week)
5
750
300
6
700
400
7
650
500
8
600
600
9
550
700
10
500
800
11
450
900
12
400
1,000
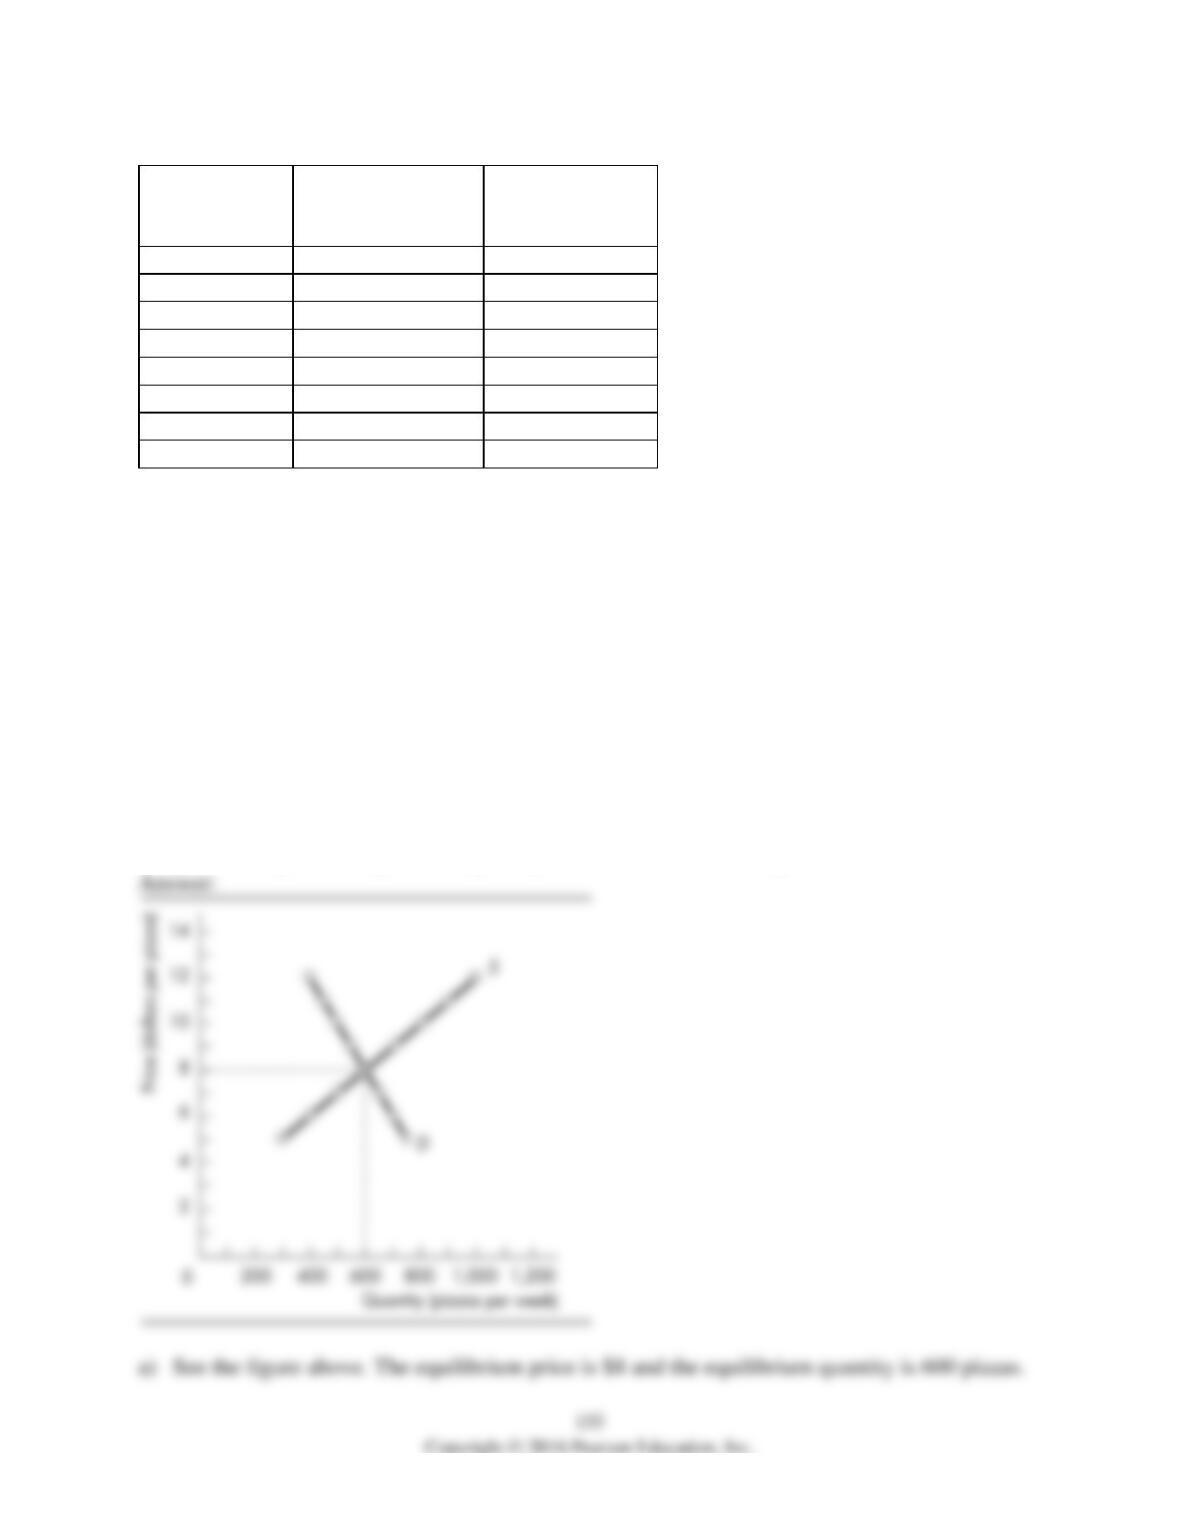
3) A market research team has come up with the demand and supply schedules for pizza in
Cheeseboro. These schedules are given in the table above. Use these data to analyze the situation
in the market for pizza.
a) Draw a figure showing the demand curve for pizza and the supply curve of pizza. What are
the equilibrium price and quantity?
b) Suppose the price is $10. Describe the situation in the market and explain how the price of
pizza adjusts. Now suppose the price is $6. Describe the situation in the market and explain how
the price of pizza adjusts.
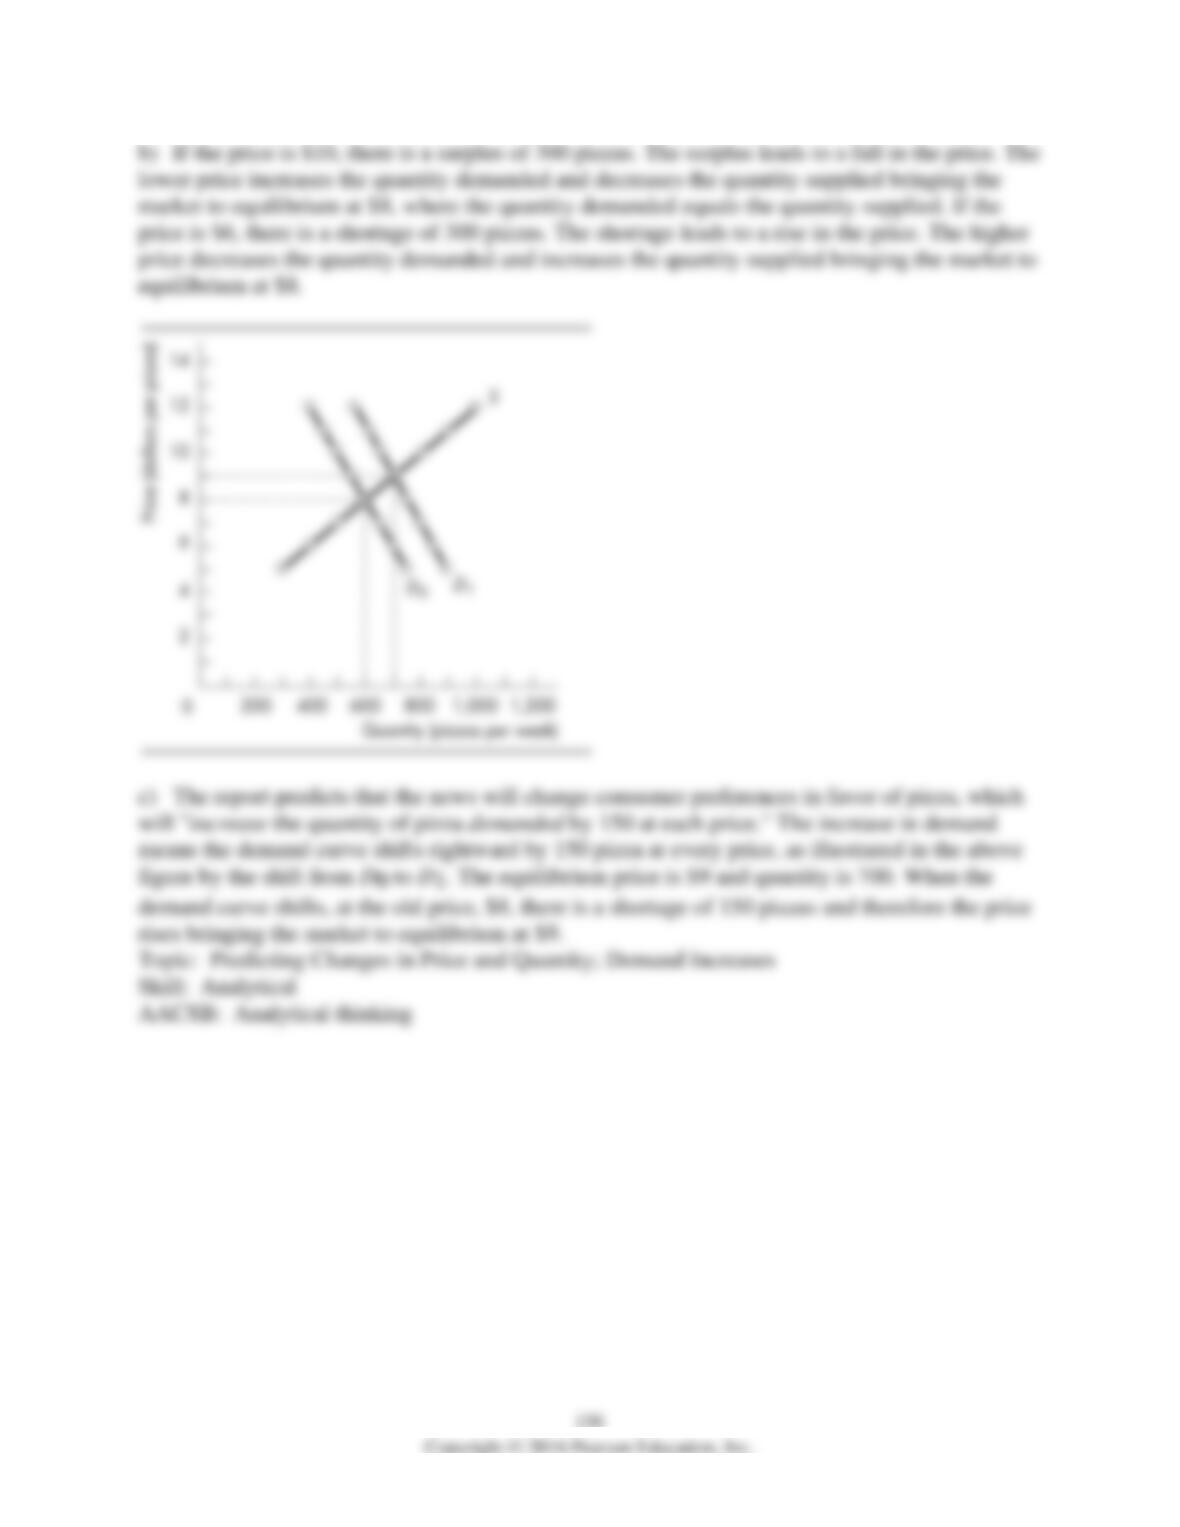
c) The market research report also includes a prediction about the effect on the market for pizza
in Cheeseboro of a recent news published in Cheeseboro Herald. The Herald reported that pizza
has been discovered to help prevent heart diseases. Unfortunately, your dog chewed up the report
and all you can read about the prediction is “quantity… by 150 at each price.” What does the
prediction say? Use your graph to show the predicted effects on the market for pizza. What are
the predicted equilibrium price and quantity? How will the market adjust?