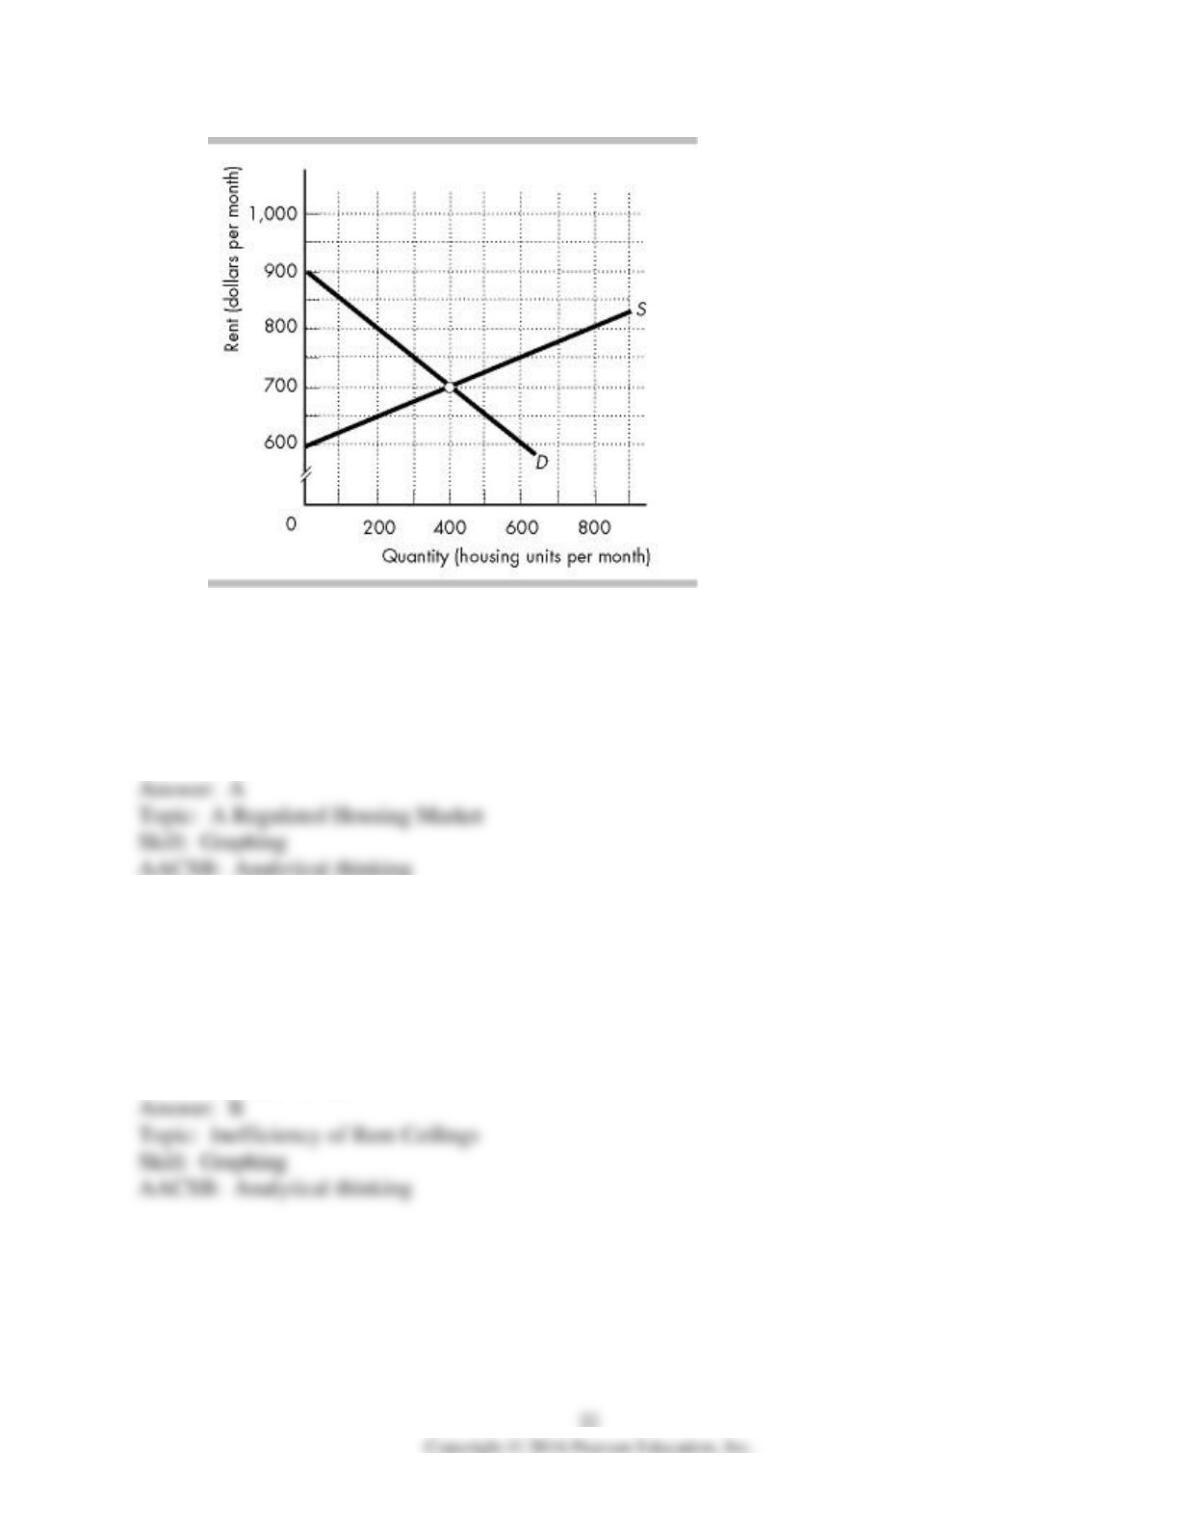
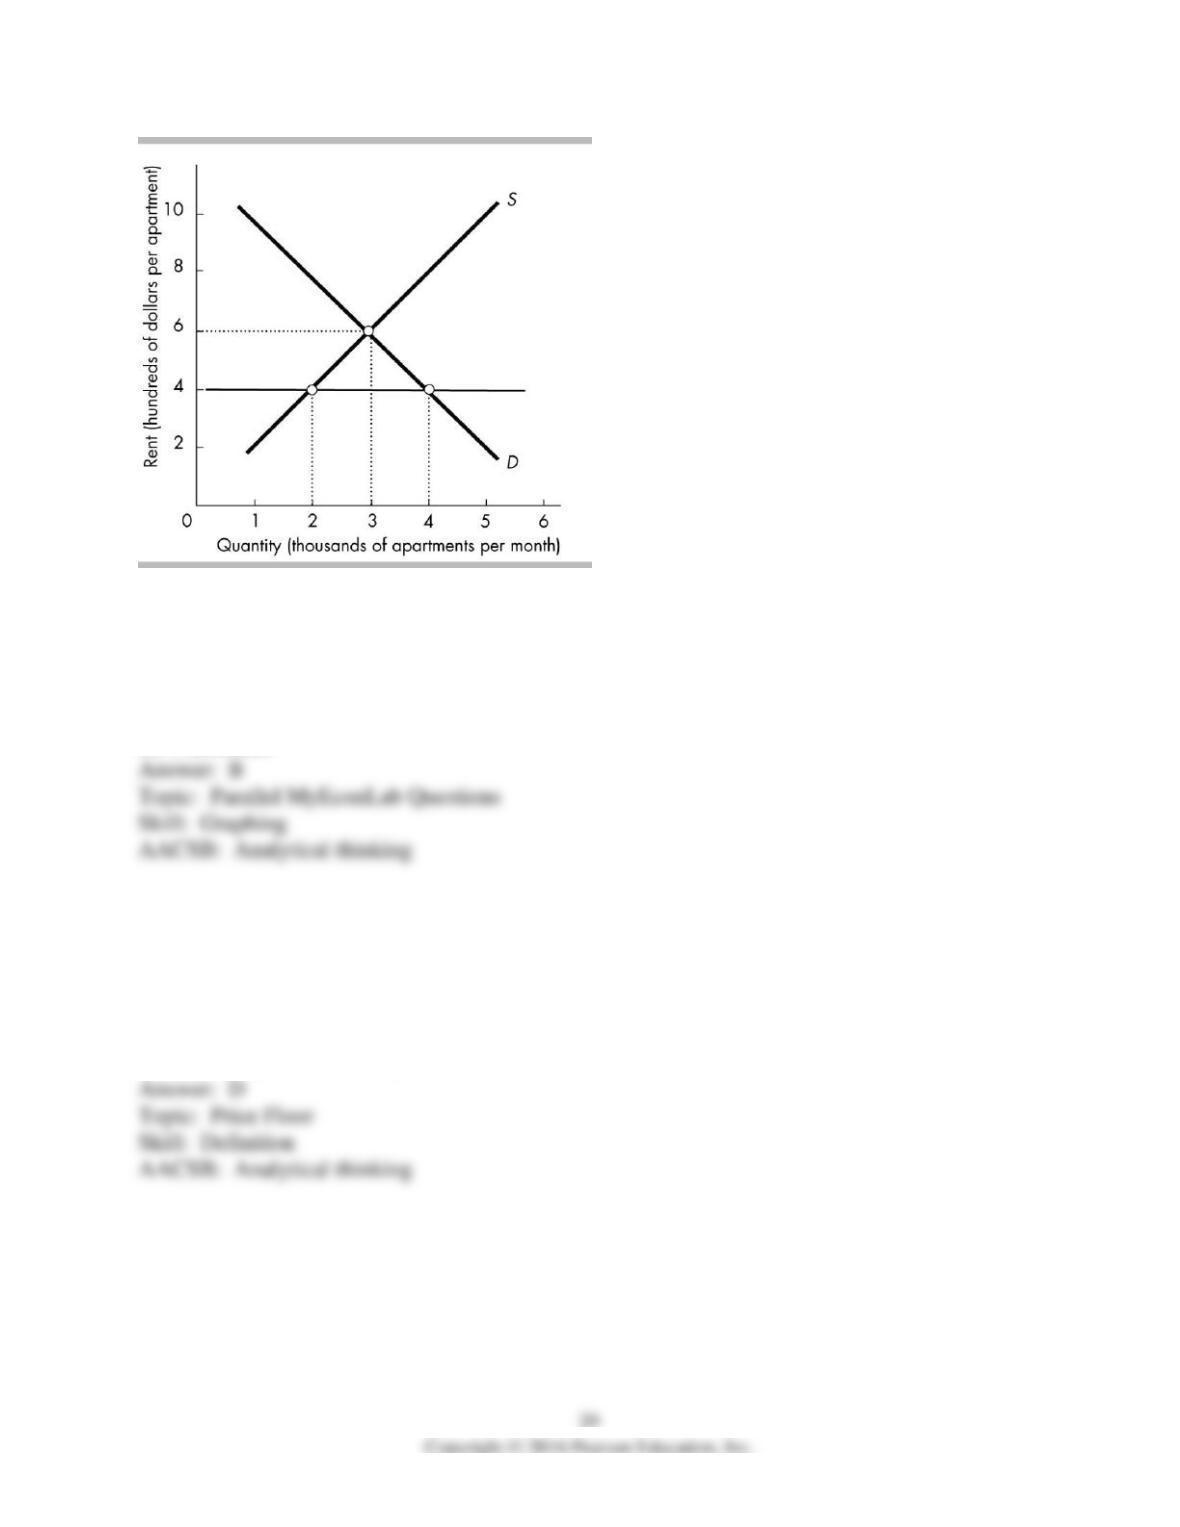
65) The figure above shows the demand for and supply of rental housing in Smallton. If a rent
ceiling is set at $800, there is
A) a shortage of 3,000 units of rental housing.
B) a shortage of 6,000 units of rental housing.
C) a surplus of 3,000 units of rental housing.
D) neither a shortage nor a surplus of rental housing.
66) The figure above shows the demand for and supply of rental housing in Smallton. If a rent
ceiling is set at $400, how many apartment units are rented?
A) 2,000
B) 3,000
C) 4,000
D) None of the above answers is correct.
67) The figure above shows the demand for and supply of rental housing in Smallton. If a rent
ceiling is set at $400, what is the rent?
A) $800
B) $600
C) $400
D) None of the above answers is correct.
68) The figure above shows the demand for and supply of rental housing in Smallton. If a rent
ceiling is set at $400, there is
A) a shortage of 4,000 units of rental housing.
B) a shortage of 2,000 units of rental housing.
C) a surplus of 3,000 units of rental housing.
D) neither a shortage nor a surplus of rental housing.
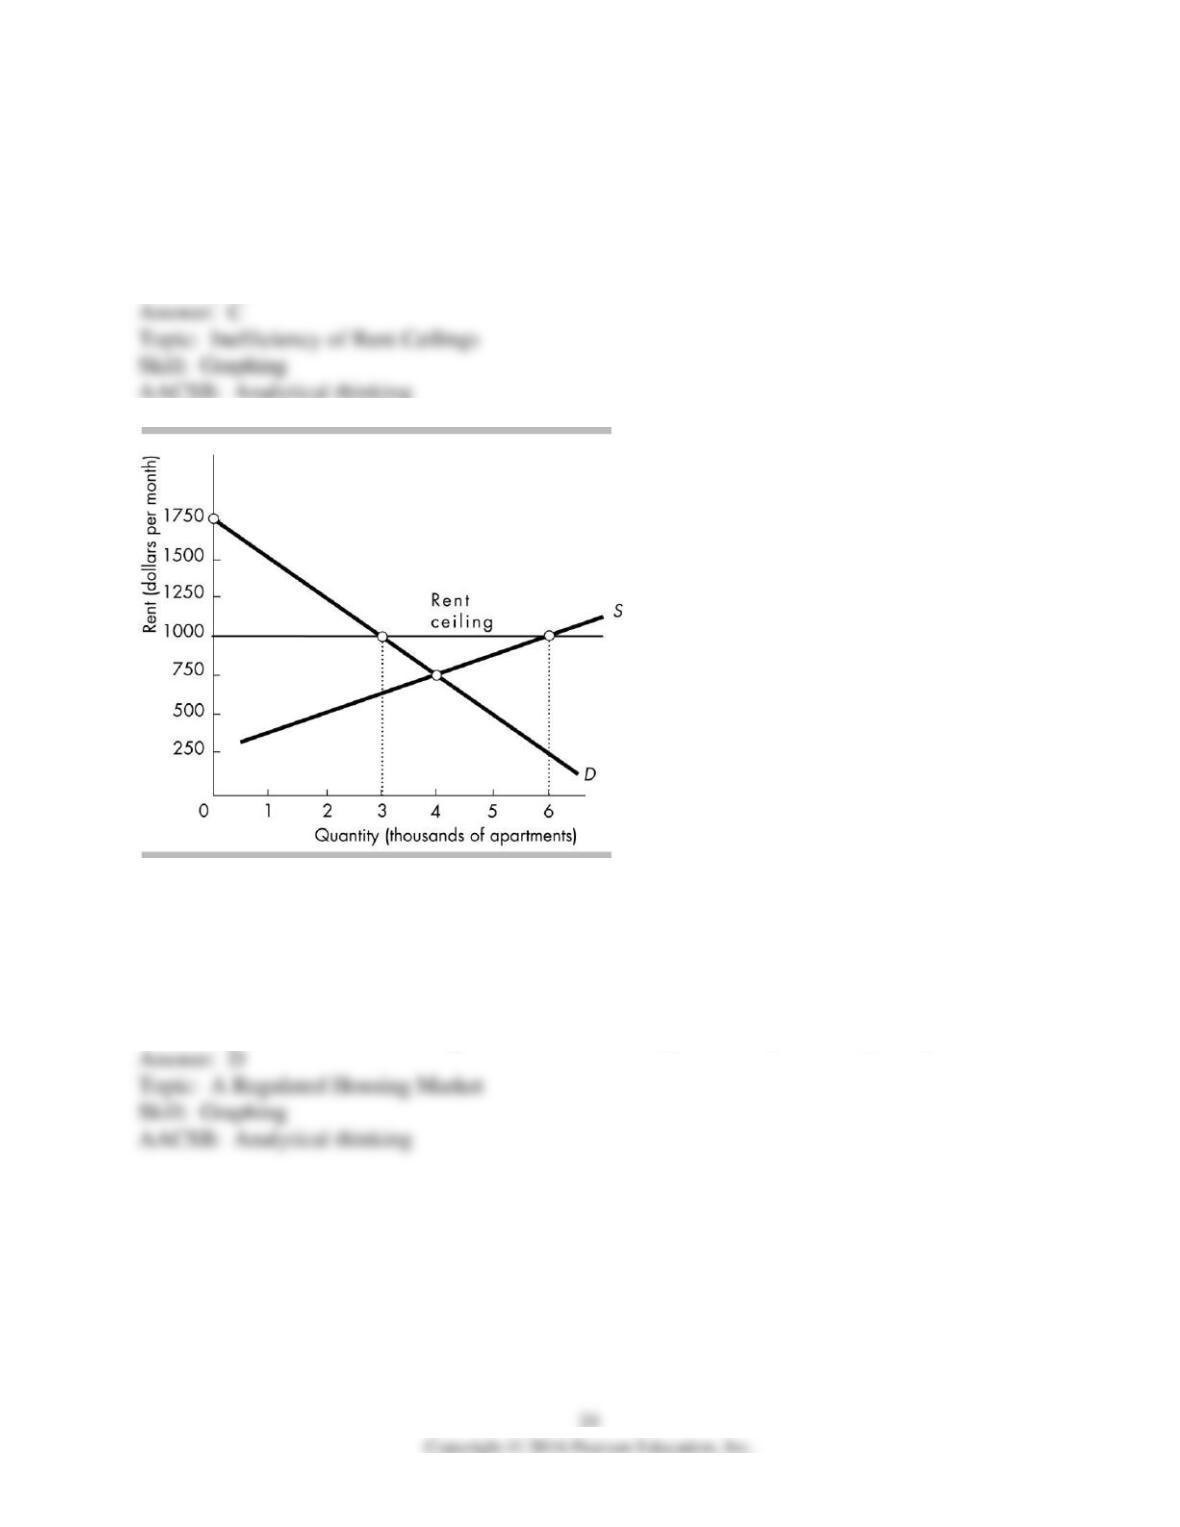
69) The figure above shows the housing market in the city of Appleville. A rent ceiling of $650
per month is imposed. With the rent ceiling, the quantity of housing rented in Appleville is
A) 200 units below the efficient level.
B) 100 units above the efficient level.
C) 300 units below the efficient level.
D) efficient.
70) The figure above shows the housing market in the city of Appleville. A rent ceiling of $650
per month is imposed. With the rent ceiling, the deadweight loss in the Appleville housing
market is
A) zero.
B) at least $15,000 per month.
C) at most $7,500 per month.
D) 300 units per month.
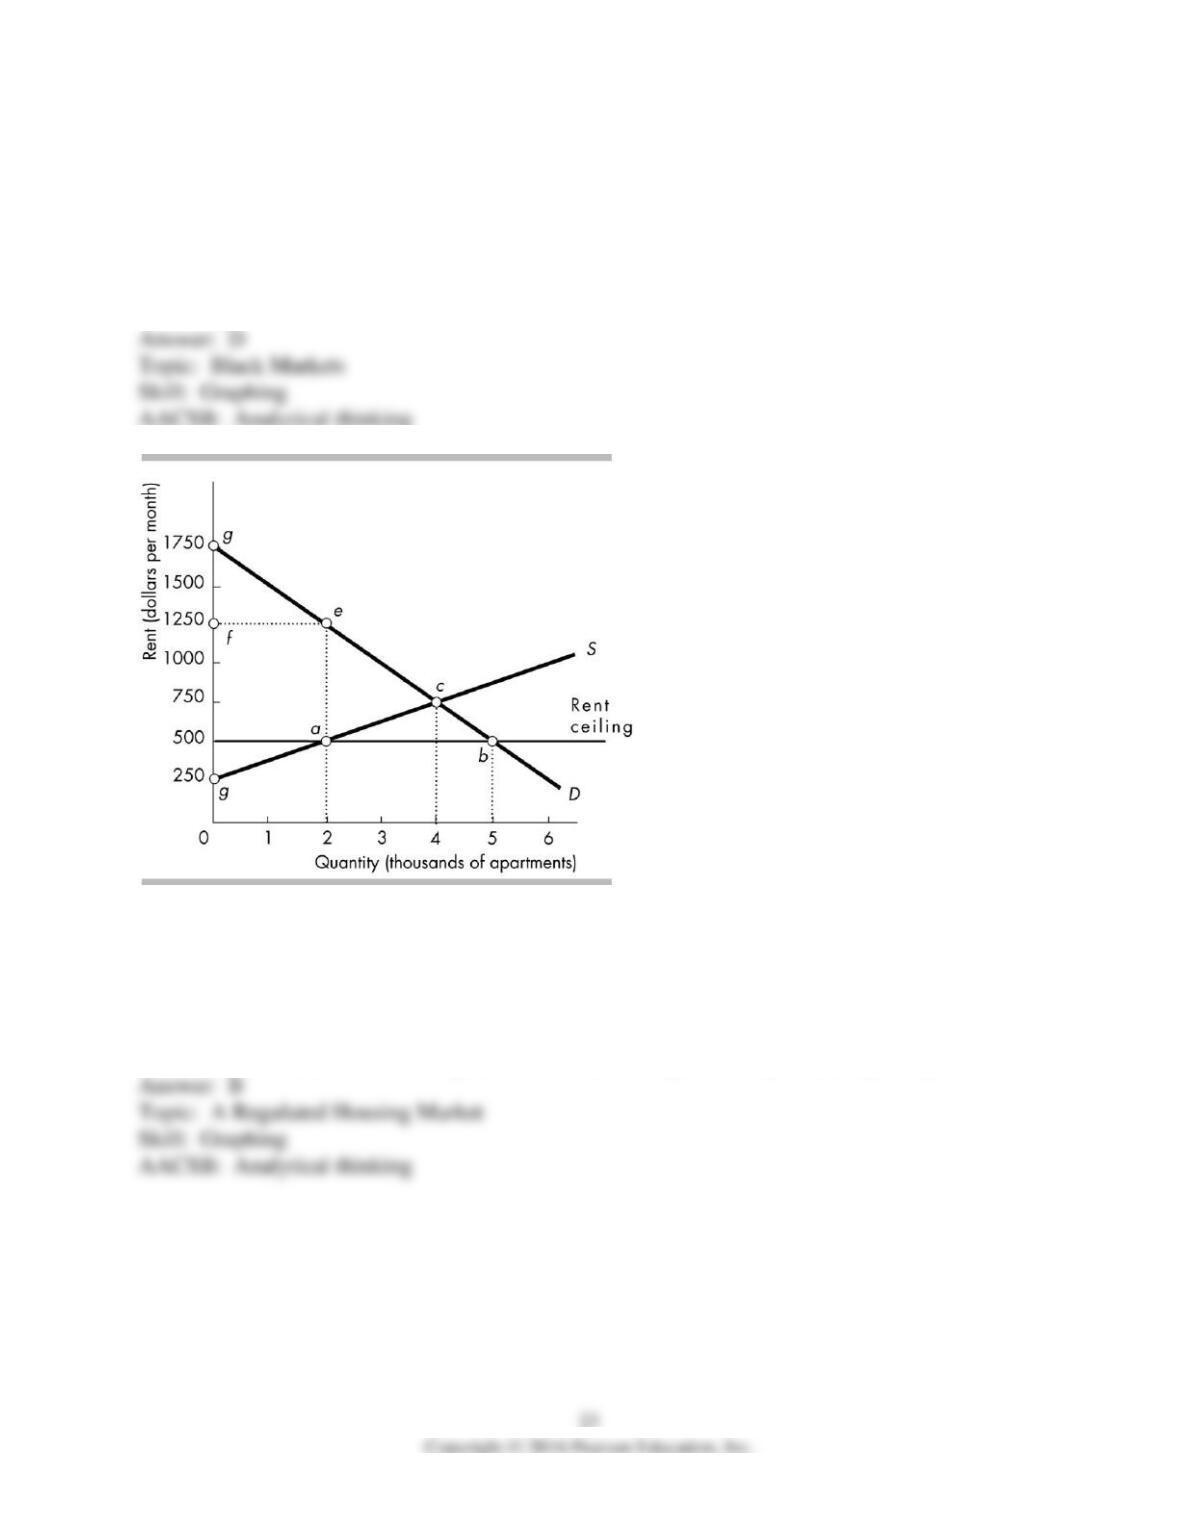
71) The figure above shows the housing market in the city of Appleville. A rent ceiling of $650
per month is imposed. With the rent ceiling, what is the maximum black market rent in
Appleville?
A) $650 per month
B) $700 per month
C) $750 per month
D) $800 per month
72) The above figure shows the demand and supply curves for housing. What would be the
effects of a rent ceiling equal to $500 per month?
A) a surplus equal to 3,000 apartments
B) a shortage equal to 3,000 apartments
C) a shortage equal to 250 apartments
D) nothing because the rent ceiling has no effect on the equilibrium price and quantity
73) The above figure shows the demand and supply curves for housing As a result of a rent
ceiling at $500, the deadweight loss is represented by the area
A) rectangle feag.
B) triangle gfe.
C) triangle eca.
D) triangle acb.
74) The above figure shows the demand and supply curves for housing in City B. What would be
the effects of a rent ceiling equal to $1000 per month?
A) a surplus equal to 3000 apartments
B) a surplus equal to 250 apartments
C) a shortage equal to 3000 apartments
D) nothing because the rent ceiling has no effect on the equilibrium price and quantity
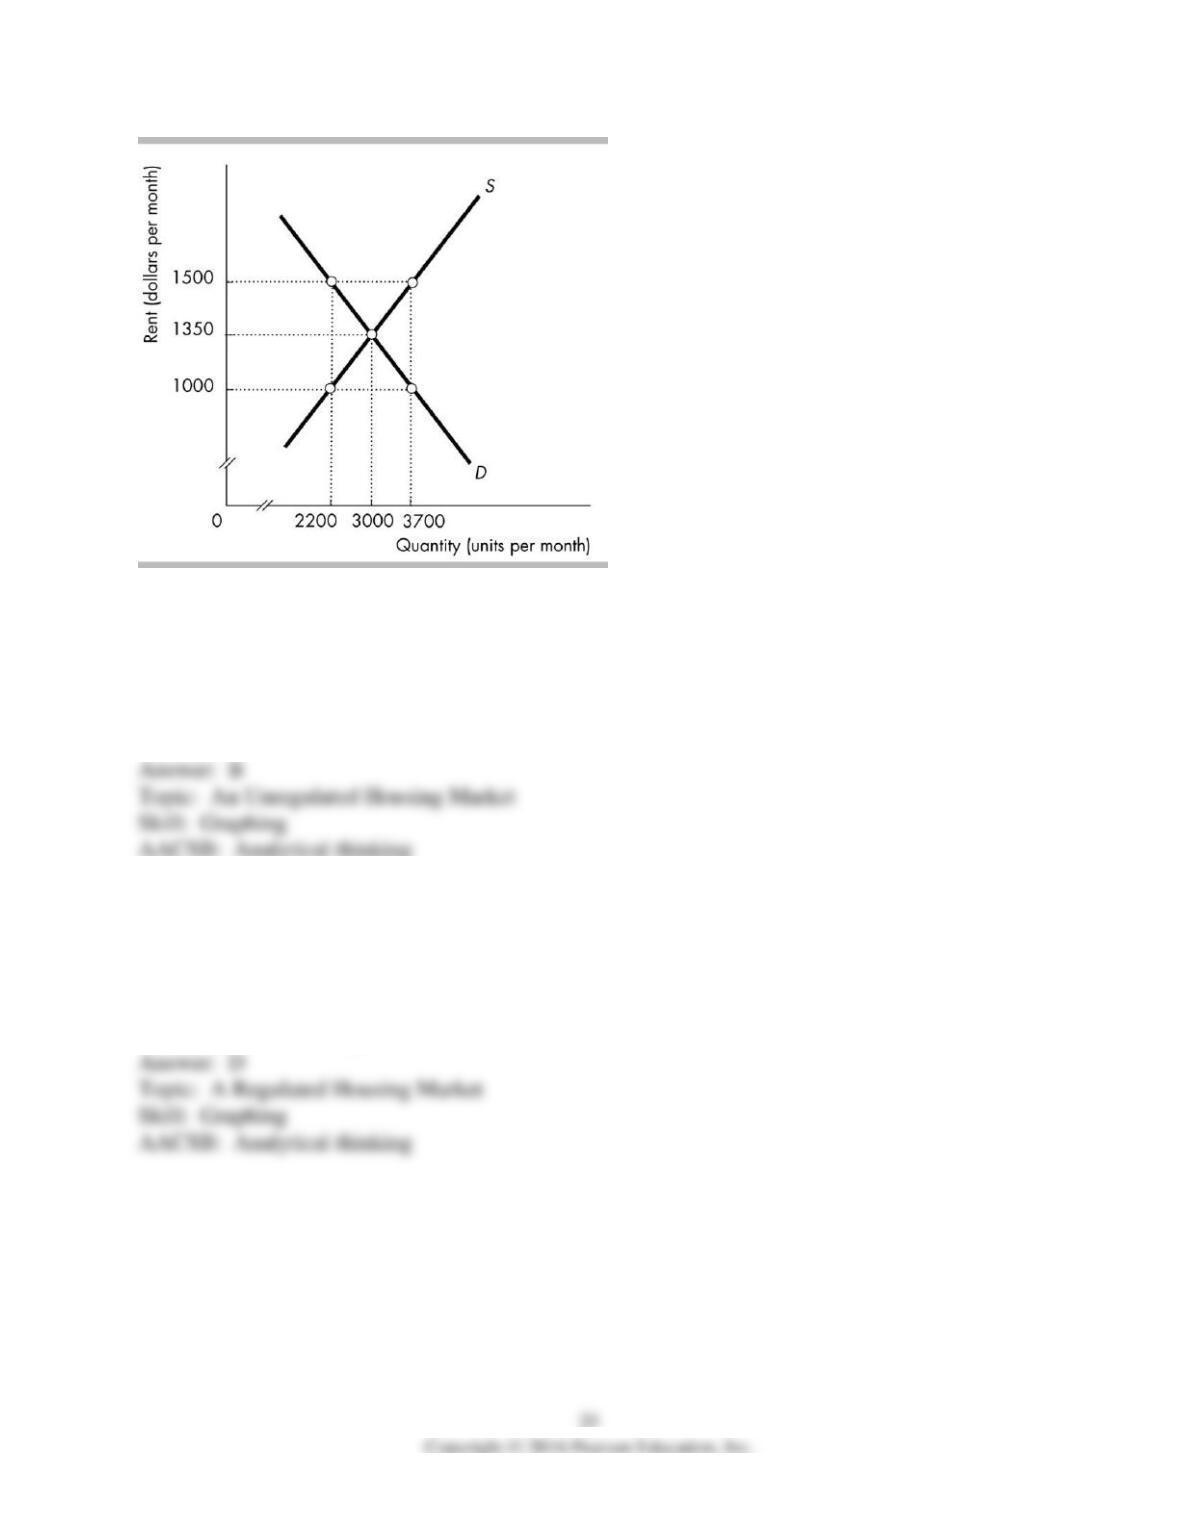
75) The above figure shows the apartment market in Big City. What is the equilibrium rent in
Big City?
A) $1500
B) $1350
C) $1250
D) $1125
76) The above figure shows the apartment market in Big City. What could the Big City Housing
Authority do if it wants to reduce the rents paid by its citizens?
A) impose a rent floor above $1350
B) impose a rent floor below $1350
C) impose a rent ceiling above $1350
D) impose a rent ceiling below $1350
77) The above figure shows the apartment market in Big City. If a government policy results in a
shortage of 1,500 apartments in the Big City rental market, it is most likely that the Housing
Authority has imposed
A) a rent ceiling of $1500.00 monthly.
B) a rent ceiling of $1000.00 monthly.
C) a rent floor of $1500.00 monthly.
D) a rent floor of $1000.00 monthly.
78) The above figure shows the apartment market in Big City. A rent ceiling of $1400 per month
would
A) create a black market.
B) increase search activity.
C) not affect the market.
D) create a surplus of apartments.
79) The above figure shows the apartment market in Big City. A rent ceiling of $1100 would
A) not create a black market.
B) create a shortage of apartments.
C) decrease search activity.
D) shift the supply curve rightward.
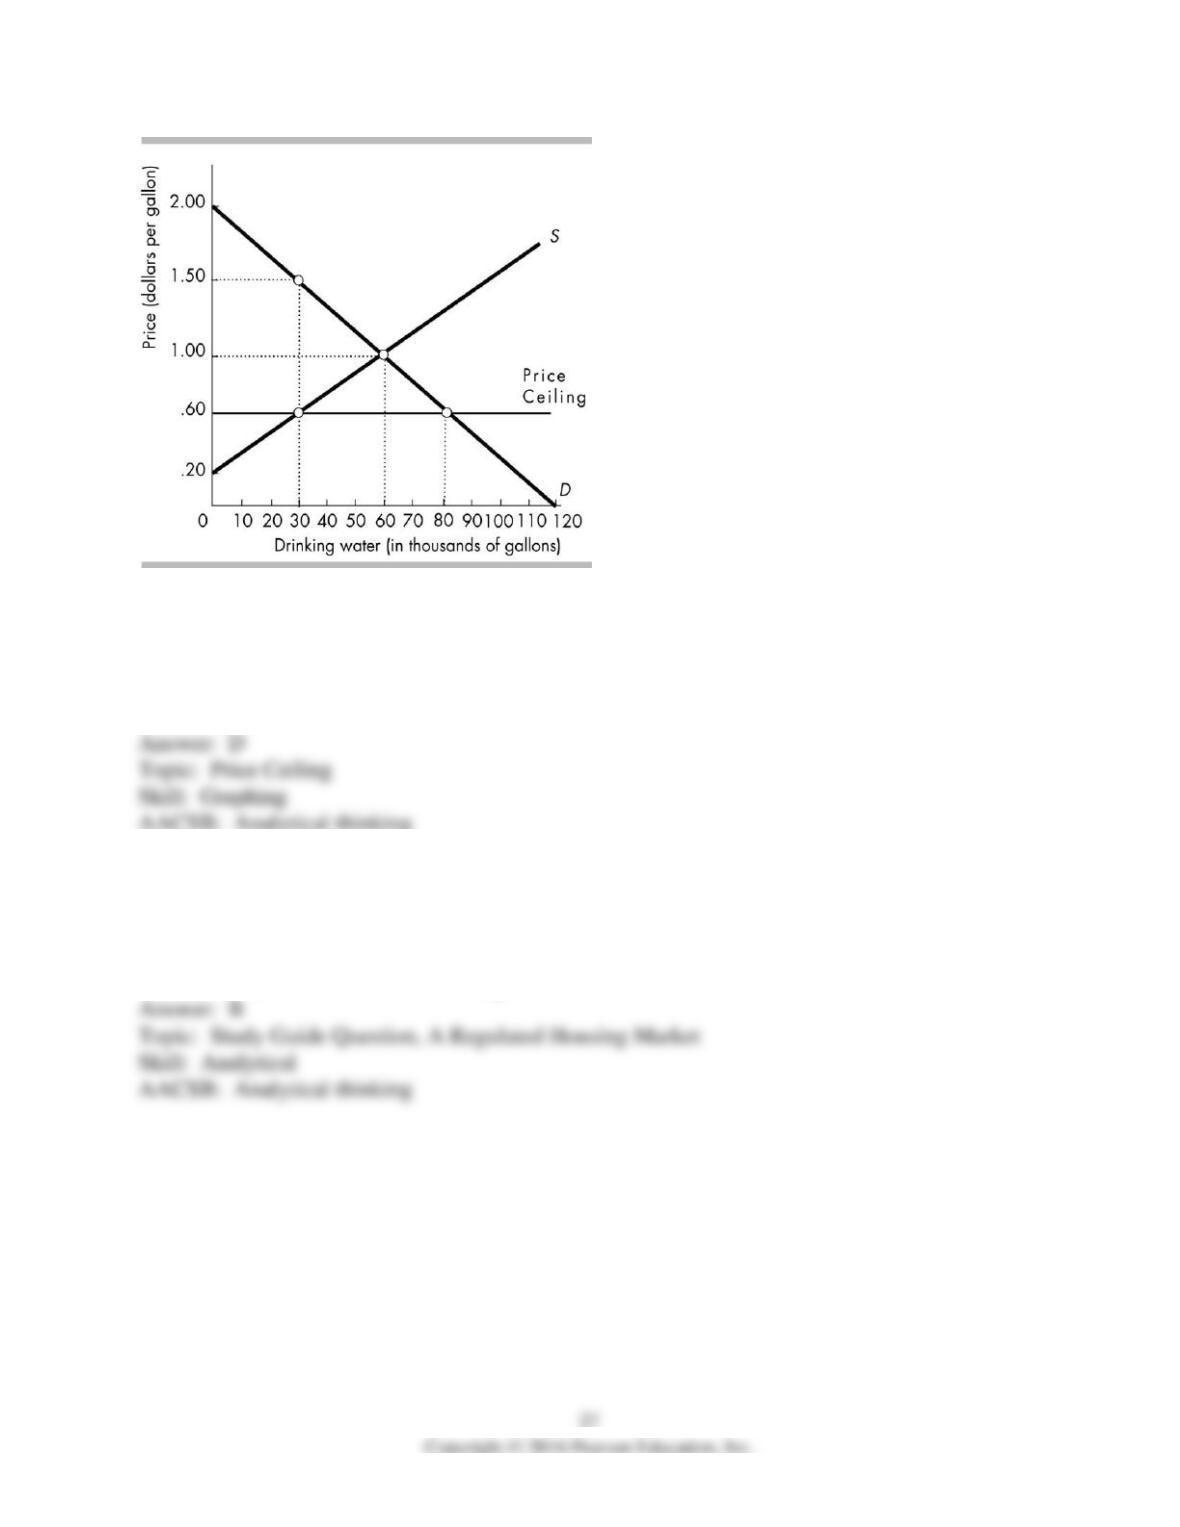
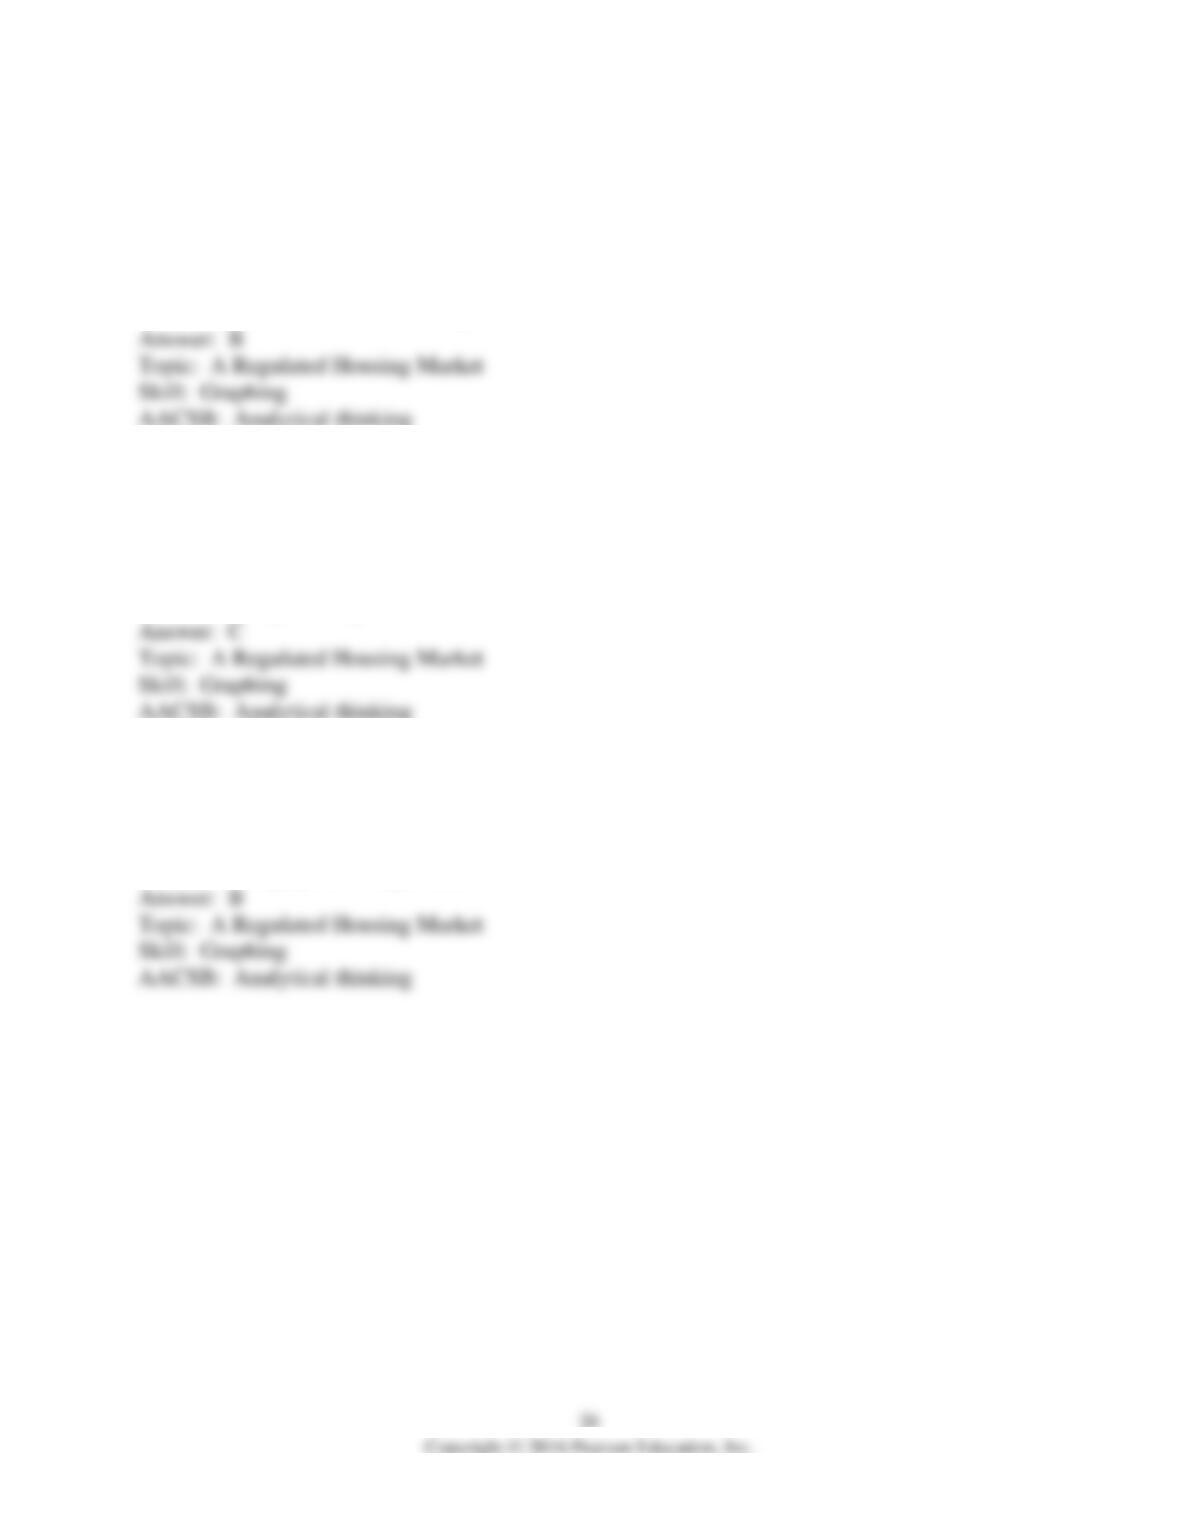
80) The price ceiling depicted in the above figure results in
A) consumer surplus increasing from $30 thousand to $34.5 thousand.
B) producer surplus decreasing from $24 thousand to $6 thousand.
C) a deadweight loss of $16 thousand.
D) Both answers A and B are correct.
81) Which of the following is a likely outcome of rent ceilings?
A) a surplus of rent-controlled housing
B) waiting lists of potential renters of rent-controlled housing
C) construction of more rental housing
D) black market rents below the ceiling rent
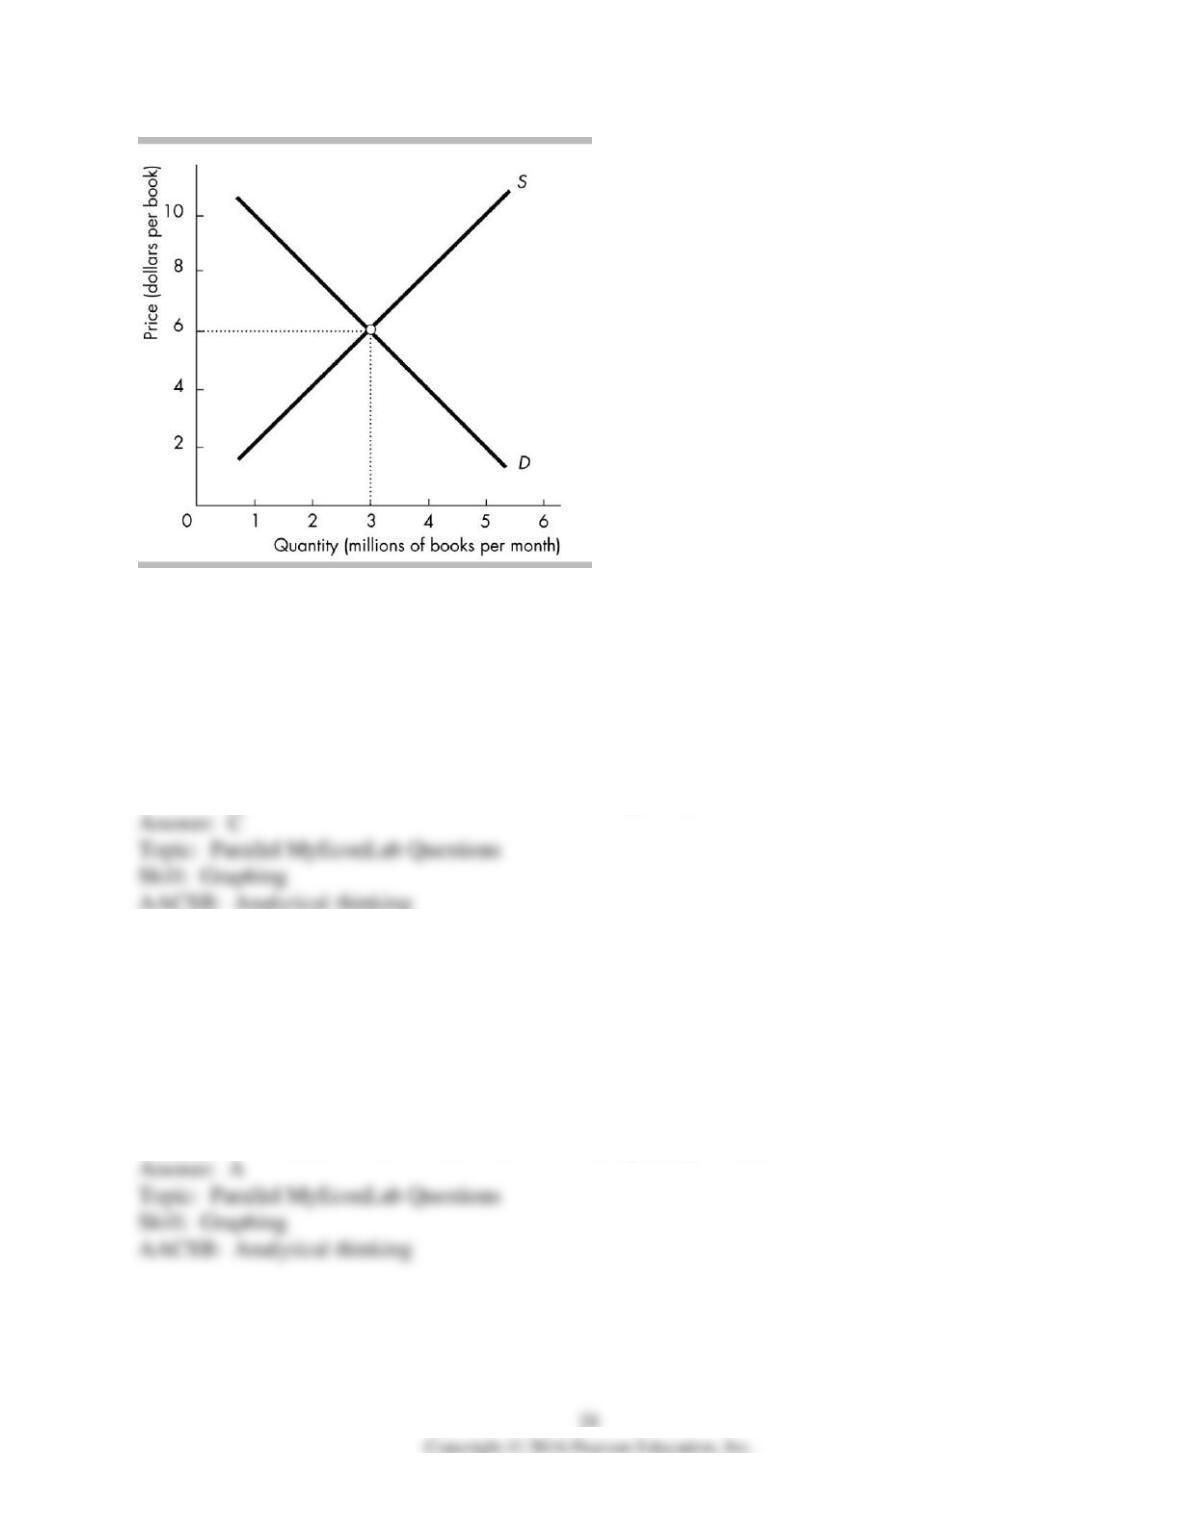
82) In the above figure, the equilibrium price of a paperback book is $6 per book and the
equilibrium quantity is 3 million books. The National Literature Board convinces the
government to impose a price ceiling of $3 per book. At this price, the quantity of books
supplied to the market will be
A) 3 million a month and will equal the quantity demanded.
B) less than 3 million a month and will exceed the quantity demanded.
C) less than 3 million a month and will be less than the quantity demanded.
D) more than 3 million a month and will exceed the quantity demanded.
83) In the above figure, the equilibrium price of a paperback book is $6 per book and the
equilibrium quantity is 3 million books. The National Literature Board convinces the
government to impose a price ceiling of $6 per book. At this price, the quantity of books
supplied to the market will be
A) 3 million a month and will equal the quantity demanded.
B) less than 3 million a month and will exceed the quantity demanded.
C) less than 3 million a month and will be less than the quantity demanded.
D) more than 3 million a month and will exceed the quantity demanded.
84) The figure above illustrates a rental housing market in which there is a rent ceiling of $400 a
month. The rent ceiling is strictly enforced. The number of apartments rented is
A) less than 2 thousand.
B) 2 thousand.
C) 3 thousand.
D) 4 thousand.
2 A Labor Market With a Minimum Wage
1) A price floor is a price
A) below which a seller cannot legally sell.
B) above which a seller cannot legally sell.
C) that creates a surplus of the good if it is set above the equilibrium price.
D) Both answers A and C are correct.
2) A price floor
A) always results in a surplus.
B) always results in a shortage.
C) results in a surplus if the floor price is higher than the equilibrium price.
D) results in a shortage if the floor price is higher than the equilibrium price.
3) An example of a price floor is a
A) rent control.
B) minimum wage.
C) subsidy.
D) quota.
4) A minimum wage ________.
A) is a price ceiling in the labor market
B) changes the demand for labor.
C) is an effective way of increasing employment
D) is a price floor in the labor market
5) The CBS news correspondent Bill Whitaker discussed the high level of unemployment among
teens, especially during the summer months. In 2011, unemployment among the population as a
whole was 9.1 percent, but among teens it was close to 24 percent. Many of these teens were
hoping to get entry level jobs as small businesses. (Source: CBS news, June 4, 2011)
A minimum wage set above the equilibrium wage rate is called
A) a price floor.
B) a price ceiling.
C) quota.
D) subsidy.
6) The minimum wage
A) is type of price ceiling.
B) is a type of price floor.
C) can create a surplus of labor.
D) Both answers A and C are correct.
7) If policy makers believe that the equilibrium wage rate is too low, policy makers can raise
wages by legislating a minimum wage, that is, a wage
A) ceiling above the equilibrium wage.
B) ceiling below the equilibrium wage.
C) floor above the equilibrium wage.
D) floor below the equilibrium wage.
8) A minimum wage set above the equilibrium wage rate is a price
A) ceiling that results in a shortage of low-skilled labor.
B) ceiling that results in a surplus of low-skilled labor.
C) floor that results in a shortage of low-skilled labor.
D) floor that results in a surplus of low-skilled labor.
9) A minimum wage is a government-imposed price ________ that is designed to be ________
the equilibrium wage rate.
A) ceiling; above
B) ceiling; below
C) floor; above
D) floor; below
10) A minimum wage set above the equilibrium wage will
A) create a shortage of labor.
B) create a surplus of labor.
C) have no effect because the equilibrium level of employment is not affected by a minimum
wage above the equilibrium wage.
D) create a lower wage rate for skilled workers than for unskilled workers.
11) When a minimum wage is set above the equilibrium wage rate, ________.
A) the supply of low-skilled workers decreases and the supply curve shifts rightward
B) unemployment increases
C) search activity decreases
D) the supply of low-skilled workers increases and the supply curve shifts leftward
12) A minimum wage set above the equilibrium wage rate for low-skilled workers ________.
A) creates more employment opportunities for low-skilled workers
B) creates more prosperity among younger people
C) creates unemployment among low-skilled workers
D) increases the number of good paying jobs available to young people
13) A minimum wage set above the equilibrium wage
I. increases the supply of labor.
II. increases the quantity of labor supplied.
III. decreases the demand for labor.
A) I only
B) II only
C) I and II only
D) I, II, and III
14) A minimum wage set above the equilibrium wage rate is a price ________ that ________ the
quantity of low-skilled labor demanded.
A) ceiling; decreases
B) ceiling; increases
C) floor; decreases
D) floor; increases
15) When the minimum wage is set above the equilibrium wage rate, the number of hours of
labor employed is determined by the ________ and the ________.
A) supply of labor; minimum wage
B) demand for labor; supply of labor
C) supply of and demand for labor; the minimum wage
D) demand for labor; minimum wage
16) The government sets a price floor for corn which is above the equilibrium price of corn. As a
result, ________.
A) the corn market will be efficient
B) a deadweight loss will be created
C) a shortage of corn will be created
D) none of the above answers is correct
17) Suppose that the equilibrium wage in the low-skilled labor market is $9.25. Further, suppose
the federal government raises the minimum wage to $9.00 an hour from its present level of
$8.15. The government’s action of increasing the minimum wage will result in
A) a decrease in unemployment.
B) an increase in unemployment.
C) a shortage of low-skilled labor.
D) neither a shortage nor a surplus of labor in the low-skilled labor market.
18) Suppose the equilibrium wage is $10 per hour. A minimum wage is a ________ and affects
employment if it is set at ________.
A) price floor; $12 per hour
B) price floor; $8 per hour
C) price ceiling; $10 per hour
D) price ceiling; $12 per hour
19) If a minimum wage is set above the equilibrium wage rate, employment
A) will increase.
B) will not change.
C) will decrease.
D) may increase, decrease or not change depending on how the supply of labor is affected by the
minimum wage.
20) Imposing a minimum wage that is above the equilibrium wage rate results in
A) higher job search costs.
B) lower unemployment.
C) the labor market becoming more efficient.
D) equilibrium in the labor market.
21) If the minimum wage is set above the equilibrium wage, a supply and demand diagram of the
low-skilled labor market will show unemployment as
A) a vertical distance.
B) a horizontal distance.
C) the area of a rectangle.
D) the area of a triangle.
Wage rate
(dollars per
hour)
Labor
supplied
(millions of
workers)
Labor demanded
(millions of
workers
11
6
4
10
5
5
9
4
6
8
3
7
7
2
8
22) In the table above, what is the equilibrium wage rate in an unregulated market?
A) $8.00 per hour
B) $9.00 per hour
C) $10.00 per hour
D) $11.00 per hour
23) In the table above, what is the level of unemployment (in millions of workers) if the
minimum wage is set at $8 per hour?
A) 0
B) 1
C) 3
D) 4
24) In the table above, the market is in equilibrium. Then a minimum wage is set at $11 per hour.
The number of unemployed workers will be
A) 0.
B) 2 million.
C) 4 million.
D) 6 million.
25) In the table above, the market is in equilibrium. Then a minimum wage is set at $11 per hour.
The number of workers who lose their jobs will be
A) 0.
B) 1 million.
C) 3 million.
D) 5 million.
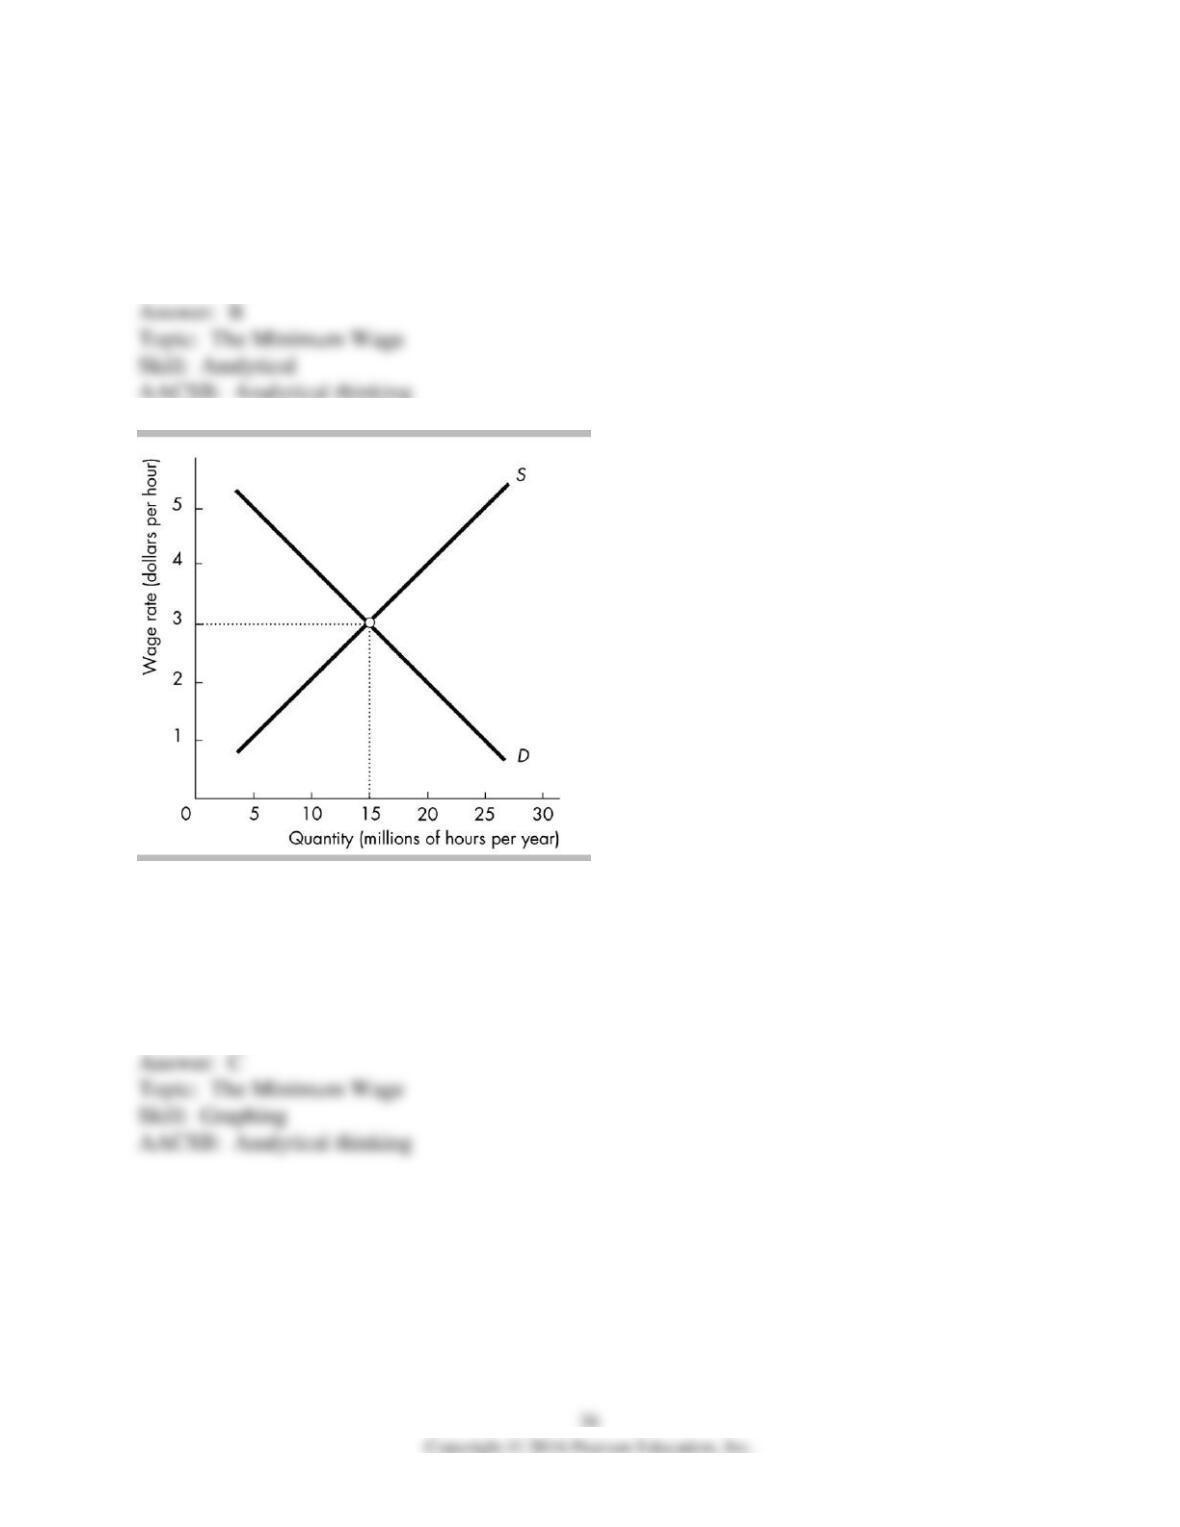
26) The above figure shows the labor market in an undeveloped nation. A minimum wage has an
effect on the market for low-skilled labor if it is set at
A) $2.00.
B) $3.00.
C) $4.00.
D) all of the above
27) The above figure shows the labor market in an undeveloped nation. If the minimum wage is
set at $5.00 per hour, what effect will it have on the market for low-skilled labor?
A) The minimum wage will have no effect when set above the equilibrium wage rate.
B) The minimum wage will create a surplus of low-skilled labor.
C) The minimum wage will create a shortage of low-skilled labor.
D) The minimum wage will attract more labor to the low-skilled labor market and cause the
wage rate to fall.
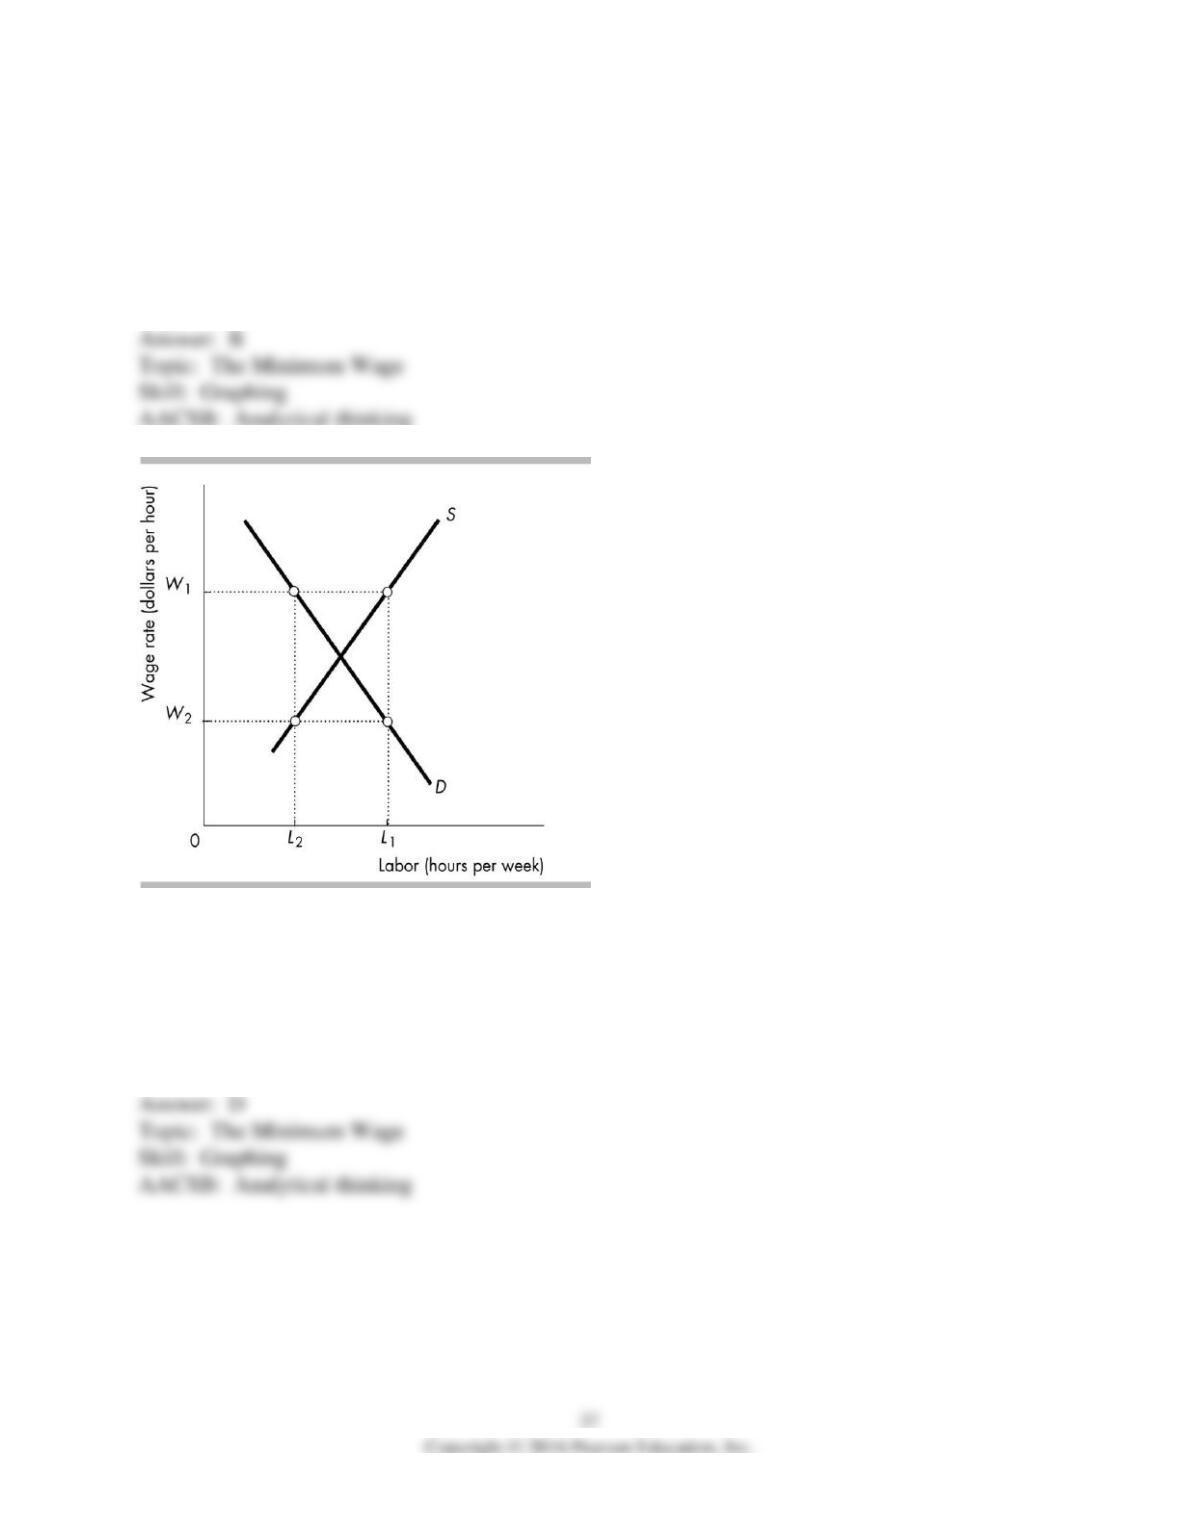
28) In the above figure, a minimum wage of ________ would result in employment of
________.
A) W2; L1
B) W2; L2
C) W1; L1
D) W1; L2
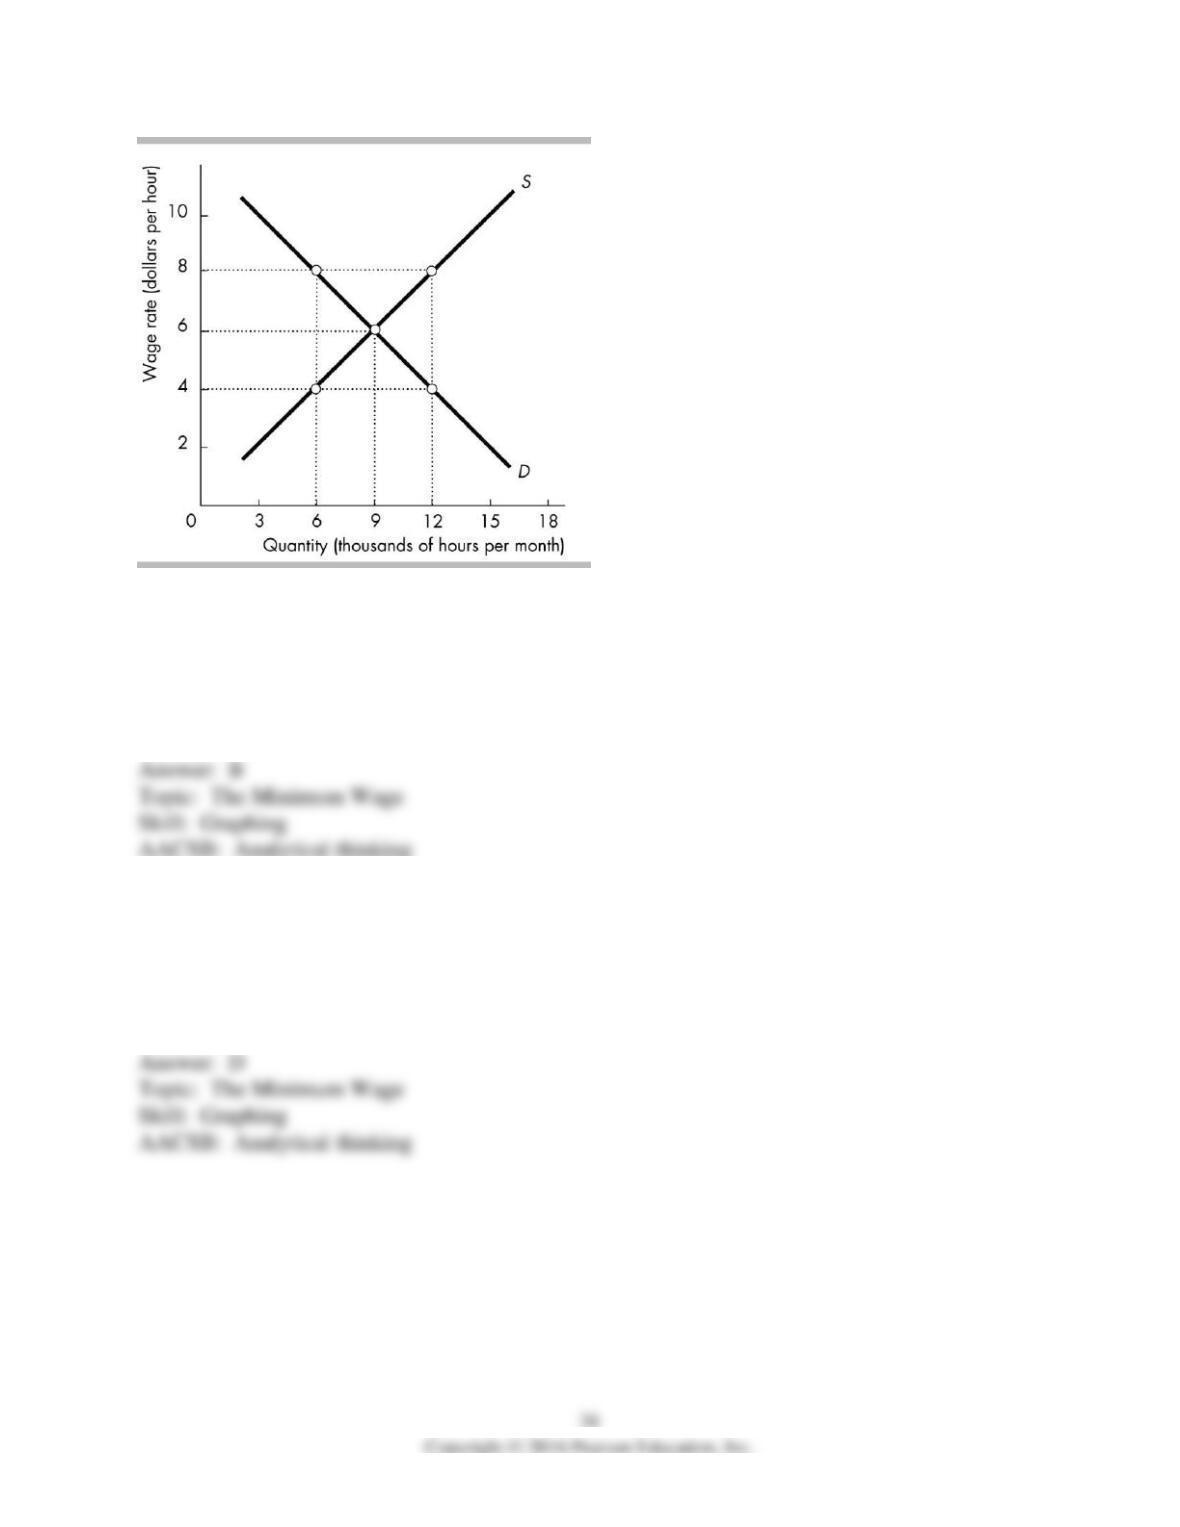
29) The figure above shows the demand for and supply of labor of students in Smallville. If the
minimum wage is set at $4 per hour, how many hours do students work?
A) 12,000 hours
B) 9,000 hours
C) 6,000 hours
D) None of the above answers is correct.
30) The figure above shows the demand for and supply of labor of students in Smallville. If the
minimum wage is set at $4 per hour, how many hours of students’ labor are unemployed?
A) 12,000 hours
B) 9,000 hours
C) 6,000 hours
D) 0 hours

31) The figure above shows the demand for and supply of labor of students in Smallville. If the
minimum wage is set at $6 per hour, how many hours do students work?
A) 12,000 hours
B) 9,000 hours
C) 6,000 hours
D) None of the above answers is correct.
32) The figure above shows the demand for and supply of labor of students in Smallville. If the
minimum wage is set at $6 per hour, how many hours of students’ labor are unemployed?
A) 12,000 hours
B) 9,000 hours
C) 6,000 hours
D) 0 hours
33) The figure above shows the demand for and supply of labor of students in Smallville. If the
minimum wage is set at $8 per hour, how many hours do students work?
A) 12,000 hours
B) 9,000 hours
C) 6,000 hours
D) None of the above answers is correct.
34) The figure above shows the demand for and supply of labor of students in Smallville. If the
minimum wage is set at $8 per hour, how many hours of students’ labor are unemployed?
A) 12,000 hours
B) 9,000 hours
C) 6,000 hours
D) 0 hours
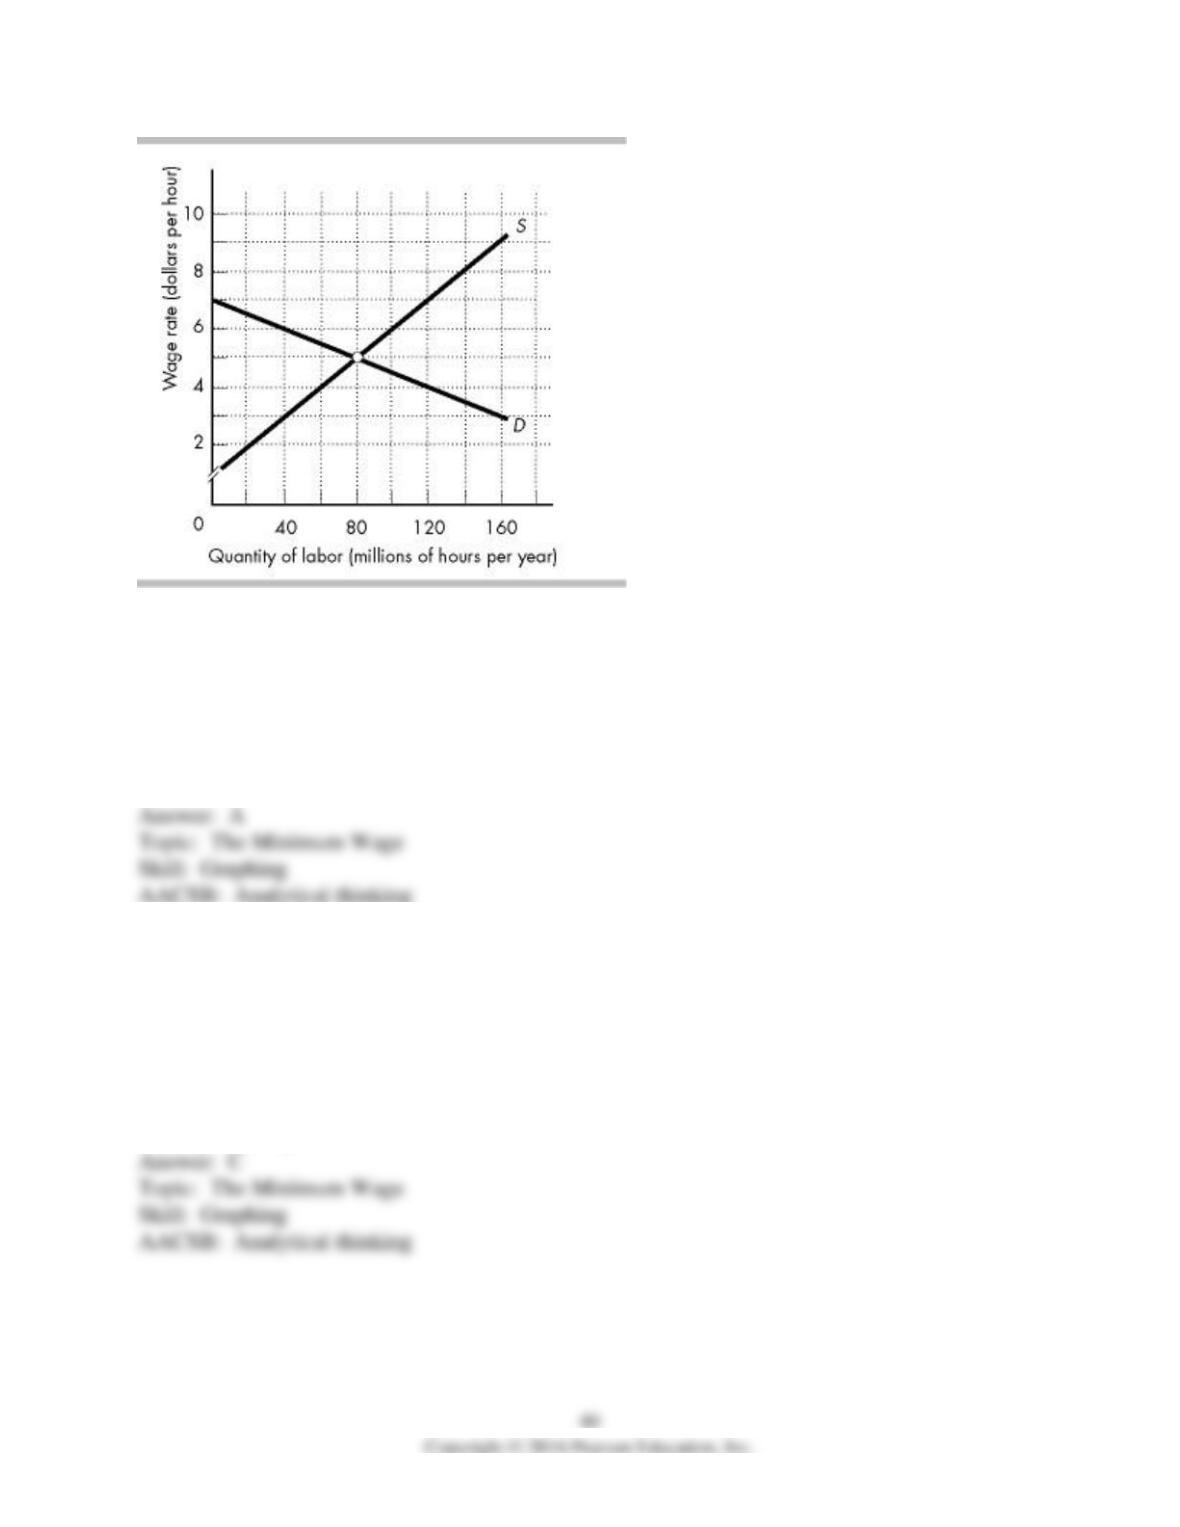
35) The figure above shows the market for low-skilled labor in Midland city. The government
sets a minimum wage at $6 per hour. The minimum wage ________ the employers’ surplus by
________ million per year.
A) decreases; $60
B) decreases; $120
C) increases; $40
D) increases; $100
36) The figure above shows the market for low-skilled labor in Midland city. The government
sets a minimum wage at $6 per hour. With the minimum wage law enacted, at the quantity of
labor employed, the value to the firm of last worker hired is ________ the wage rate for which
that person is willing to work.
A) the same as
B) $3 per hour less than
C) $3 per hour greater than
D) $1 per hour greater