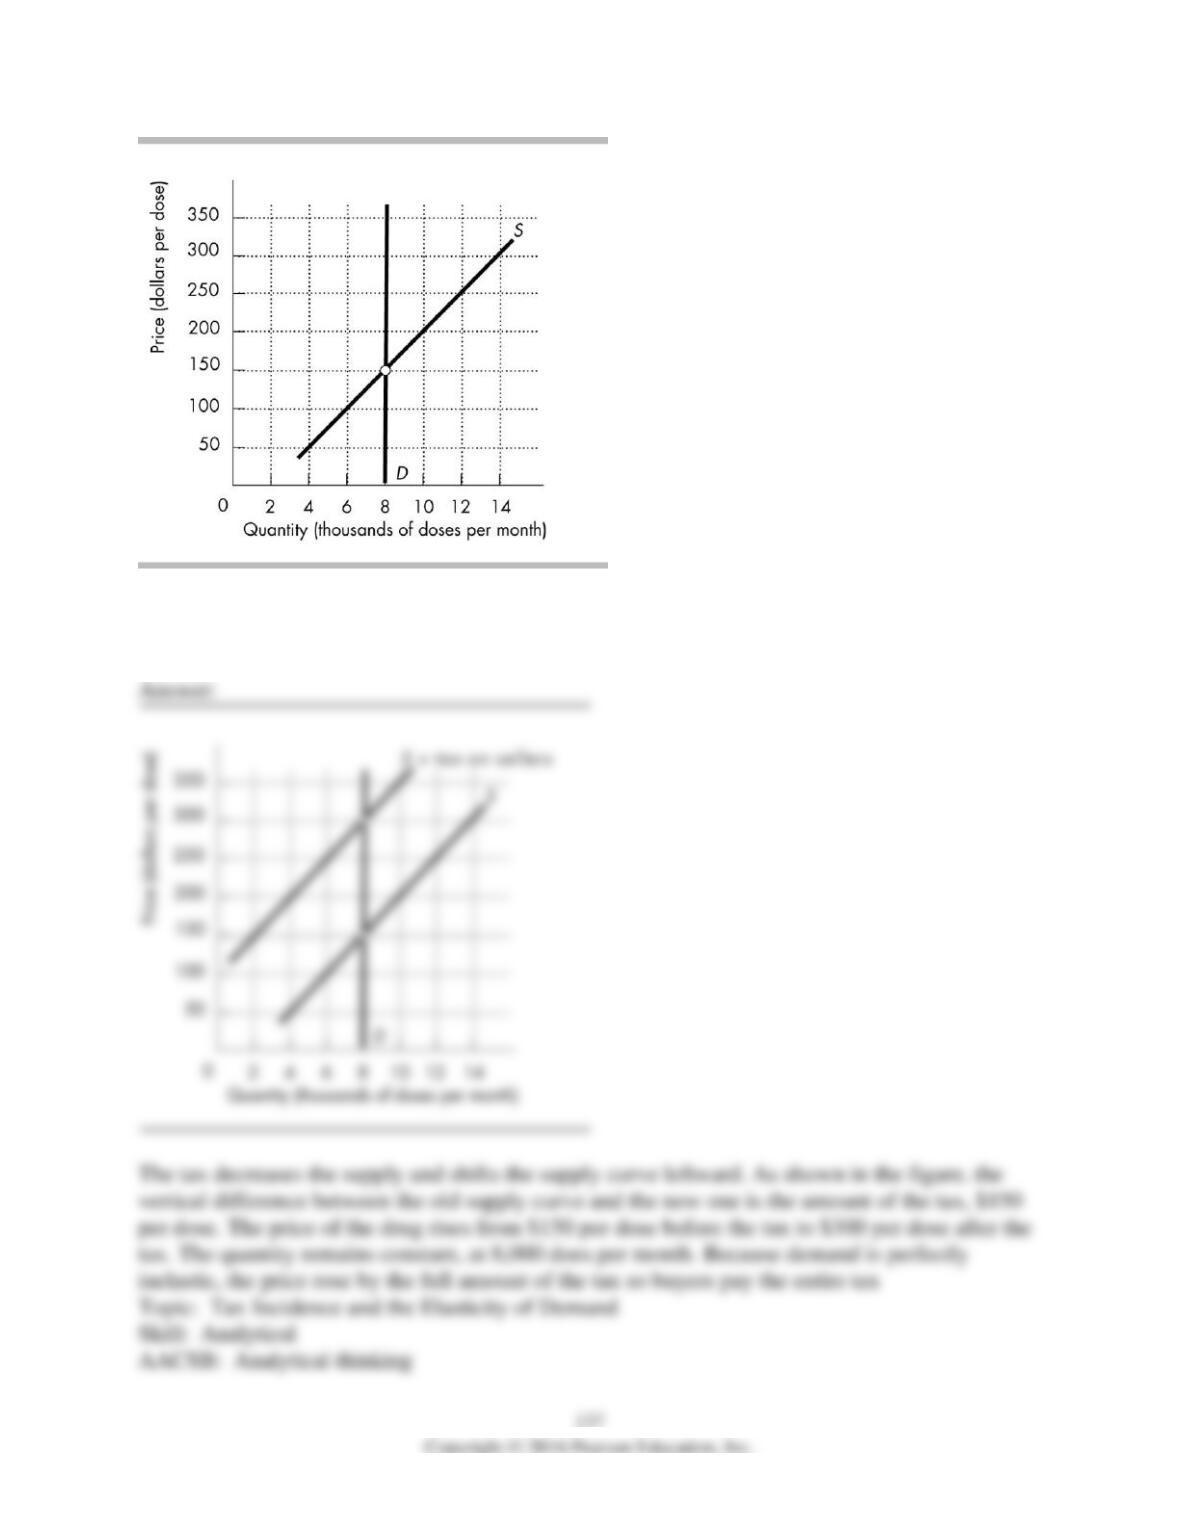
12) The figure above shows the market for a life-saving drug. Suppose the government imposes a
$150 tax per dose on sellers of the drug. Show and describe the impact on the market. Who pays
this tax?
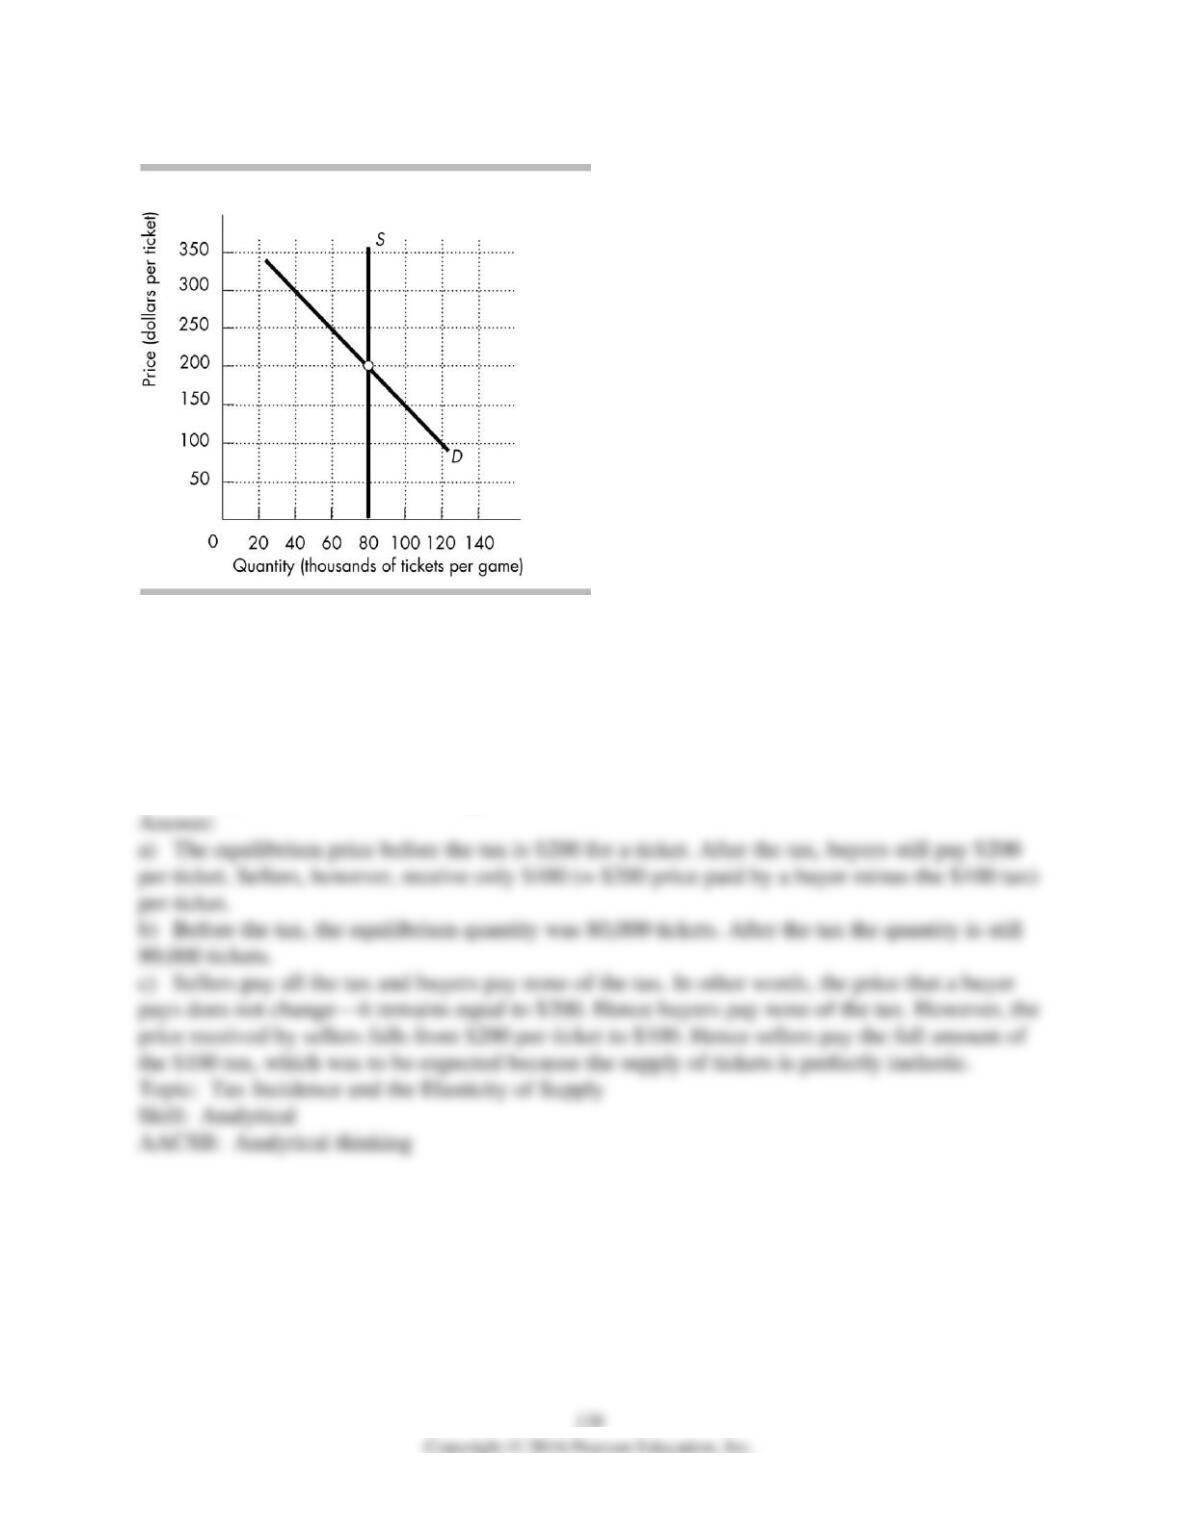
13) The figure above shows the market for tickets to the Super Bowl the day of the game.
Suppose the government imposes an entertainment tax of $100 per ticket.
a) What is the equilibrium price of a Super Bowl ticket before the tax? What is the price paid by
buyers after the tax? What is the price received by sellers after the tax?
b) What is the equilibrium quantity of tickets before the tax? What is the equilibrium quantity
after the tax?
c) Do buyers or sellers bear the largest incidence of the tax?
14) In the Village of Punjab, Sheryl owns a well, which is the only source of drinking water. The
supply of water is perfectly inelastic at a quantity of 1,000 gallons of water per day. At a price of
$2.00 per gallon, the quantity demanded per day is 1,000 gallons. The government imposes a
$0.50 per gallon tax.
a) After the tax is imposed, what is the price paid by the villagers? What is the price received by
Sheryl?
b) How much revenue does the government collect?
c) What fraction of the tax does Sheryl pay? What fraction is paid by the villagers?
Price
(dollars per
loaf)
Quantity demanded
(loaves per day)
Quantity supplied
(loaves per day)
1.00
1,200
0
1.50
800
400
2.00
400
800
2.50
0
1,200
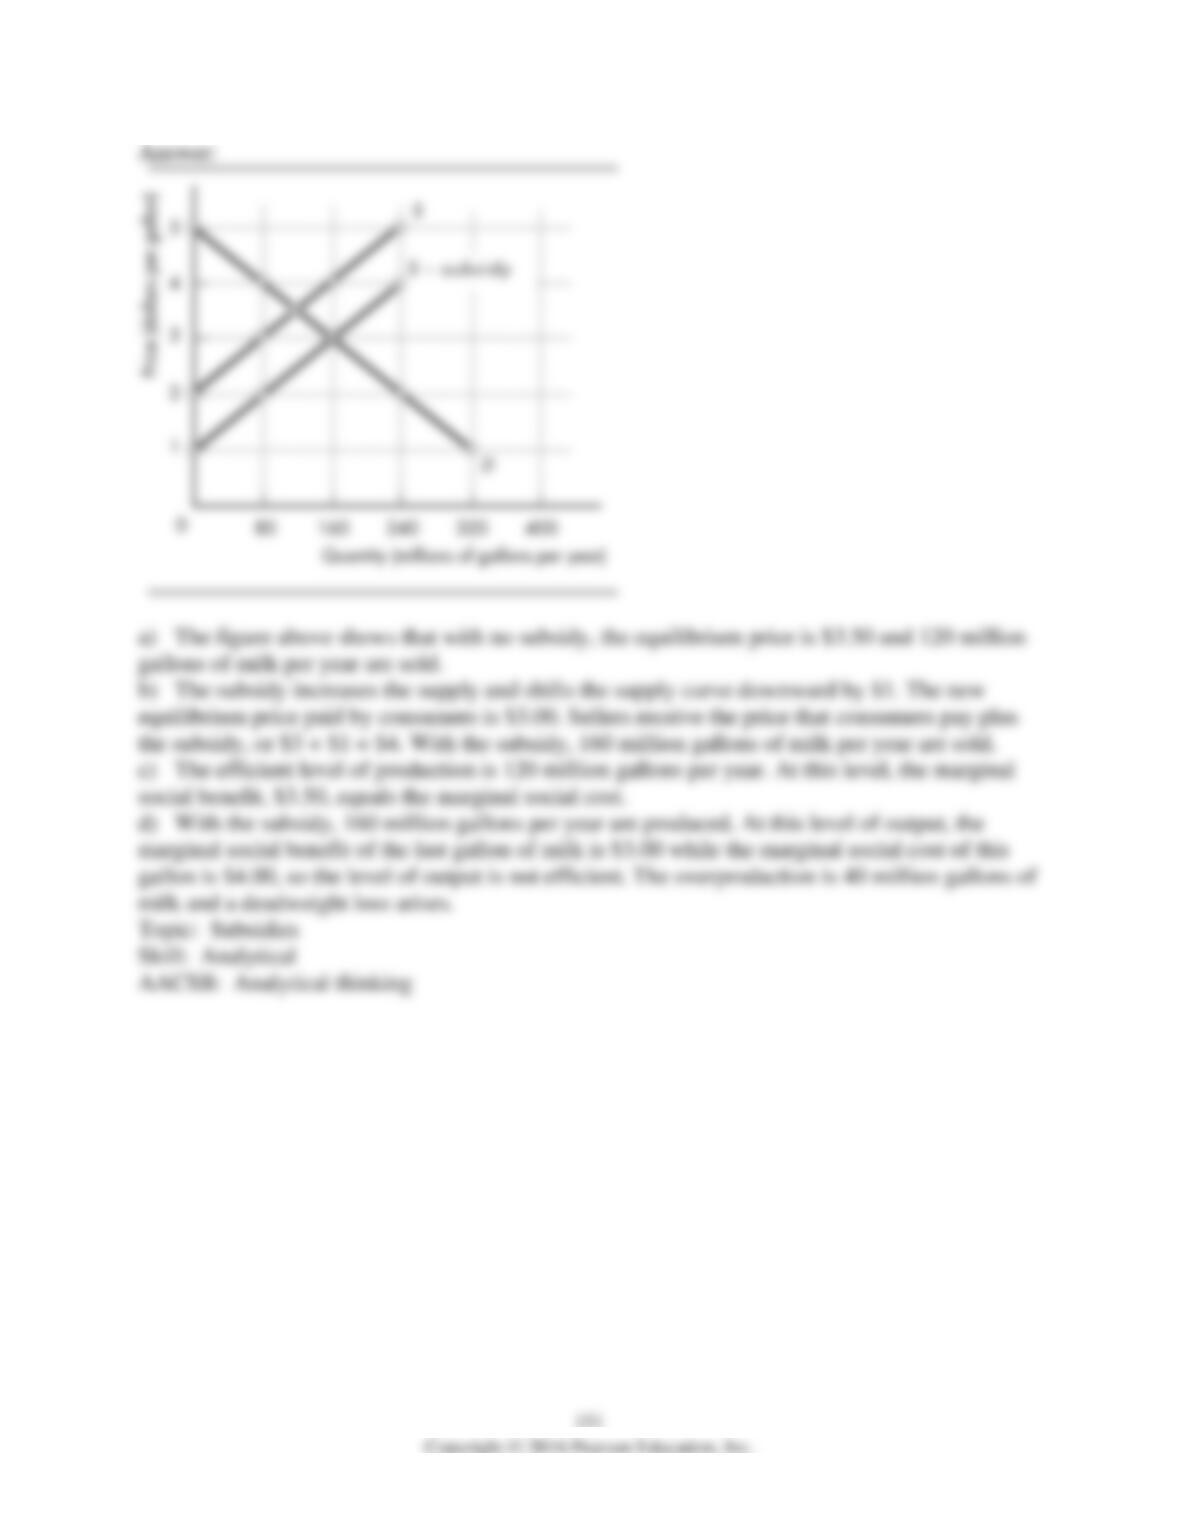
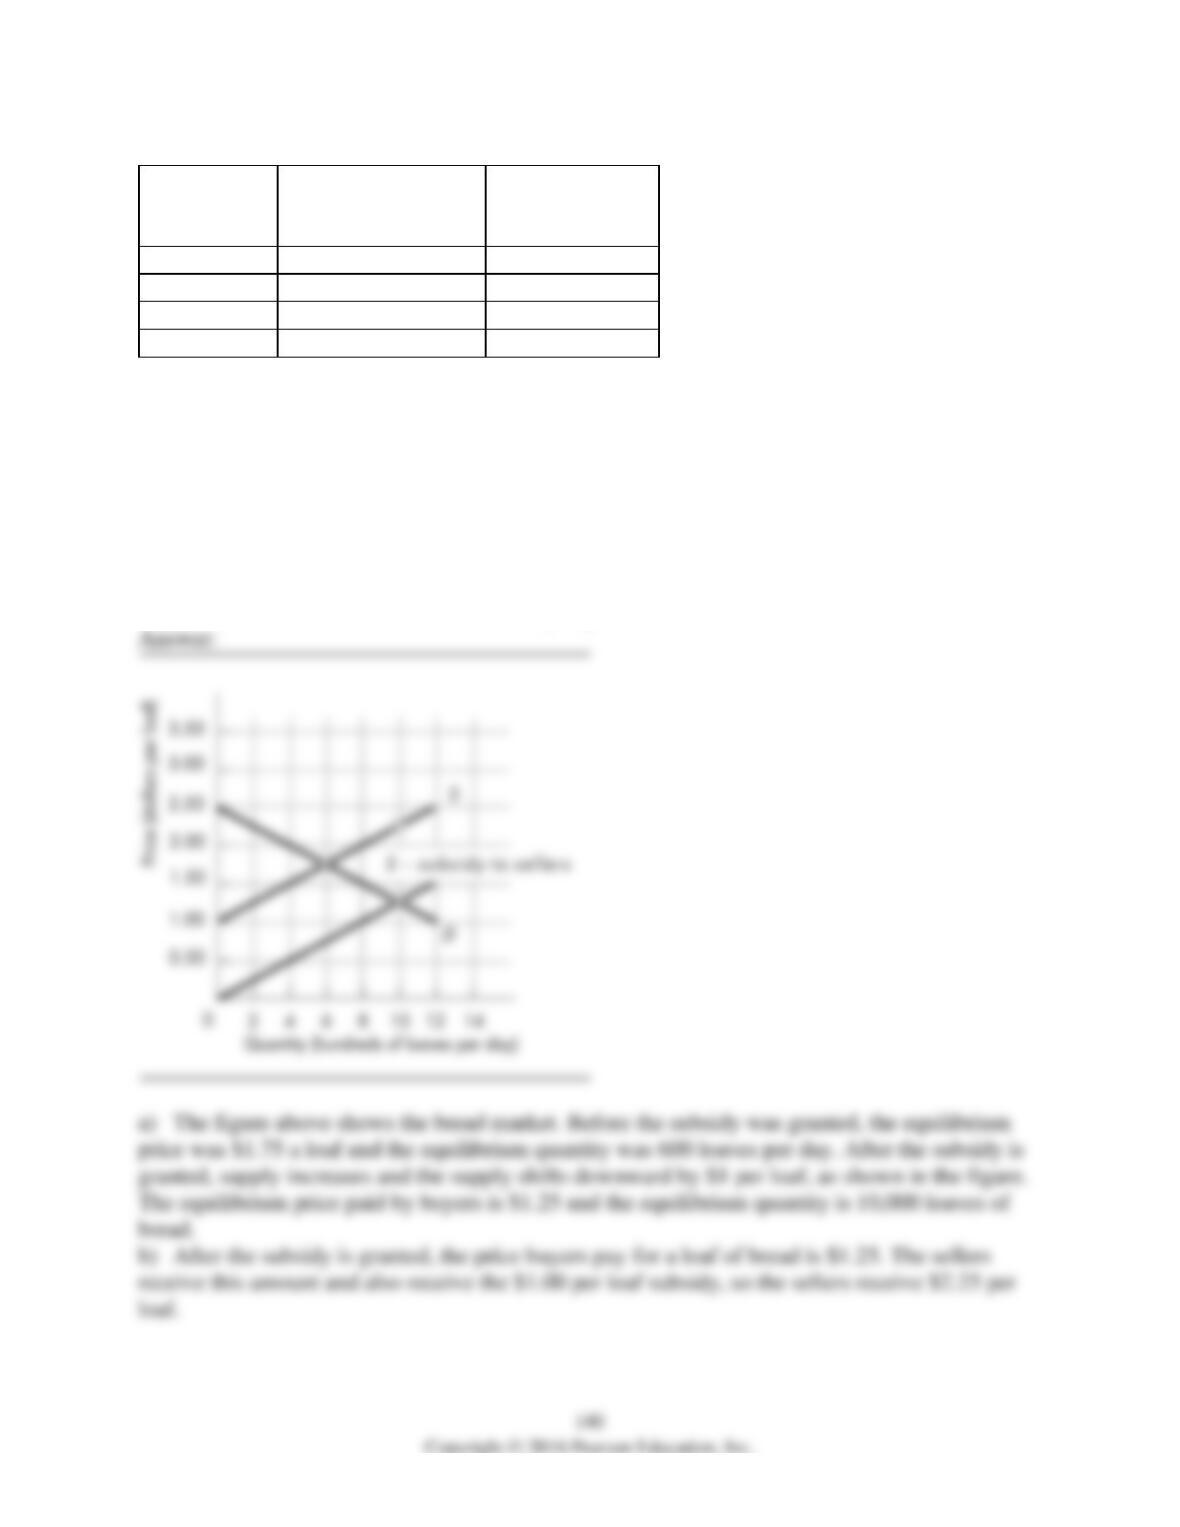
15) The table above gives the demand and supply schedules for bread in Bakerville. Draw the
demand and supply curves. Suppose a subsidy on bread of $1 per loaf is given to bread
producers.
a) How will the subsidy affect the price paid by buyers for a loaf of bread and the quantity of
bread sold? Show your work on your graph.
b) How will the subsidy affect the amount sellers receive for a loaf of bread?
c) After the subsidy is granted, what is the marginal social cost of the last loaf of bread
produced? What is its marginal social benefit? If there are no external costs or external benefits,
is the bread market efficient once the subsidy is granted?
9 True or False
1) A rent ceiling set above the equilibrium rent has no effect.
2) A rent ceiling set above the equilibrium rent efficiently allocates resources in the housing
market.
3) One positive aspect of rent ceilings is that they help reduce the time and expense associated
with apartment hunting.
4) Discrimination based on age, race, gender, or family status very likely increases as a result of
rent ceilings.
5) One way to assure that poor people will have a plentiful supply of affordable housing
available to them is by imposing rent ceilings.
6) Rent controls and the minimum wage are both examples of price ceilings.
7) The supply curve of low-skilled labor is upward sloping because those workers know that
government will protect them with minimum wage legislation.
8) A minimum wage set above the equilibrium wage rate has no effect.
9) Most economists believe that raising the minimum wage decreases the employment
opportunities for low-skilled workers.
10) Economists generally agree that increases in the minimum wage increase employment.
11) A policy of raising the minimum wage is beneficial to all low-skilled workers.
12) A sales tax on sellers of a good shifts the demand curve leftward because the tax raises the
price that consumers must pay.
13) A sales tax on sellers of a good shifts the supply curve leftward because the tax is like a cost
of production.
14) A tax imposed on buyers raises the price of the good more than would the same tax if it was
imposed on sellers.
15) A sales tax on sellers a good leads to a loss of consumer surplus, but a price ceiling or a price
floor on that same product will not.
16) If the demand is perfectly elastic, buyers pay the entire tax.
17) The incidence of the tax between buyers and sellers depends only on the elasticity of
demand.
18) If the elasticity of supply of labor is low and the elasticity of demand for labor is high, then
workers pay most of the Social Security tax levied on labor.
19) If the elasticities of demand for alcohol, tobacco and gasoline are low and the elasticities of
supply are high, then the burden of these taxes (excise taxes) falls more heavily on buyers than
on sellers.
20) Because a subsidy raises marginal benefit, it can be used to eliminate the deadweight loss
from overproduction.
21) A production quota on tobacco lowers the price of tobacco and the marginal cost of
producing it.
22) The black market price for a legally prohibited good will be the same whether a $1,000 fine
is placed on the buyer or the seller.
145
10 Extended Problems
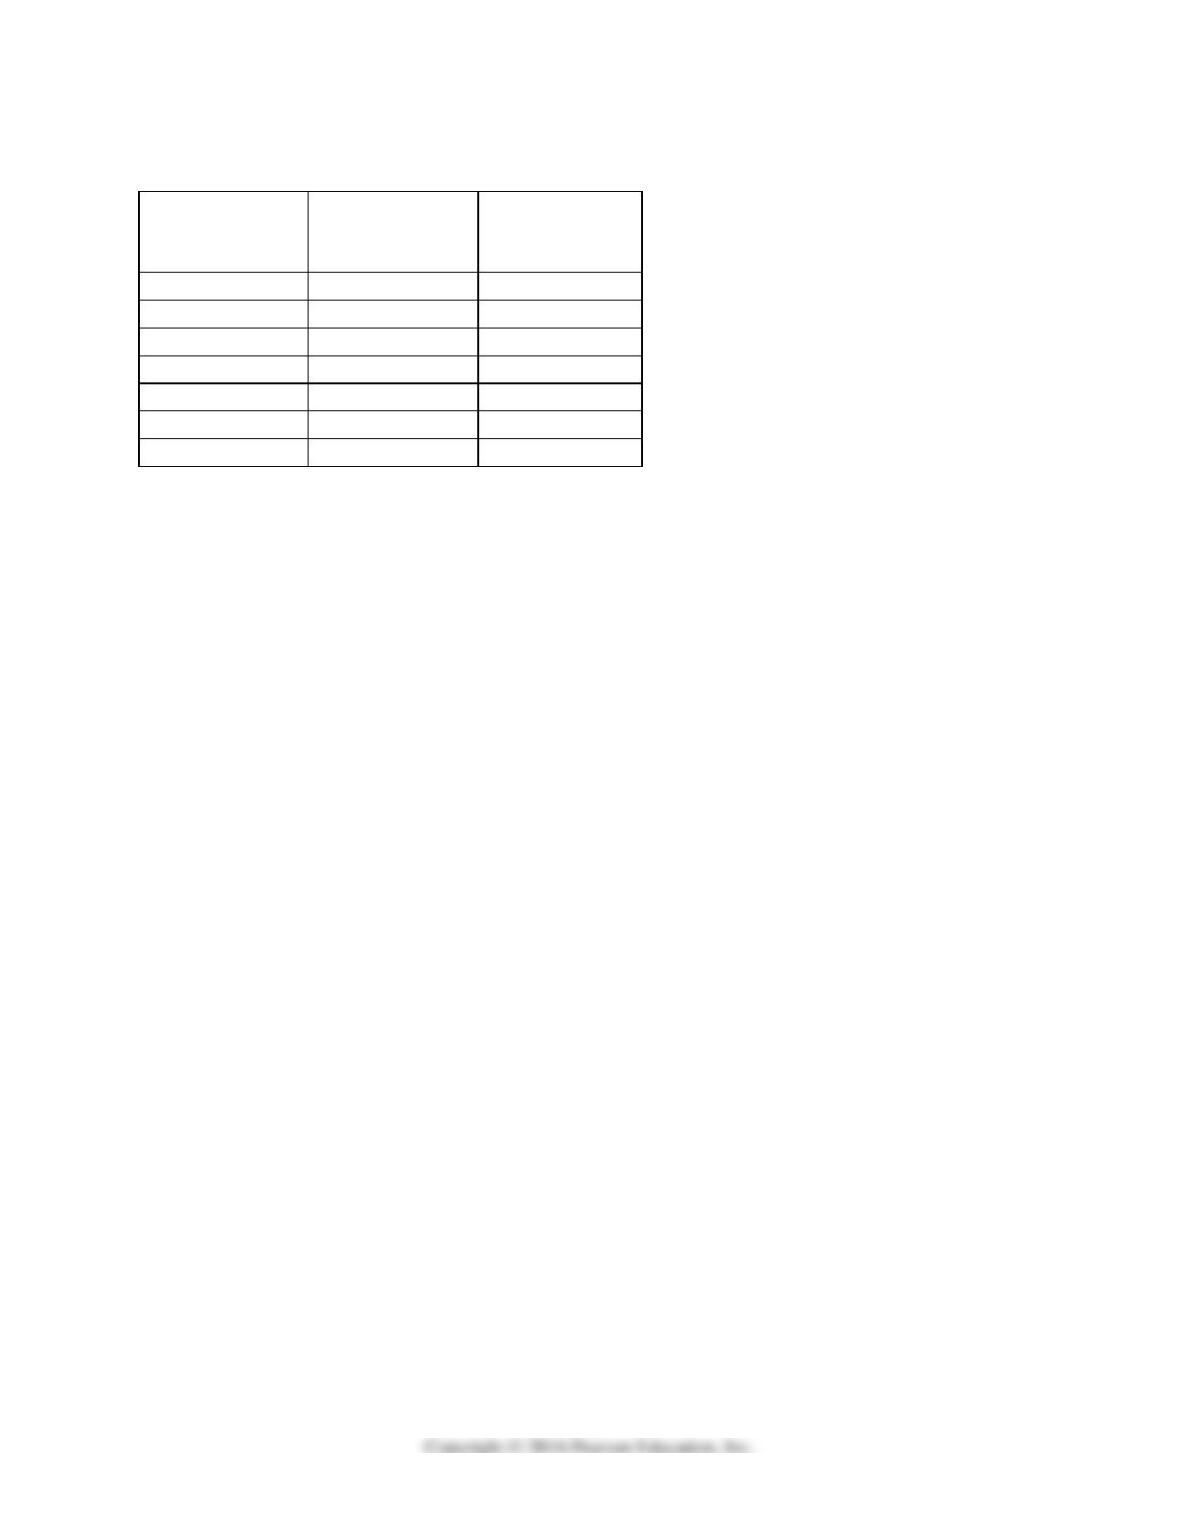
Rent
(dollars per
month)
Quantity
demanded
(units per month)
Quantity
supplied
(units per month)
500
1,200
0
600
1,000
100
700
800
200
800
600
300
900
400
400
1,000
200
500
1,100
0
600
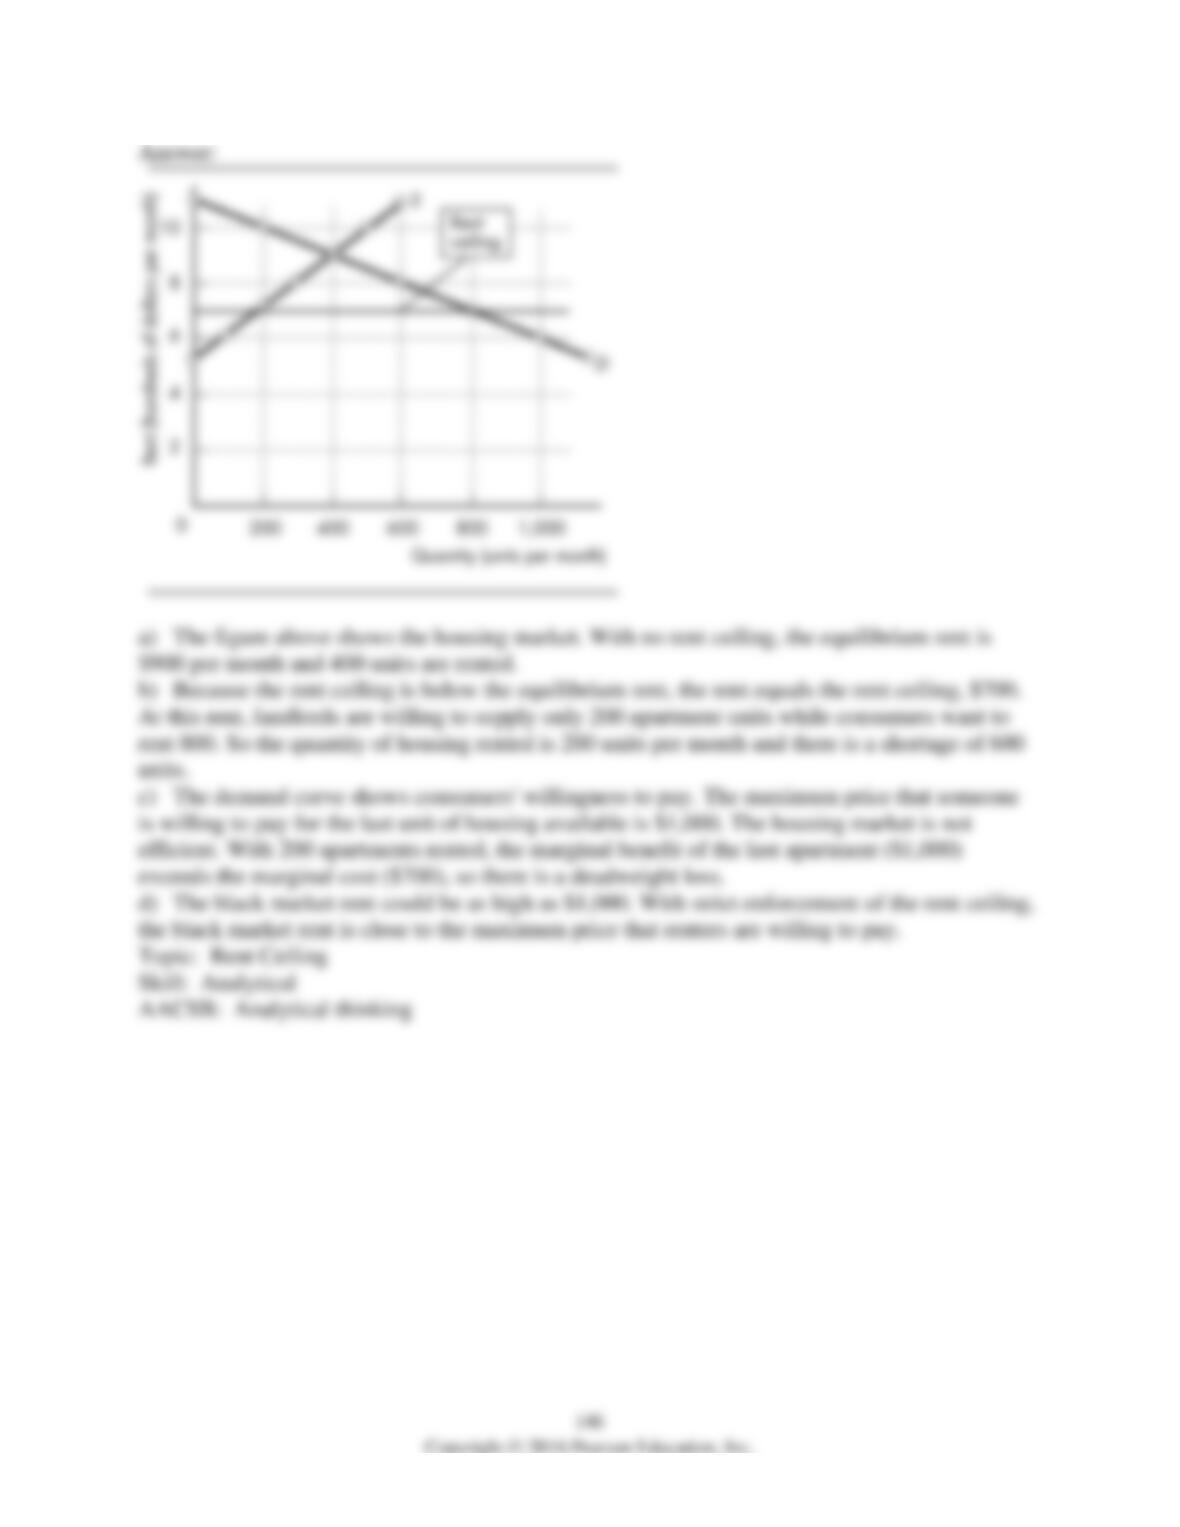
1) The table above shows the demand for and supply of rental housing in Crainsboro. The city
government is considering imposing a rent ceiling of $700 a month. Help the government to
analyze the effects of the proposed rent ceiling.
a) Draw the demand and supply curves. With no rent ceiling, what is the rent and how many
apartments are rented?
b) With the rent ceiling, what is the rent and how many apartments are rented? What is the
shortage of housing? Explain.
c) If the rent ceiling is strictly enforced, what is the maximum price that someone is willing to
pay for the last unit of housing available? Is the housing market efficient? Explain.
d) If a black market develops, how high could the black market rent be? Explain your answer.
Wage rate
(dollars per hour)
Quantity
demanded
(hours per
month)
Quantity
supplied
(hours per
month)
3
800
400
4
700
500
5
600
600
6
500
700
7
400
800
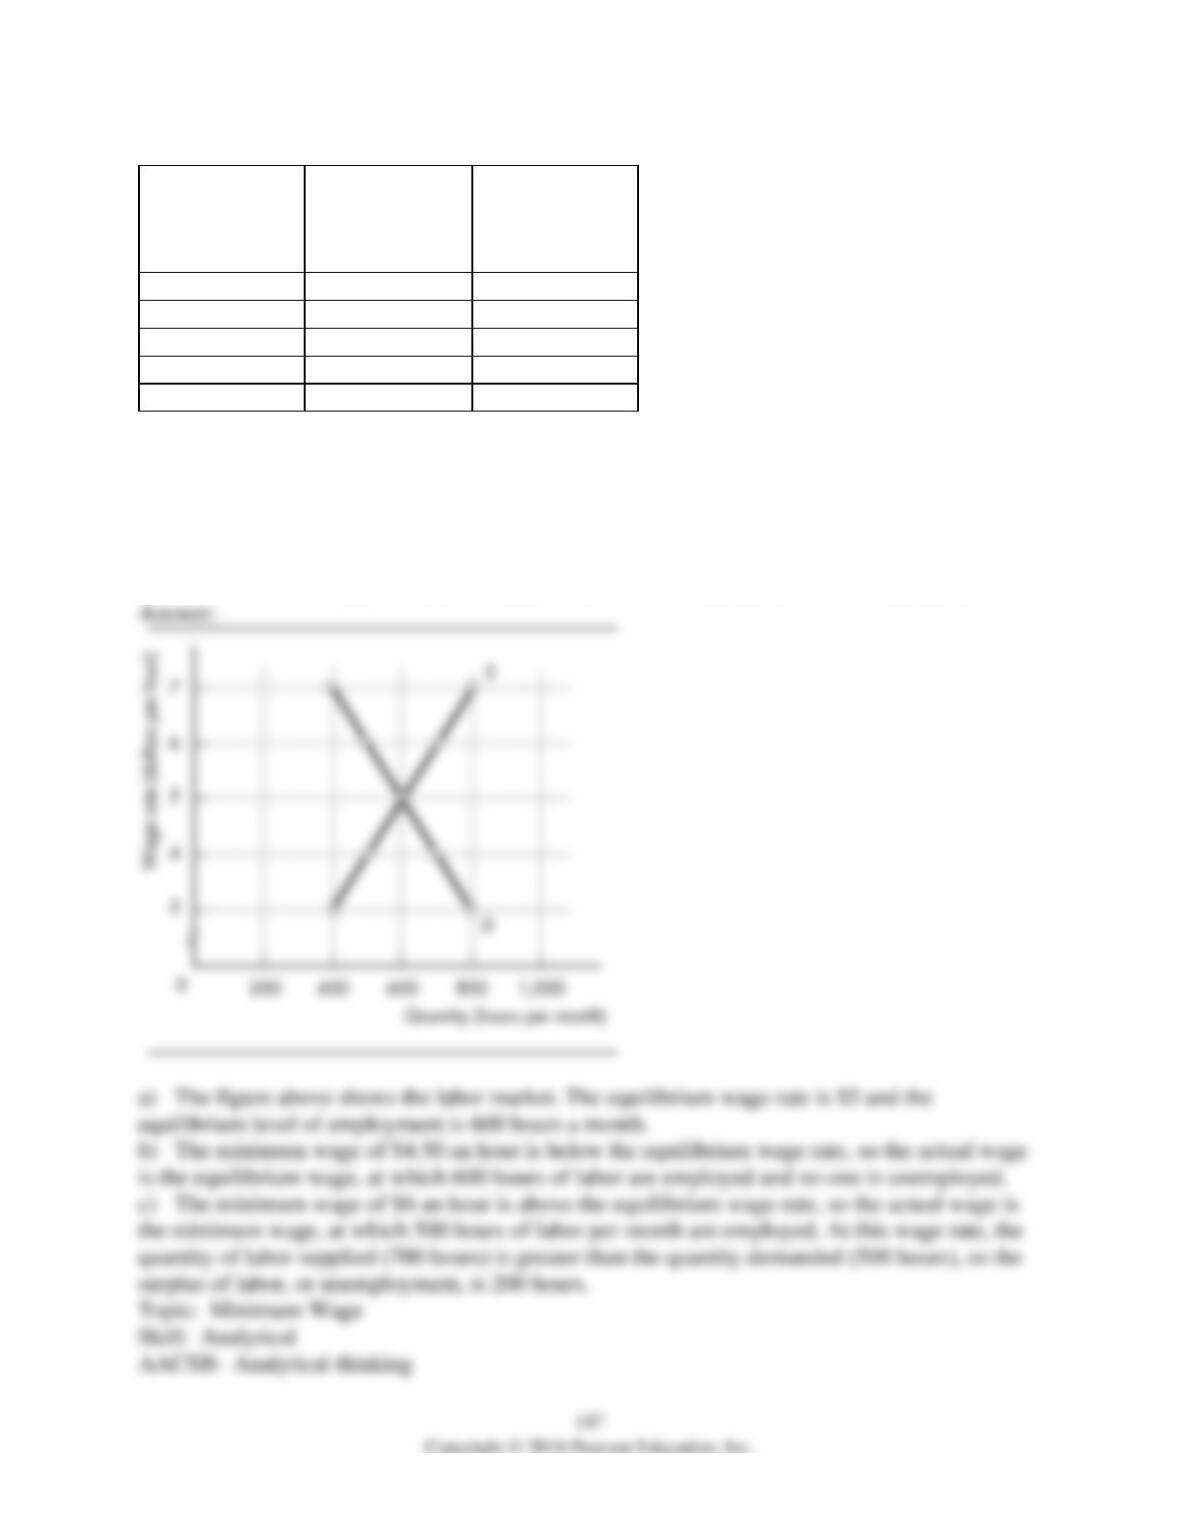
2) The table above shows the demand for and supply of labor in a small less developed country.
a) Draw the demand and supply curves. What are the equilibrium wage and the level of
employment?
b) Currently, the minimum wage is set at $4.50 per hour. How many hours are worked? How
many hours of labor are unemployed?
c) If the minimum wage is raised to $6 per hour, what are employment and unemployment?
148
Price
(dollars per
pound)
Quantity
demanded
(pounds per day)
Quantity supplied
(pounds per day)
1
480
0
2
360
0
3
240
240
4
120
480
5
0
720
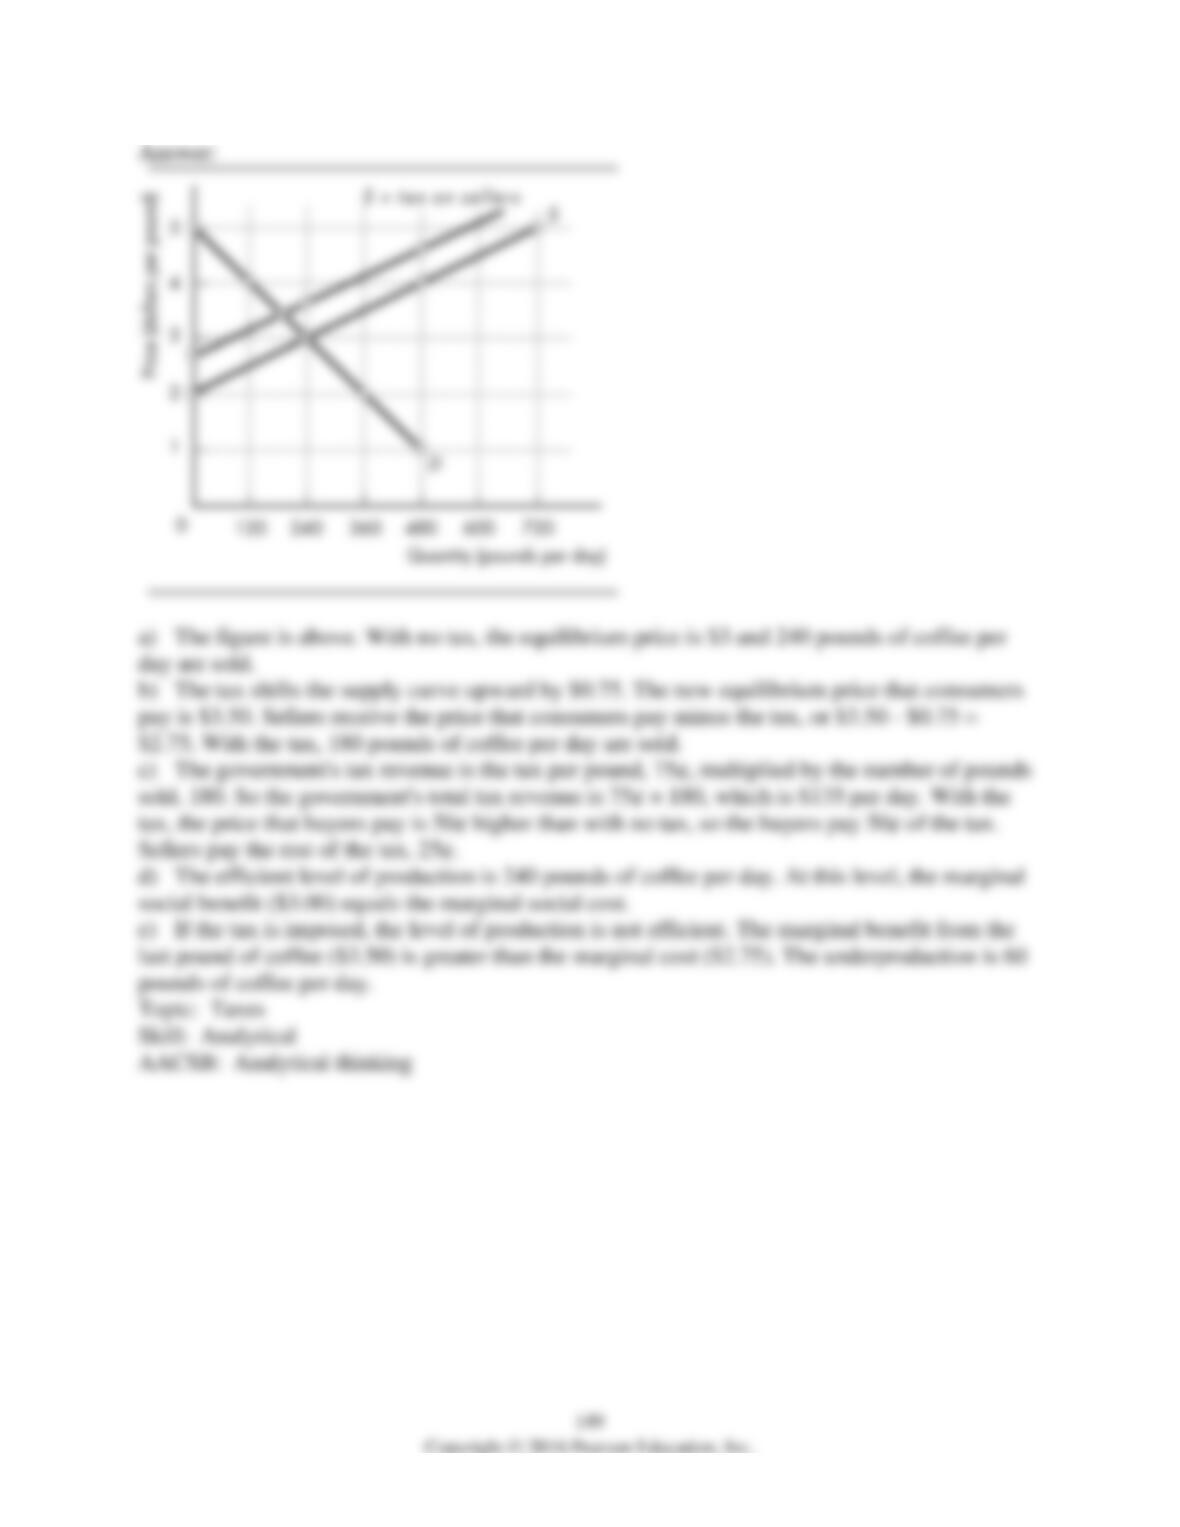
3) The table above shows the demand and supply schedules for the market for coffee in
Roastville. A tax on coffee of 75 cents per pound is proposed and the local government asks you
to examine the effects of the tax.
a) Draw the demand and supply curves. If there is no tax on coffee, what is the price and how
many pounds are sold?
b) With the tax, what is the price that consumers pay? What is the price that sellers receive?
How many pounds of coffee are sold?
c) What is the government’s total tax revenue? How much of the 75¢ per pound tax is paid by
buyers? How much is paid by sellers?
d) If there are no external costs and benefits, what is the efficient level of coffee production?
e) If the tax is imposed, will the level of production be efficient? Why or why not?
150
Price
(dollars per
gallon)
Quantity demanded
(millions of gallons
per year)
Quantity supplied
(millions of gallons
per year)
1
320
0
2
240
0
3
160
80
4
80
160
5
0
240
4) The table above shows the demand and supply schedules for milk in Cowland. A subsidy on
milk of $1 per gallon is proposed and the government asks you to examine the effects of the
subsidy.
a) Draw the demand and supply curves. If there is no subsidy, what is the price of milk and how
many gallons are sold?
b) With the subsidy, what is the price that consumers pay? What is the price that sellers receive?
How many gallons of milk are sold?
c) Assuming no external costs and benefits, what is the efficient level of milk production?
Explain.
d) With the subsidy, what is the marginal social benefit from milk? What is the marginal social
cost of milk? If the subsidy is introduced, will the level of production be efficient? Why or why
not?