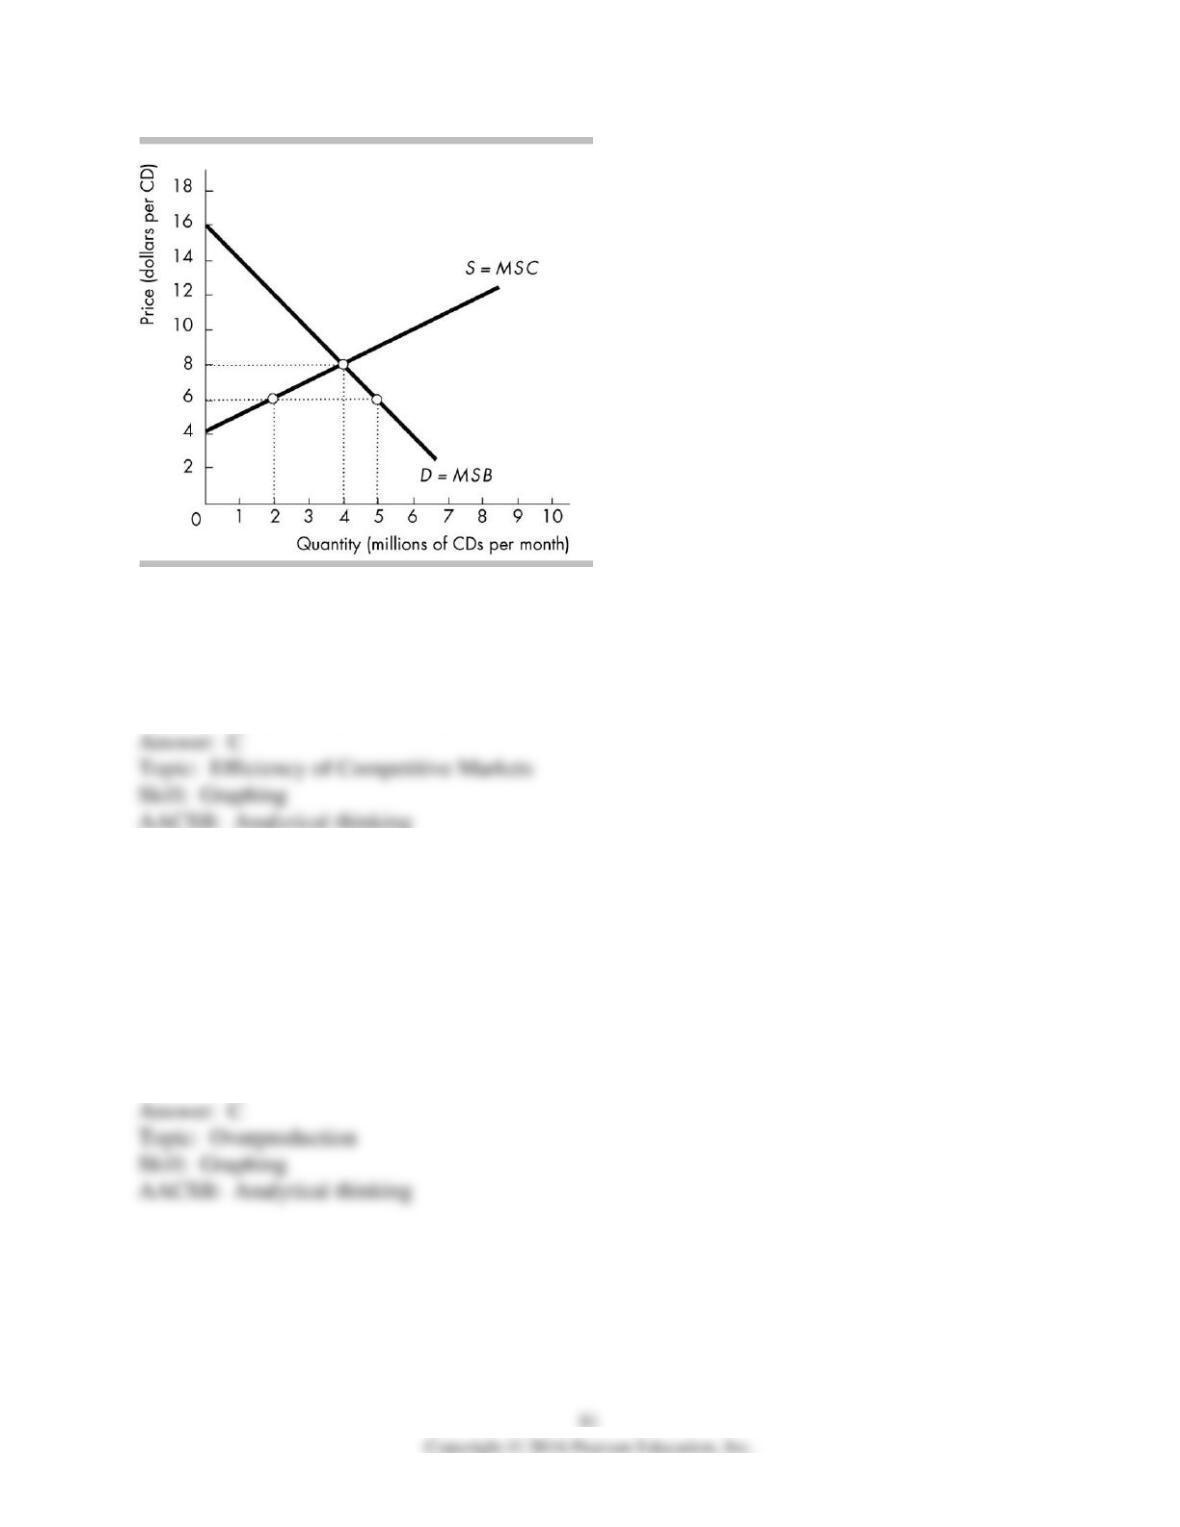
116) In the above figure, at the efficient quantity of CDs
A) total consumer surplus is zero.
B) total producer surplus is zero.
C) the sum of consumer surplus and producer surplus is maximized.
D) Both answers A and B are correct.
117) In the above figure, if five million CDs per month are produced and consumed, that is
A) better than producing and consuming four million CDs because more is always better than
less.
B) more than the efficient quantity because the marginal social benefit exceeds the marginal
social cost.
C) more than the efficient quantity because the marginal social cost exceeds the marginal social
benefit.
D) less than the efficient quantity because the opportunity cost exceeds the marginal social
benefit.
118) Using the above figure, which of the following quantities of CDs has the largest deadweight
loss?
A) 3 million CDs
B) 4 million CDs
C) 7 million CDs
D) The deadweight losses associated with the three quantities given above are all equal.
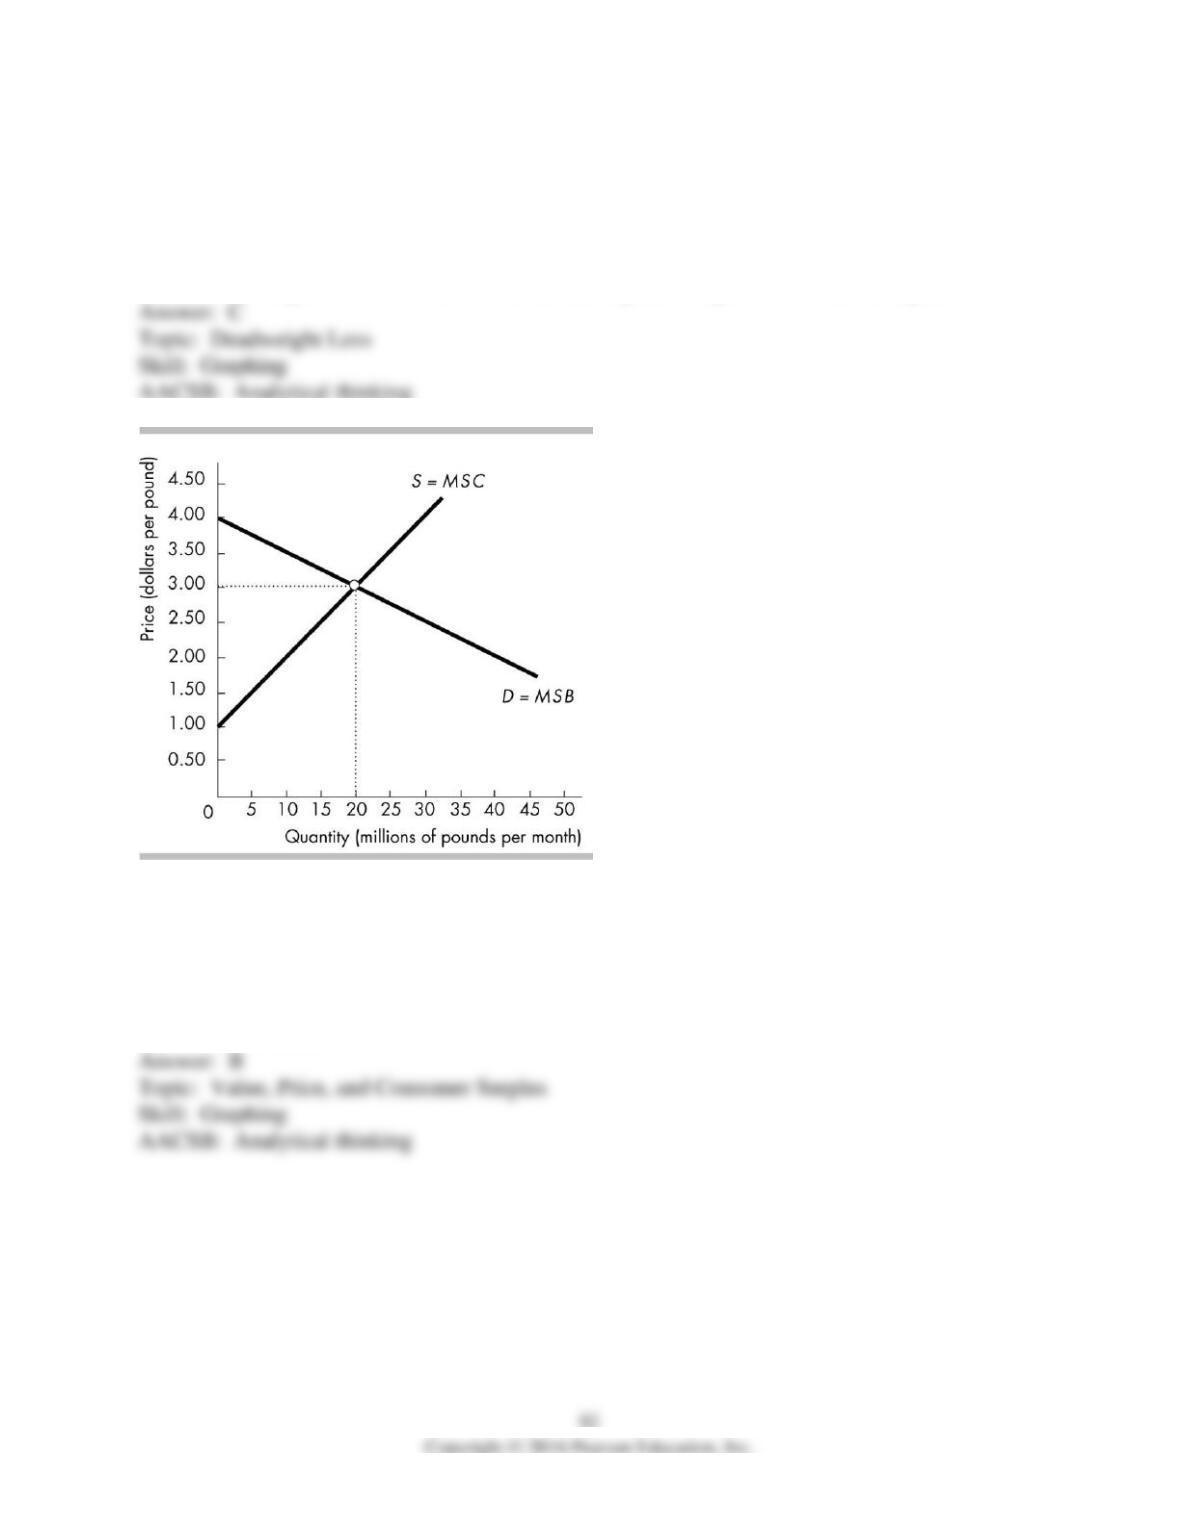
119) The figure above shows the market for coffee. If 10 million pounds of coffee a month are
available, the ________ price that consumers are willing to pay for the last pound is ________.
A) maximum; $2.00
B) maximum; $3.50
C) minimum; $2.00
D) minimum; $3.50
120) The figure above shows the market for coffee. If 30 pound of coffee a month are available,
the ________ price that consumers are willing to pay for the last pound is ________.
A) maximum; $4.00
B) minimum; $4.00
C) maximum; $2.50
D) minimum; $2.50
121) The figure above shows the market for coffee. The ________ price that producers must be
offered to get them to produce 10 million pounds of coffee per month is ________.
A) maximum; $2.00
B) maximum; $3.50
C) minimum; $2.00
D) minimum; $3.50
122) The figure above shows the market for coffee. The ________ price that producers must be
offered to get them to produce 30 million pounds of coffee per month is ________.
A) maximum; $2.50
B) minimum; $2.50
C) maximum; $4.00
D) minimum; $4.00
123) The figure above shows the market for coffee. When the efficient quantity of coffee is
produced, the marginal social benefit from the last pound is
A) $1.00.
B) $2.50.
C) $3.00.
D) $4.00.
124) The figure above shows the market for coffee. When the efficient quantity of coffee is
produced, the marginal social cost of the last pound is
A) $2.50.
B) $3.50.
C) $3.00.
D) $2.00.
125) The figure above shows the market for coffee. If the efficient quantity of coffee is
produced, the consumer surplus is
A) $10 million.
B) $20 million.
C) $60 million.
D) zero.
126) The figure above shows the market for coffee. If more coffee plantations are planted in
Brazil and Vietnam so that the supply of coffee increases, the efficient quantity of coffee will
________ and the consumer surplus will ________.
A) increase; increase
B) increase; decrease
C) decrease; decrease
D) decrease; increase
127) The figure above shows the market for coffee. If the efficient quantity of coffee is
produced, the producer surplus is
A) $10 million.
B) $20 million.
C) $60 million.
D) zero.
128) The figure above shows the market for coffee. Coffee is a normal good. If consumers’
incomes fall, the efficient quantity of coffee will ________ and the producer surplus will
________.
A) increase; increase
B) increase; decrease
C) decrease; decrease
D) decrease; increase
129) The figure above shows the market for coffee. If one firm owns all the coffee outlets and
sells 10 million pounds of coffee a month
A) the market is efficient because the marginal social benefit from coffee exceeds its marginal
social cost.
B) the market is efficient because the total social benefit from coffee exceed the total social cost.
C) there is a deadweight loss because the marginal social benefit from the last pound of coffee
exceeds its marginal social cost.
D) there is a deadweight loss because the marginal social cost of the last pound of coffee exceeds
its marginal social benefit.
130) The figure above shows the market for coffee. If one firm owns all the coffee outlets and
sells 10 million pounds of coffee a month, the deadweight loss is
A) zero.
B) $7.5 million.
C) $15 million.
D) $10 million

131) The figure above shows the market for coffee. If the government pays the coffee producers
a subsidy and production increases to 30 million pounds per day, the market is
A) efficient because the marginal social benefit from the last pound of coffee exceeds its
marginal social cost.
B) efficient because the total social benefit from coffee exceed the total social cost.
C) inefficient because the marginal social benefit from the last pound of coffee exceeds its
marginal social cost.
D) inefficient because the marginal social cost of the last pound of coffee exceeds its marginal
social benefit.
132) The figure above shows the market for coffee If the government pays the coffee producers a
subsidy and production increases to 30 million pounds per day, the deadweight loss is
A) zero.
B) $7.5 million.
C) $15 million.
D) $10 million.
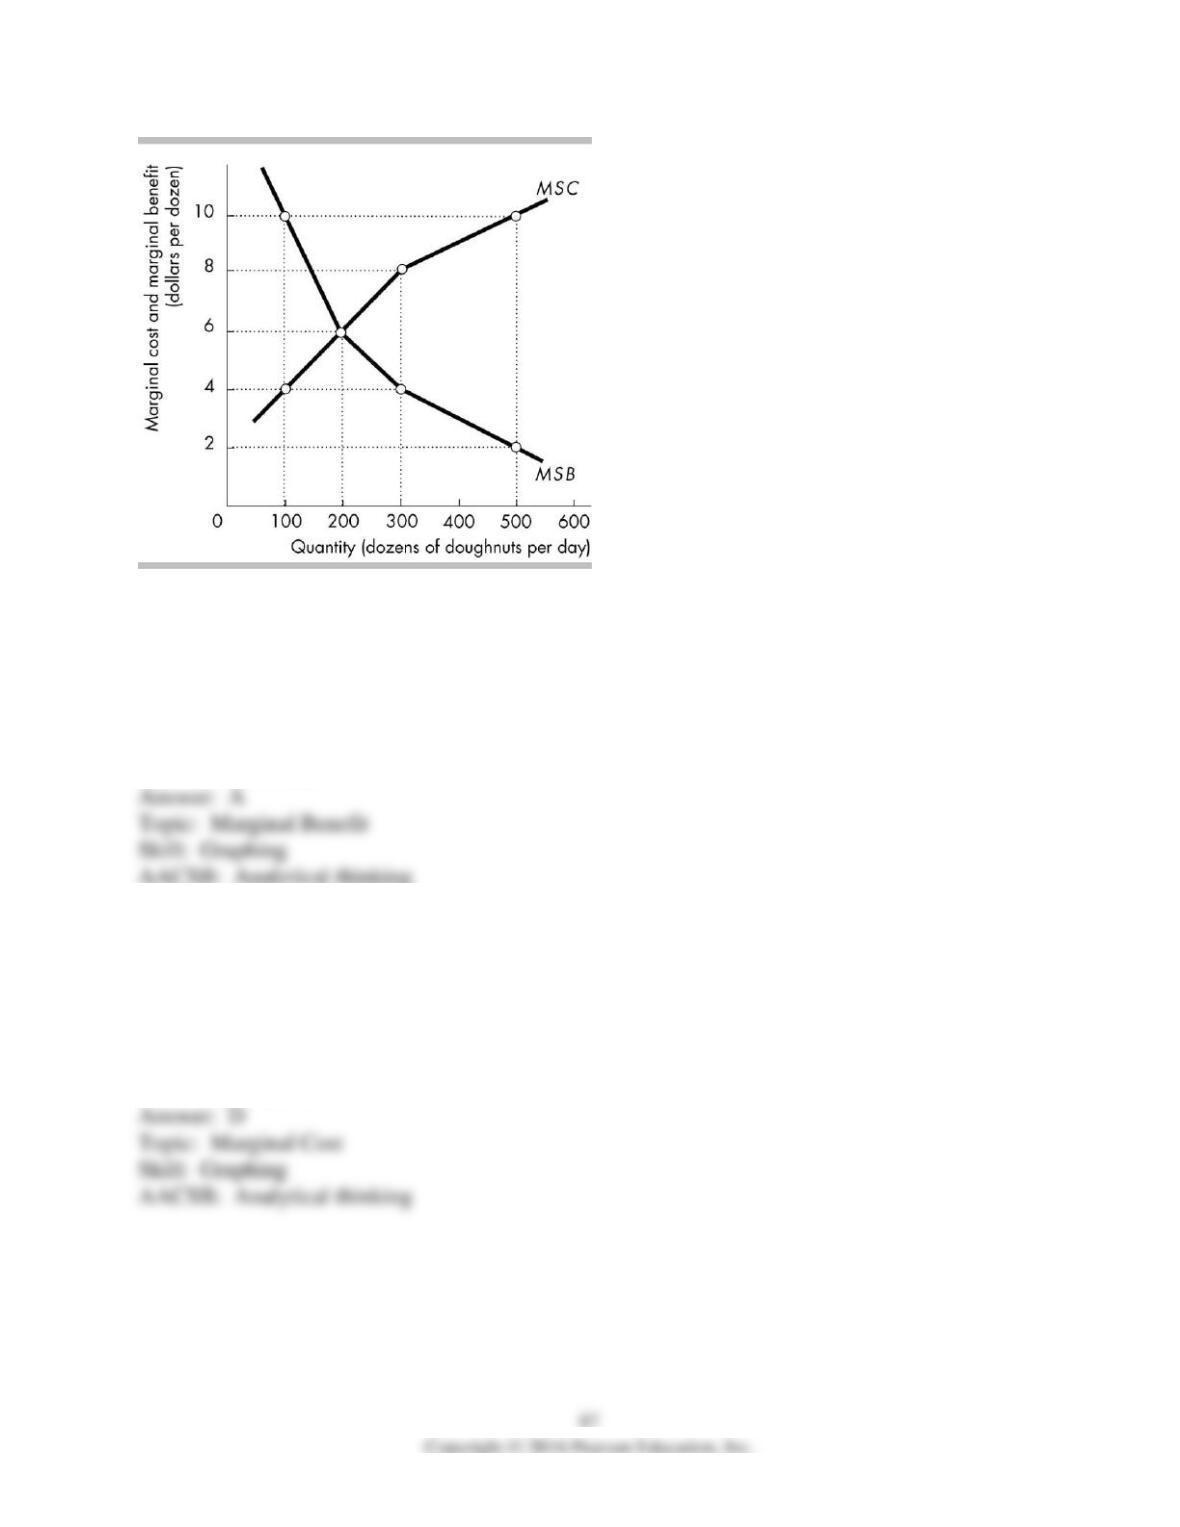
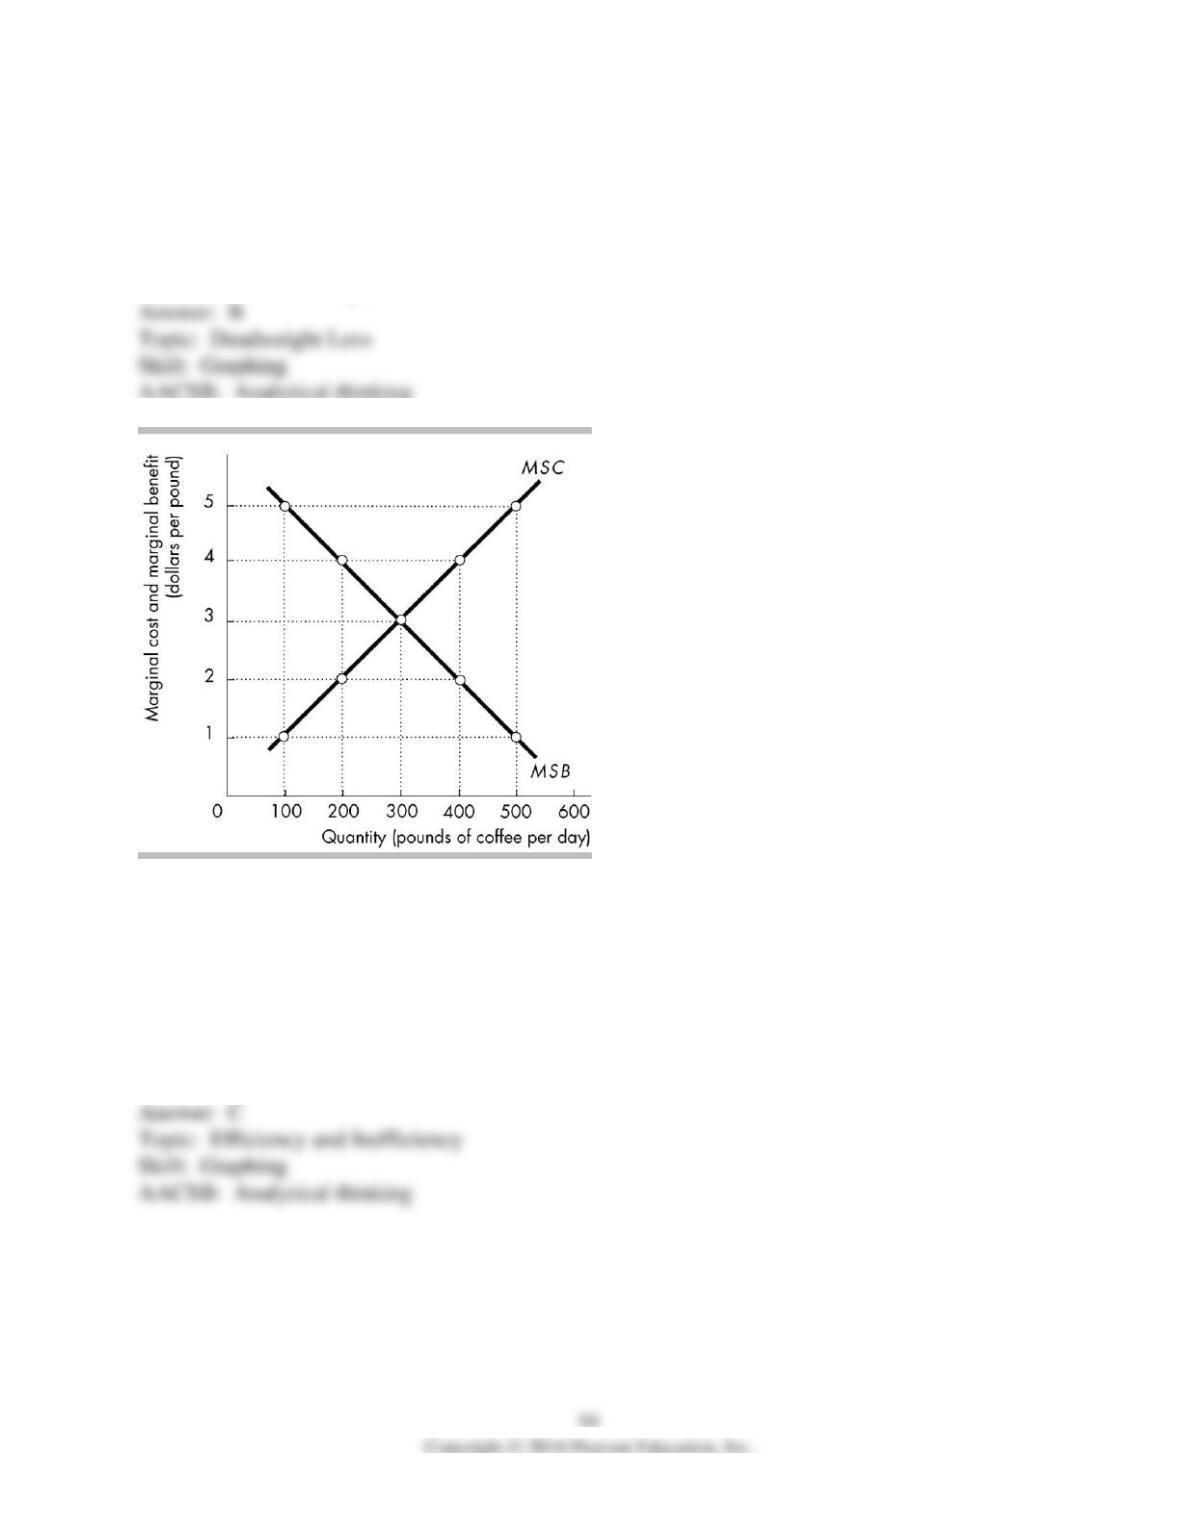
133) The above figure shows the marginal social benefit and marginal social cost curves of
doughnuts in the nation of Kaffenia. There is no external benefit. What is the marginal benefit to
the citizen of Kaffenia who consumes the 100th dozen doughnuts each day?
A) $10.00 per dozen
B) $8.00 per dozen
C) $6.00 per dozen
D) $4.00 per dozen
134) The above figure shows the marginal social benefit and marginal social cost curves of
doughnuts in the nation of Kaffenia. What is the marginal social cost to the economy of Kaffenia
of producing the 100th dozen doughnuts each day?
A) $10.00 per dozen
B) $8.00 per dozen
C) $6.00 per dozen
D) $4.00 per dozen
135) The above figure shows the marginal social benefit and marginal social cost curves of
doughnuts in the nation of Kaffenia. What is the marginal social benefit from the 300th dozen
doughnuts each day?
A) $10.00 per dozen
B) $8.00 per dozen
C) $6.00 per dozen
D) $4.00 per dozen
136) The above figure shows the marginal social benefit and marginal social cost curves of
doughnuts in the nation of Kaffenia. What is the marginal social cost to the economy of Kaffenia
of producing the 300th dozen doughnuts each day?
A) $10.00 per dozen
B) $8.00 per dozen
C) $6.00 per dozen
D) $4.00 per dozen
137) The above figure shows the marginal social benefit and marginal social cost curves of
doughnuts in the nation of Kaffenia. What is the marginal social cost of producing the 200th
dozen doughnuts each day?
A) $10.00 per dozen
B) $8.00 per dozen
C) $6.00 per dozen
D) $4.00 per dozen
138) The above figure shows the marginal social benefit and marginal social cost curves of
doughnuts in the nation of Kaffenia. What is the efficient quantity of doughnuts to produce each
day?
A) 100 dozen
B) 200 dozen
C) 300 dozen
D) 500 dozen
139) The above figure shows the marginal social benefit and marginal social cost curves of
doughnuts in the nation of Kaffenia. When the marginal social benefit of the last dozen
doughnuts is equal to the marginal social cost
A) the efficient quantity is being produced and consumed.
B) 200 dozen doughnuts are produced and consumed each day.
C) an increase in production and consumption would increase efficiency.
D) Both answers A and B are correct.
140) The above figure shows the marginal social benefit and marginal social cost curves of
doughnuts in the nation of Kaffenia. At Kaffenia’s efficient quantity of doughnuts
A) total consumer surplus is zero.
B) total producer surplus is zero.
C) consumer surplus exceeds producer surplus by the greatest possible amount.
D) the sum of consumer surplus and producer surplus is maximized.
141) The above figure shows the marginal social benefit and marginal social cost curves of
doughnuts in the nation of Kaffenia. Which of the following would lead the quantity of
doughnuts in Kaffenia to differ from the efficient quantity?
A) The existence of many producers and sellers of doughnuts.
B) The existence of just one producer and seller of doughnuts.
C) Damage to the environment from the disposal of oil used to cook the doughnuts.
D) Both answers B and C are correct.
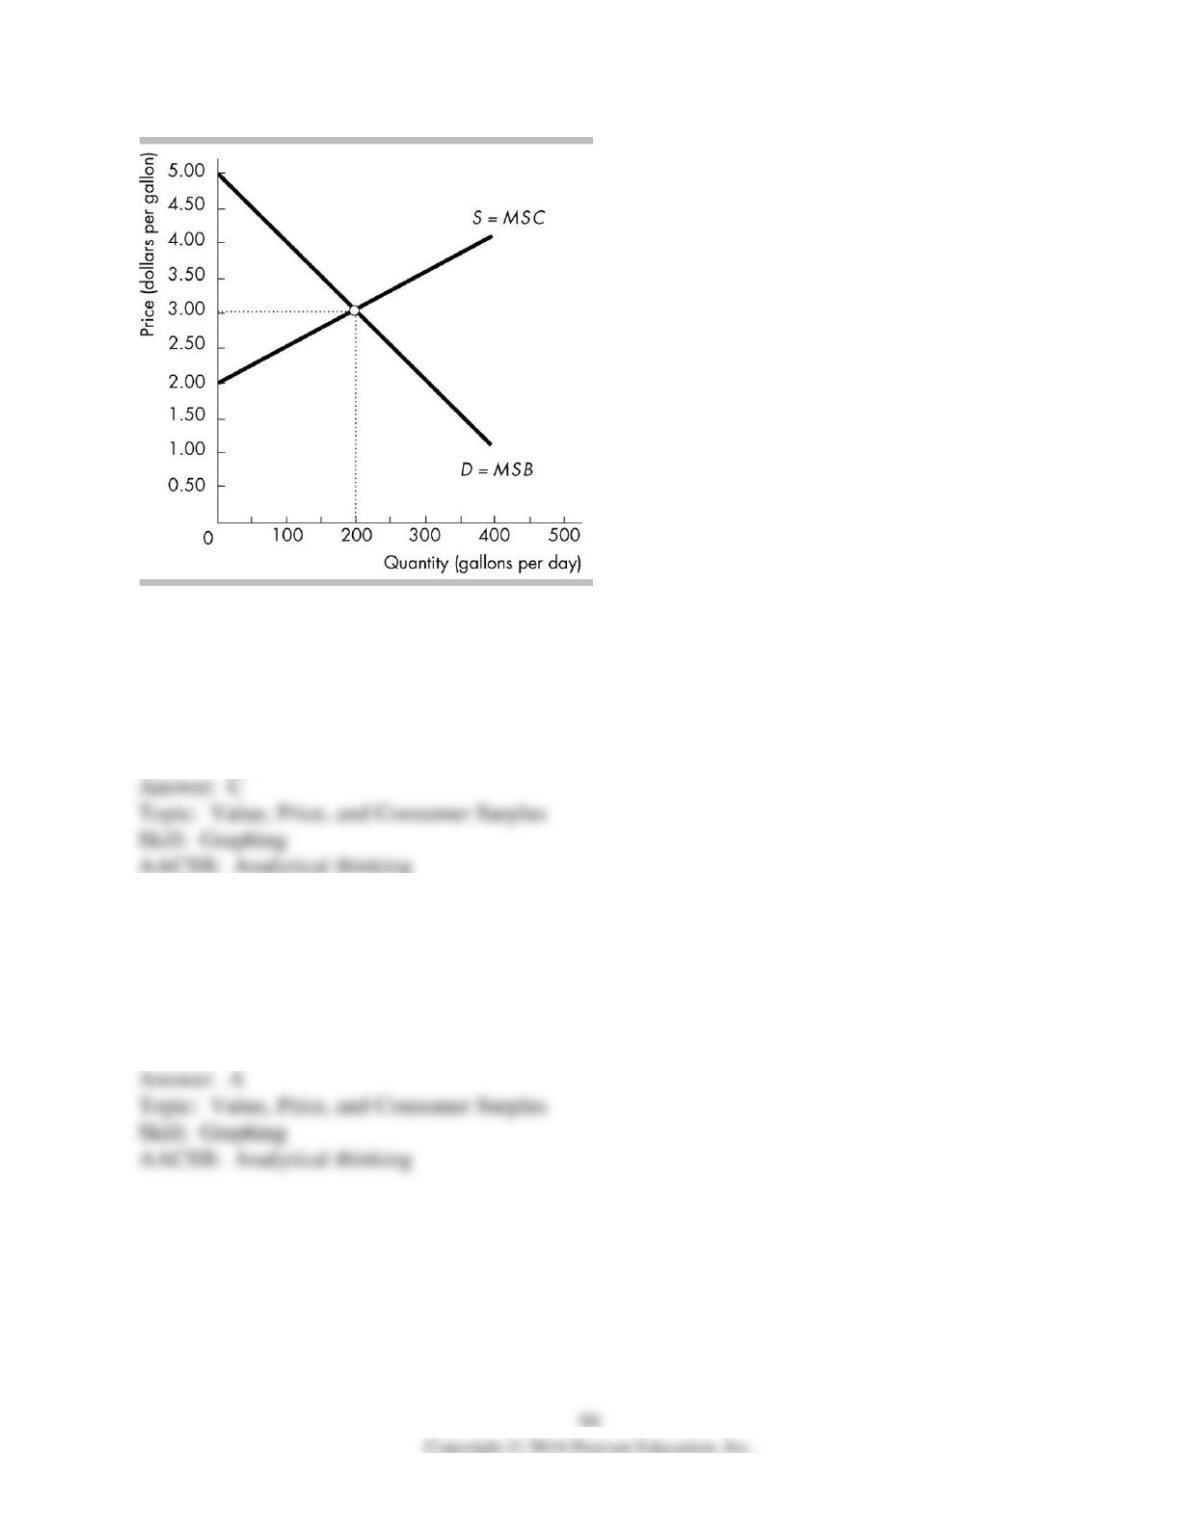
142) The figure above shows the market for milk. If 100 gallons of milk a day are available, the
________ price that consumers are willing to pay for the last gallon is ________.
A) maximum; $2.50
B) minimum; $3.00
C) maximum; $4.00
D) minimum; $4.00
143) The figure above shows the market for milk. If 250 gallons of milk a day are available, the
________ price that consumers are willing to pay for the last gallon is ________.
A) maximum; $2.50
B) minimum; $2.50
C) maximum; $3.25
D) minimum; $3.25
144) The figure above shows the market for milk. The ________ price that producers must be
offered to get them to produce 100 gallons of milk per day is ________.
A) maximum; $2.50
B) minimum; $3.00
C) maximum; $4.00
D) minimum; $2.50
145) The figure above shows the market for milk. The ________ price that producers must be
offered to get them to produce 250 gallons of milk per day is ________.
A) maximum; $3.25
B) minimum; $3.25
C) maximum; $2.50
D) minimum; $2.50
146) The figure above shows the market for milk. When the efficient quantity of milk is
produced, the marginal social benefit from the last gallon is
A) $2.00.
B) $2.50.
C) $3.00.
D) $3.50.
147) The figure above shows the market for milk. When the efficient quantity of milk is
produced, the marginal social cost of the last gallon is
A) $3.50.
B) $3.00.
C) $2.50.
D) $2.00.
148) The figure above shows the market for milk. If the efficient quantity of milk is produced,
the consumer surplus is
A) $100.
B) $400.
C) $200.
D) $600.
149) The figure above shows the market for milk. If a drought lowers the productivity of dairy
cows so that they give less milk, then the efficient quantity of milk ________ and the consumer
surplus ________.
A) increases; increases
B) increases; decreases
C) decreases; increases
D) decreases; decreases
150) The figure above shows the market for milk. If the efficient quantity of milk is produced,
the producer surplus is
A) $100.
B) $400.
C) $200.
D) $600.
151) The figure above shows the market for milk. If the population increases, then the efficient
quantity of milk ________ and the producer surplus ________.
A) increases; increases
B) increases; decreases
C) decreases; increases
D) decreases; decreases
152) The figure above shows the market for milk. If the government pays the milk producers a
subsidy and production increases to 300 gallons per day
A) the market is efficient because the marginal social benefit from the last gallon of milk exceeds
its marginal social cost.
B) the market is efficient because the total social benefit from milk exceed the total social cost.
C) there is a deadweight loss because the marginal social benefit from the last gallon of milk
exceeds its marginal social cost.
D) there is a deadweight loss because the marginal social cost of the last gallon of milk exceeds
its marginal social benefit.
153) The figure above shows the market for milk. If one firm owns all the milk outlets in the city
and sells 100 gallons of milk
A) the market is efficient because the marginal social benefit from the last gallon of milk exceeds
its marginal social cost.
B) the market is efficient because the total social benefit from milk exceed the total social cost.
C) there is a deadweight loss because the marginal social benefit from the last gallon of milk
exceeds its marginal social cost.
D) there is a deadweight loss because the marginal social cost of the last gallon of milk exceeds
its marginal social benefit.
154) The figure above shows the market for milk. If the government pays the milk producers a
subsidy and production increases to 300 gallons per day
A) the deadweight loss is $100.
B) the deadweight loss is $75.
C) the deadweight loss is $50.
D) there is no deadweight loss.
155) The figure above shows the market for milk. If one firm owns all the milk outlets in the city
and sells 100 gallons of milk
A) the deadweight loss is $100.
B) the deadweight loss is $75.
C) the deadweight loss is $50.
D) there is no deadweight loss.
156) The above figure shows the marginal social benefit and marginal social cost curves of
coffee in the nation of Kaffenia. Producing and consuming the efficient quantity of coffee in
Kaffenia means that
A) the marginal social cost of the last pound of coffee is at the lowest possible value.
B) the marginal social benefit of the last pound of coffee is at its highest possible value.
C) to produce more coffee, the marginal social benefit of an additional pound of coffee is less
than its marginal social cost.
D) All of the above are correct.
157) The above figure shows the marginal social benefit and marginal social cost curves of
coffee in the nation of Kaffenia. When marginal social benefit is equal to the marginal social cost
of coffee in Kaffenia
A) three hundred pounds per day will be produced and consumed.
B) the efficient quantity of coffee is being produced and consumed.
C) any decrease in coffee consumption or production would result in a deadweight loss.
D) All of the above are correct.
158) The above figure shows the marginal social benefit and marginal social cost curves of
coffee in the nation of Kaffenia. There is no external benefit. What is the marginal benefit to the
citizen of Kaffenia who consumes the four hundredth pound of coffee each day?
A) $1.00 per pound
B) $2.00 per pound
C) $3.00 per pound
D) $4.00 per pound
159) The above figure shows the marginal social benefit and marginal social cost curves of
coffee in the nation of Kaffenia. There is no external cost. What is the marginal cost to the
economy of Kaffenia of producing the four hundredth pound of coffee each day?
A) $.50 per pound
B) $1.00 per pound
C) $2.00 per pound
D) $4.00 per pound
160) The above figure shows the marginal social benefit and marginal social cost curves of
coffee in the nation of Kaffenia. What is the efficient quantity of coffee to produce each day?
A) one hundred pounds
B) two hundred pounds
C) three hundred pounds
D) four hundred pounds
161) The above figure shows the marginal social benefit and marginal social cost curves of
coffee in the nation of Kaffenia. When 400 pounds of coffee are produced and consumed in
Kaffenia each day, that is
A) more efficient than when 300 pounds are produced and consumed because more is always
better than less.
B) inefficient because the marginal social benefit exceeds the marginal social cost.
C) inefficient because the marginal social cost of the 400th pound exceeds its marginal social
benefit.
D) inefficient because the opportunity cost of producing more coffee exceeds its marginal social
benefit.
162) The above figure shows the marginal social benefit and marginal social cost curves of
coffee in the nation of Kaffenia. For a consumer, the price they are willing to pay for each
additional pound of coffee is
A) always less than the economy’s marginal social cost of producing that additional pound.
B) equal to their own marginal benefit from consuming that additional pound.
C) equal to their consumer surplus.
D) Both answers B and C are correct.
163) The above figure shows the marginal social benefit and marginal social cost curves of
coffee in the nation of Kaffenia. Which of the following would result in the quantity of coffee in
Kaffenia differing from the efficient quantity?
A) The existence of a single producer and seller of coffee.
B) The existence of many producers and sellers of coffee.
C) Damage to the environment from fumes emitted by coffee beans.
D) Both answers A and C are correct.
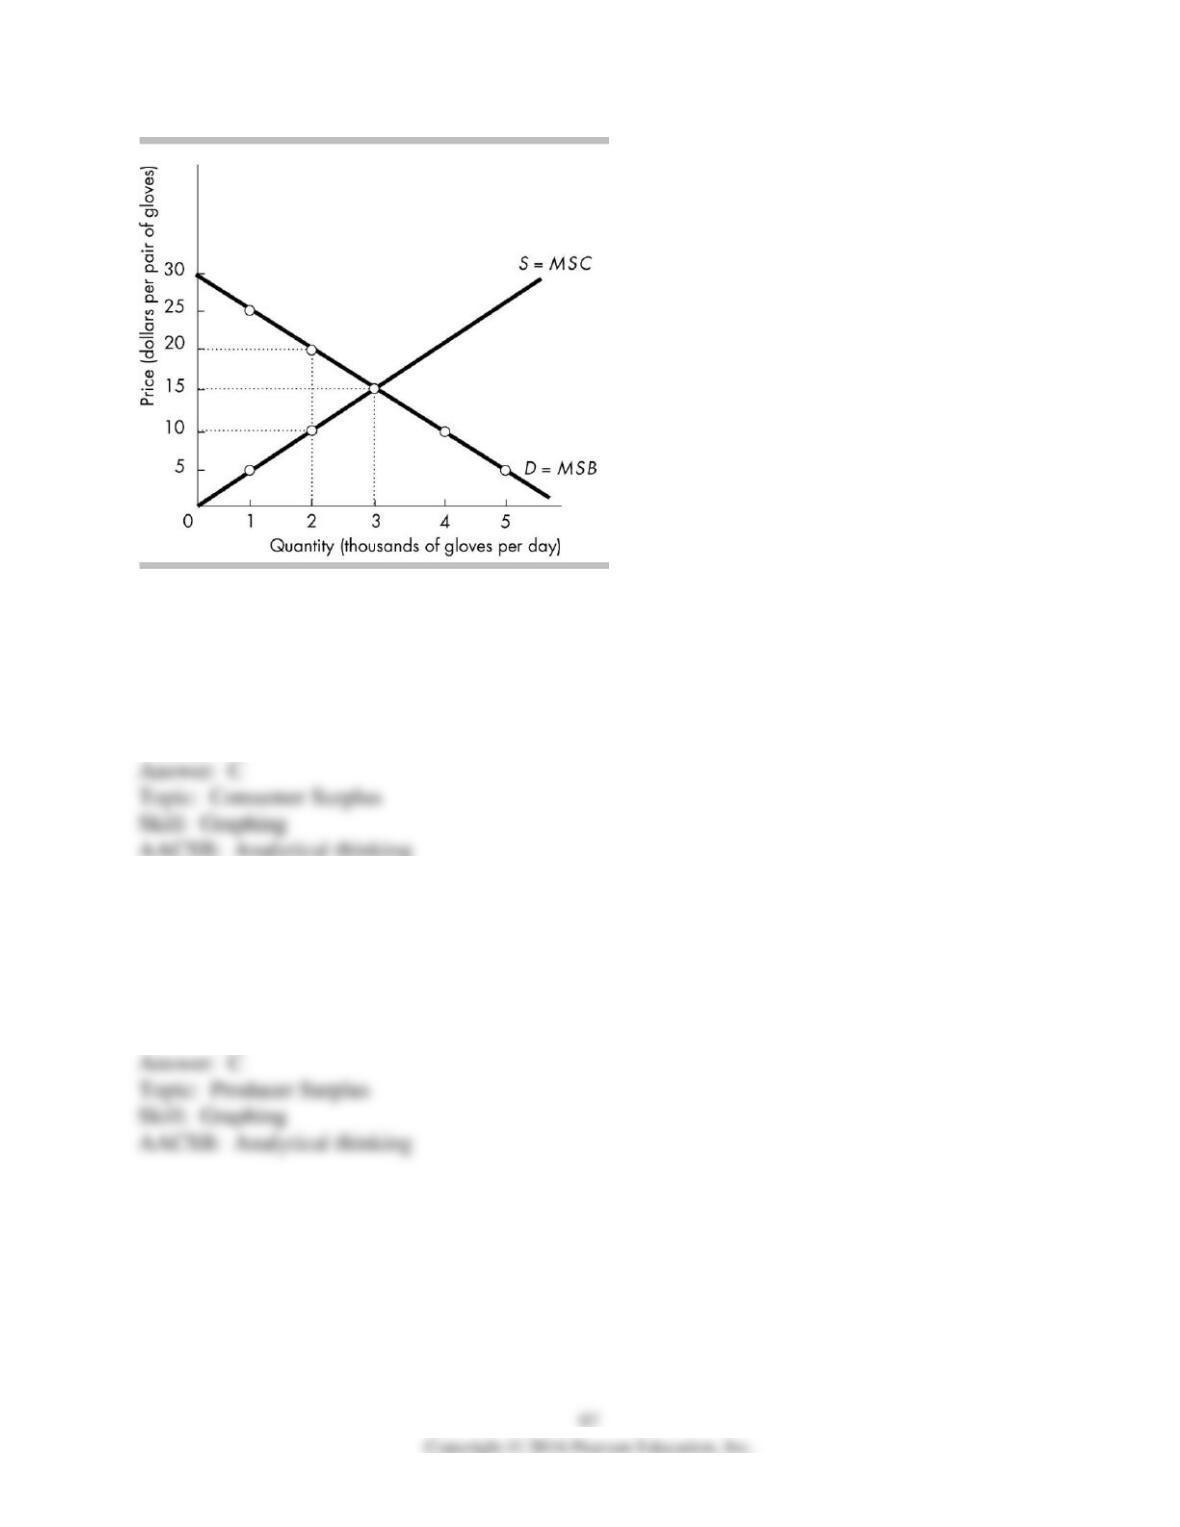
164) In the above figure, when the efficient quantity of gloves is produced, the total consumer
surplus is
A) $3,000.
B) $15,000.
C) $22,500.
D) $45,000.
165) In the above figure, when the efficient quantity of gloves is produced, the total producer
surplus is
A) $3,000.
B) $15,000.
C) $22,500.
D) $45,000.
166) In the above figure, if the production of gloves was restricted to 2,000 a day, then the
deadweight loss would equal
A) $0, because 2,000 gloves per day is an efficient quantity of gloves to produce.
B) $2,000.
C) $5,000.
D) $10,000.
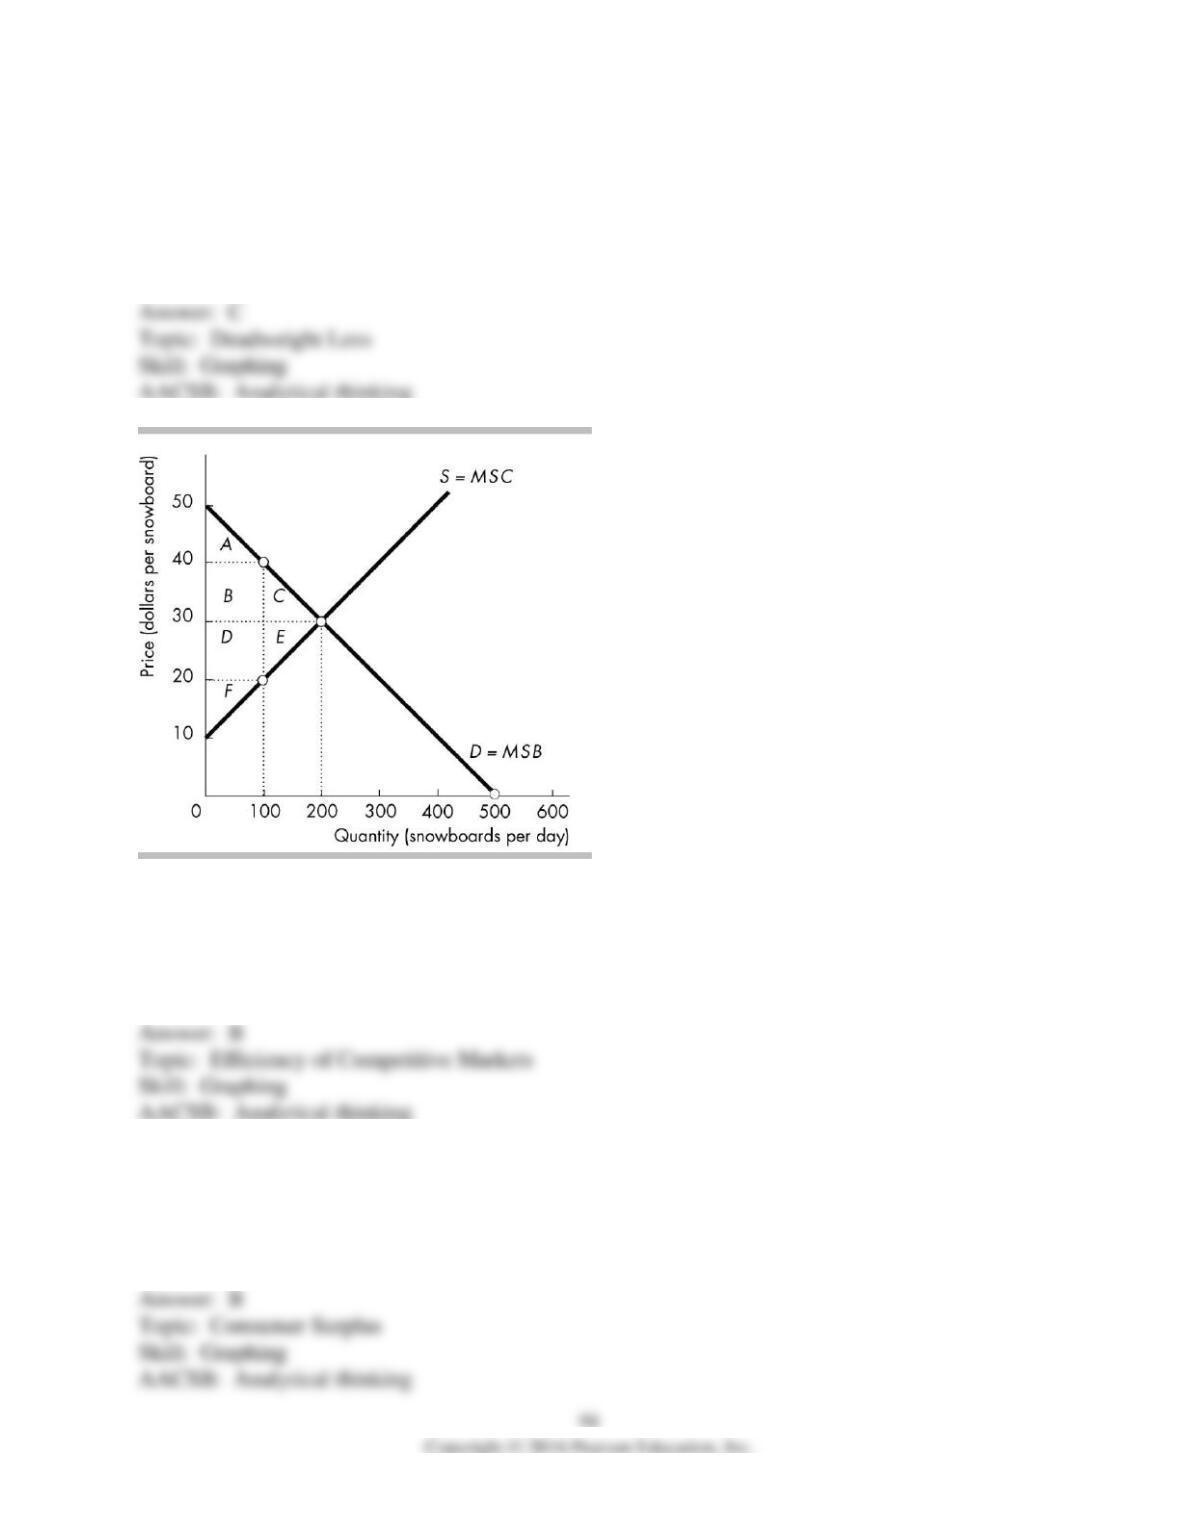
167) What is the efficient quantity of snowboards in the above figure?
A) 0
B) 100
C) 200
D) 500
168) What area in the above figure is the consumer surplus at the efficient quantity?
A) A
B) A + B + C
C) F
D) D + E + F
169) In the above figure, what is the amount of consumer surplus at the efficient quantity?
A) $0
B) $1,000
C) $2,000
D) $4,000
170) What area in the above figure is the producer surplus at the efficient quantity?
A) A
B) A + B + C
C) F
D) D + E + F
171) In the above figure, what is the amount of producer surplus at the efficient quantity?
A) $0
B) $1,000
C) $2,000
D) $4,000
172) Which area in the above figure is the deadweight loss if 100 snowboards are produced?
A) A + B + C
B) D + E + F
C) C + E
D) There is no deadweight loss when 100 snowboards are produced.
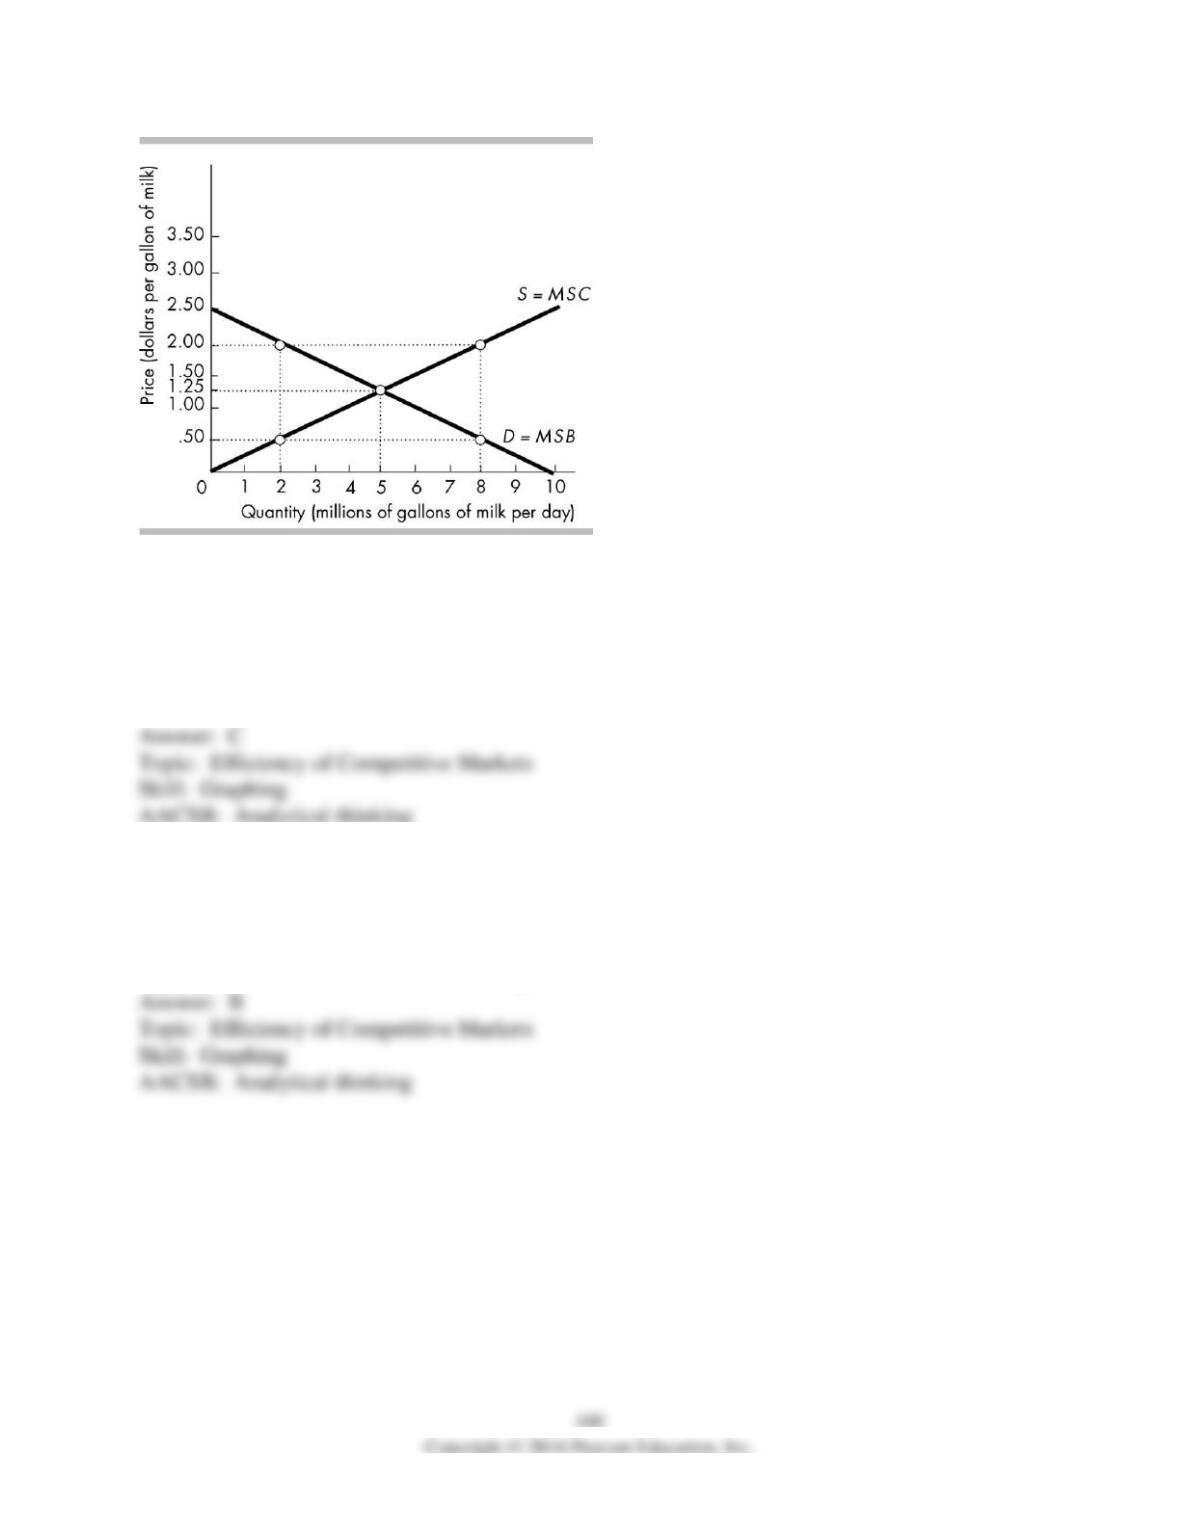
173) In the above figure, a price of $1.25 and a quantity of 5 million gallons of milk per day
maximizes the
A) amount of consumer surplus.
B) amount of producer surplus.
C) sum of consumer surplus and producer surplus.
D) All of the above answers are correct.
174) In the above figure, the efficient quantity of milk is
A) 10 million gallons per day.
B) 5 million gallons per day.
C) zero gallons per day.
D) None of the above because all of the quantities are efficient.