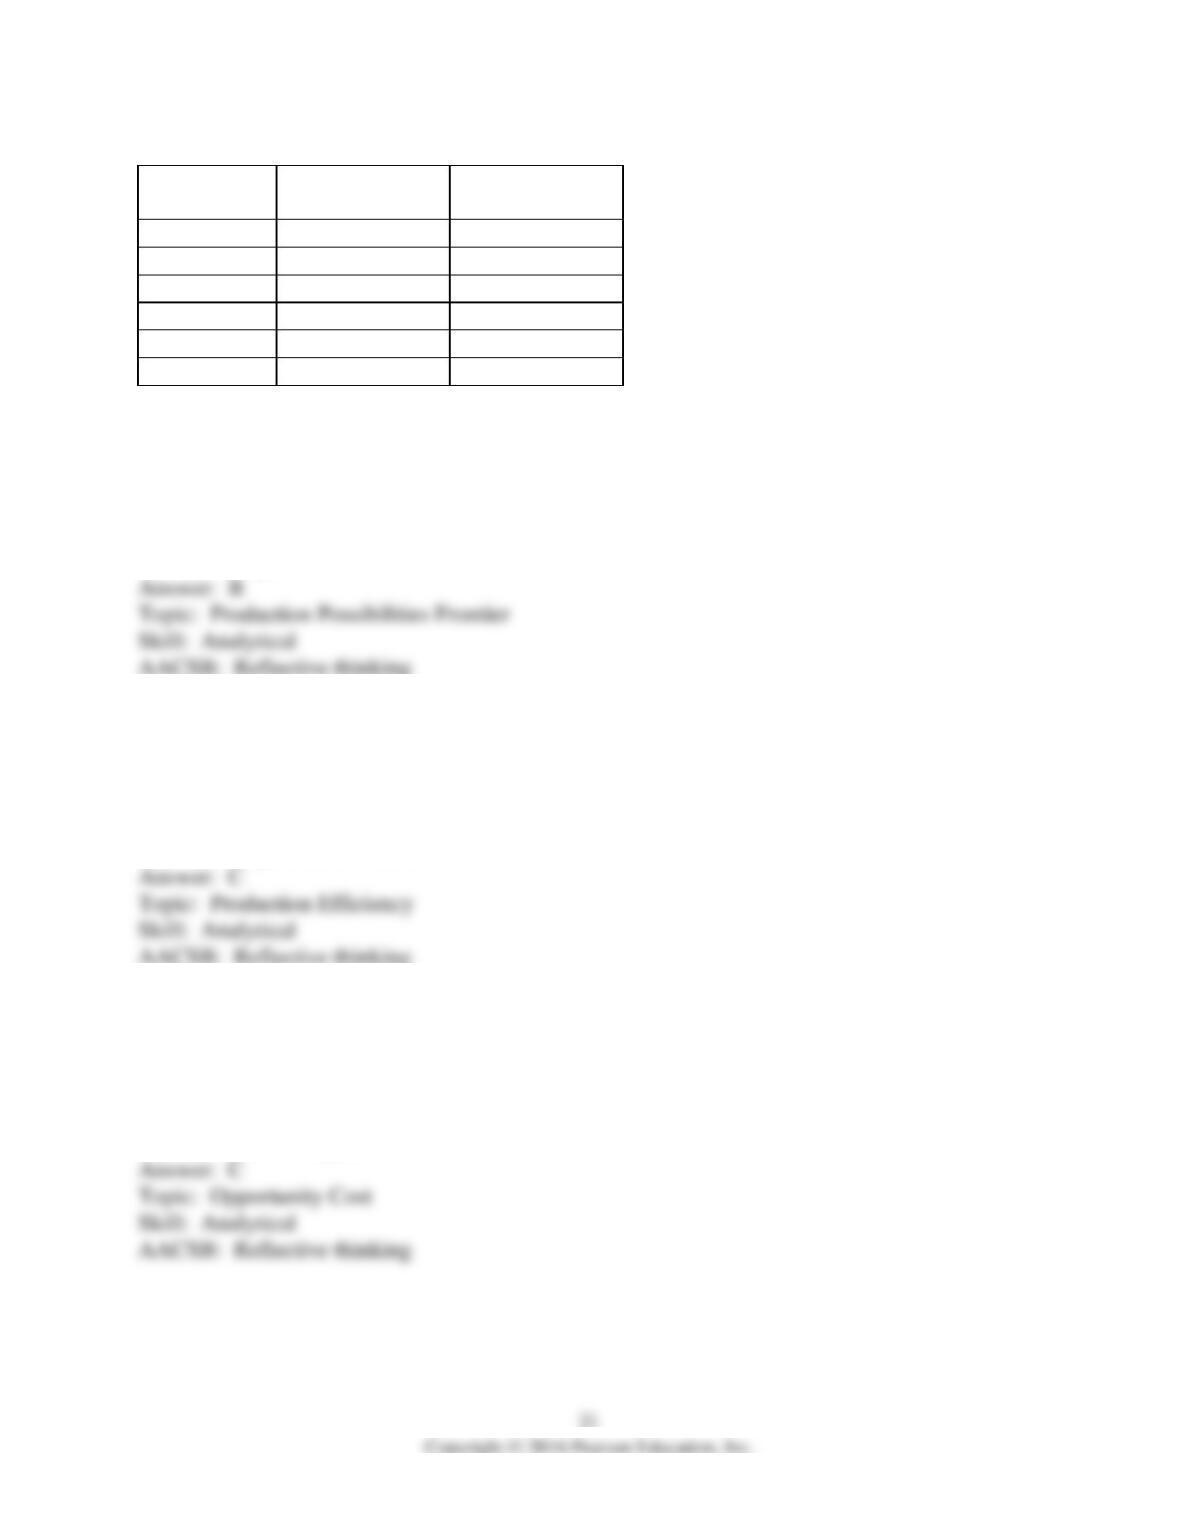
Point
Production of
grain (tons)
Production of
cars (cars)
A
0
30
B
2
28
C
4
24
D
6
18
E
8
10
F
10
0
71) The table above lists six points on the production possibilities frontier for grain and cars.
Given this information, which of the following combinations is unattainable?
A) 6 tons of grain and 18 cars
B) 4 tons of grain and 26 cars
C) 2 tons of grain and 27 cars
D) 7 tons of grain and 10 cars
72) The table above lists six points on the production possibilities frontier for grain and cars.
From this information you can conclude that production is inefficient if this economy produces
A) 6 tons of grain and 18 cars.
B) 4 tons of grain and 26 cars.
C) 2 tons of grain and 27 cars.
D) 8 tons of grain and 10 cars.
73) The table above lists six points on the production possibilities frontier for grain and cars.
What is the opportunity cost of producing the 5th ton of grain?
A) 16 cars per ton of grain
B) 6 cars per ton of grain
C) 3 cars per ton of grain
D) 2 cars per ton of grain
74) The table above lists six points on the production possibilities frontier for grain and cars.
What is the opportunity cost of producing the 26th car?
A) 2 tons of grain per car
B) 4 tons of grain per car
C) 0.25 tons of grain per car
D) 0.5 tons of grain per car
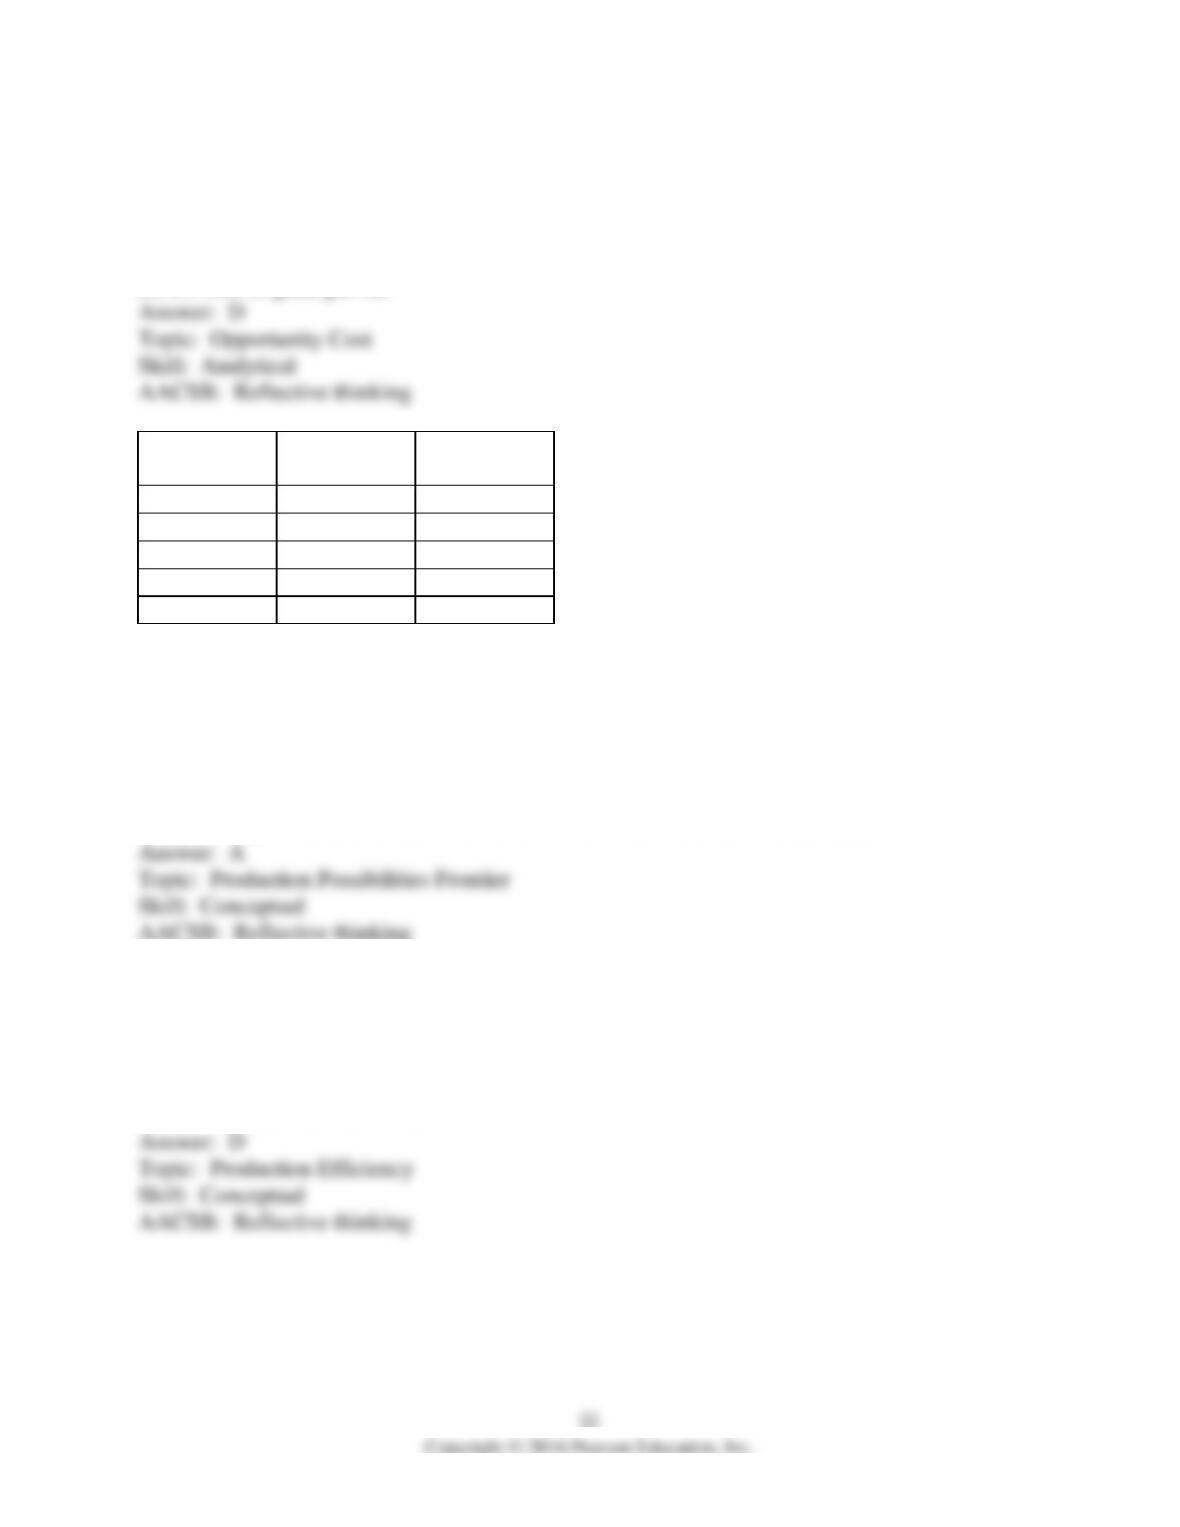
Point
Production
chocolate bars
Production
cans of cola
A
0
100
B
10
90
C
20
70
D
30
40
E
40
0
75) The above table shows production points on Sweet-Tooth Land’s production possibilities
frontier. Which of the following statements is TRUE?
A) Producing 0 chocolate bars and 100 cans of cola is both attainable and efficient.
B) Producing 20 chocolate bars and 80 cans of cola is attainable, but inefficient.
C) Producing 30 chocolate bars and 38 cans of cola is only attainable with an increase in
technology.
D) Producing 40 chocolate bars and 0 cans of cola is unattainable and inefficient.
76) The above table shows production points on Sweet-Tooth Land’s production possibilities
frontier. Which of the following is an example of a point that is inefficient?
A) 0 chocolate bars and 100 cans of cola
B) 20 chocolate bars and 80 cans of cola
C) 32 chocolate bars and 40 cans of cola
D) 38 chocolate bars and 0 cans of cola
77) The above table shows production points on Sweet-Tooth Land’s production possibilities
frontier. What is the opportunity cost of one chocolate bar if Sweet-tooth Land moves from point
C to point D?
A) 30 cans of cola per chocolate bar
B) 10 cans of cola per chocolate bar
C) 3 cans of cola per chocolate bar
D) 1/3 can of cola per chocolate bar
78) The above table shows production points on Sweet-Tooth Land’s production possibilities
frontier. What is the opportunity cost of one can of cola if Sweet-tooth Land moves from point C
to point B?
A) 20 chocolate bars per can of cola
B) 10 chocolate bars per can of cola
C) 2 chocolate bars per can of cola
D) 1/2 chocolate bars per can of cola
79) The above table shows production points on Sweet-Tooth Land’s production possibilities
frontier. A movement from ________ represents the greatest opportunity cost of increasing cola
production.
A) point E to point D
B) point D to point C
C) point C to point B
D) point B to point A
Point
Production of X
Production of Y
A
0
40
B
3
36
C
6
28
D
9
16
E
12
0
80) The above table shows production combinations on a country’s production possibilities
frontier. Which of the following is an example of a point that is unattainable?
A) 0 units of good X and 40 units of good Y
B) 6 units of good X and 28 units of good Y
C) 10 units of good X and 16 units of good Y
D) 3 units of good X and 35 units of good Y
81) The above table shows production combinations on a country’s production possibilities
frontier. Which of the following is an example of a production point that is inefficient?
A) 0 units of good X and 40 units of good Y
B) 6 units of good X and 28 units of good Y
C) 10 units of good X and 16 units of good Y
D) 3 units of good X and 35 units of good Y
82) The above table shows production combinations on a country’s production possibilities
frontier. Which of the following points signifies efficient production?
A) 0 units of good X and 40 units of good Y
B) 3 units of good X and 25 units of good Y
C) 10 units of good X and 16 units of good Y
D) 12 units of good X and 1 unit of good Y
83) The above table shows production combinations on a country’s production possibilities
frontier. The opportunity cost of increasing the production of Y from 16 to 28 units is ________
units of good X per unit of good Y.
A) 12
B) 6
C) 3
D) There is no opportunity cost when moving from one point to another along a production
possibilities frontier so none of the above answers is correct.
84) The above table shows production combinations on a country’s production possibilities
frontier. What is the opportunity cost of one unit of Y when the production of good Y increases
from 16 to 28 units?
A) 4 units of good X per unit of good Y
B) 3 units of good X per unit of good Y
C) 1/4 unit of good X per unit of good Y
D) There is no opportunity cost when moving from one point to another along a production
possibilities frontier.
85) The above table shows production combinations on a country’s production possibilities
frontier. What is the opportunity cost of increasing the production of X from 0 to 3 units?
A) 40 units of good Y per unit of good X
B) 3 units of good Y per unit of good X
C) 4/3 units of good Y per unit of good X
D) 0 units of good Y per unit of good X
86) The above table shows production combinations on a country’s production possibilities
frontier. A movement from ________ involves the greatest opportunity cost of increasing the
production of good Y.
A) point E to point D
B) point D to point C
C) point C to point B
D) point B to point A
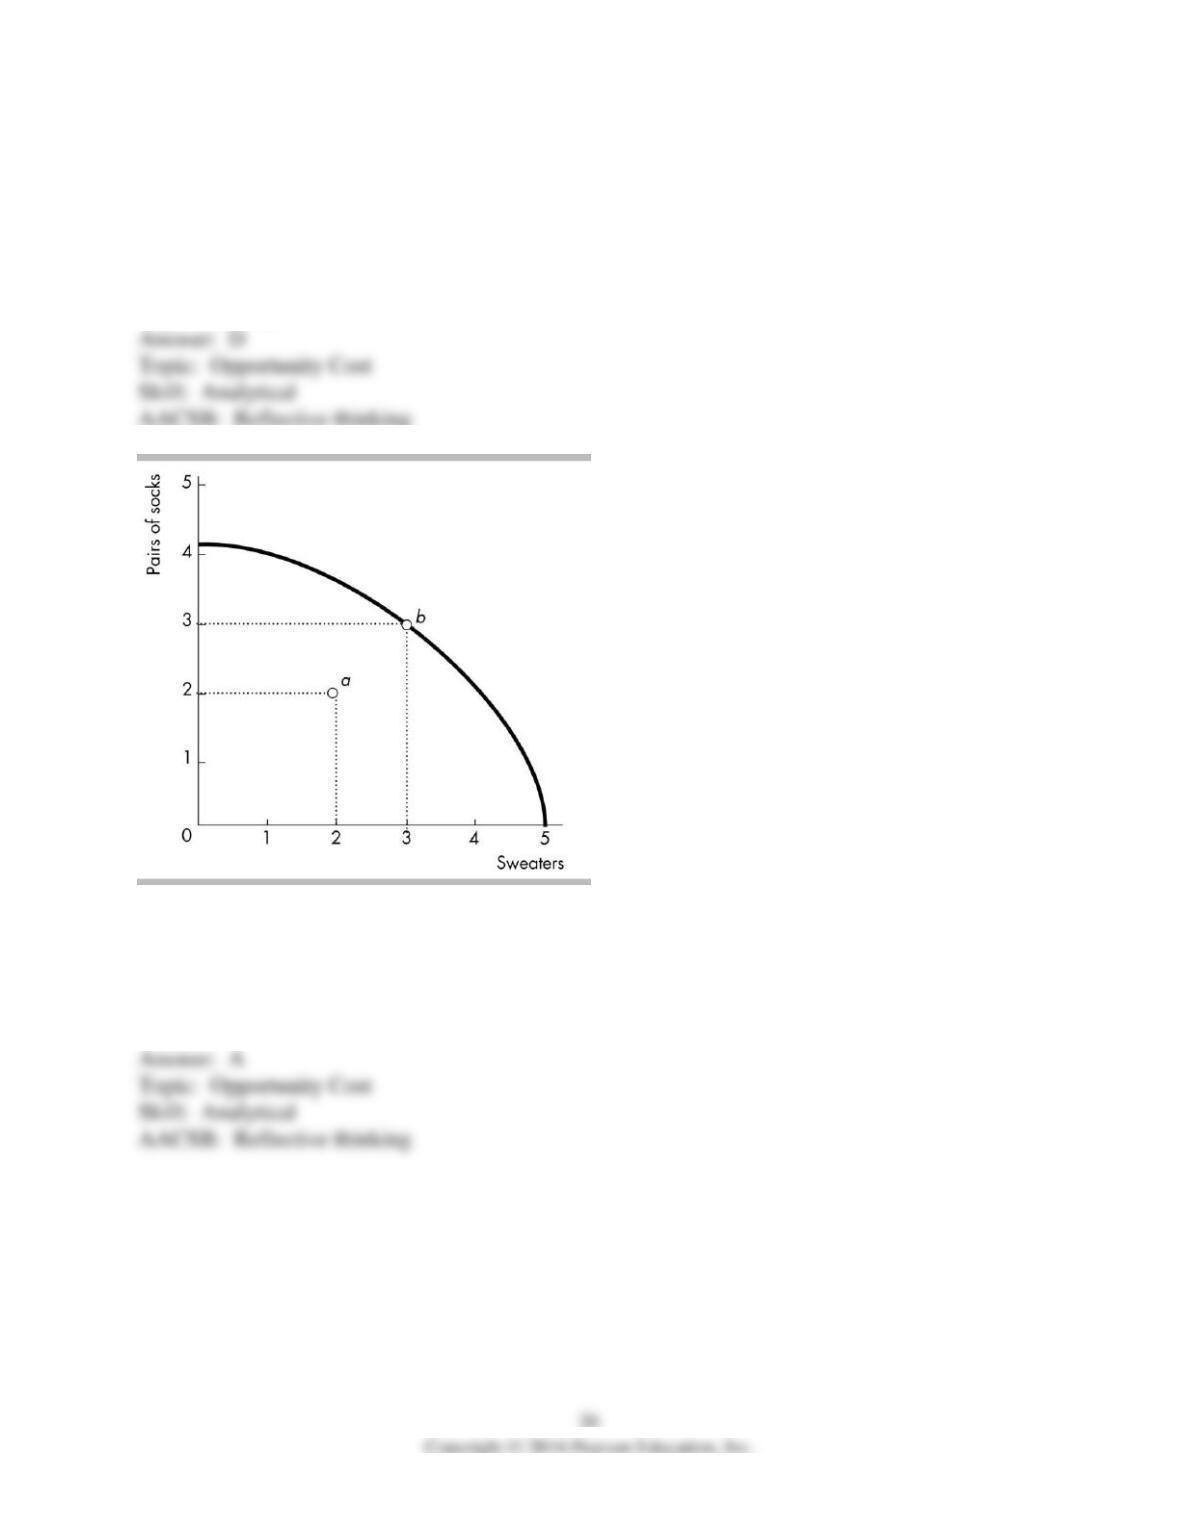
87) The opportunity cost of moving from point a to point b in the above figure is ________.
A) zero
B) 3/2 pairs of socks per sweater
C) 3 pairs of socks
D) 2 sweaters
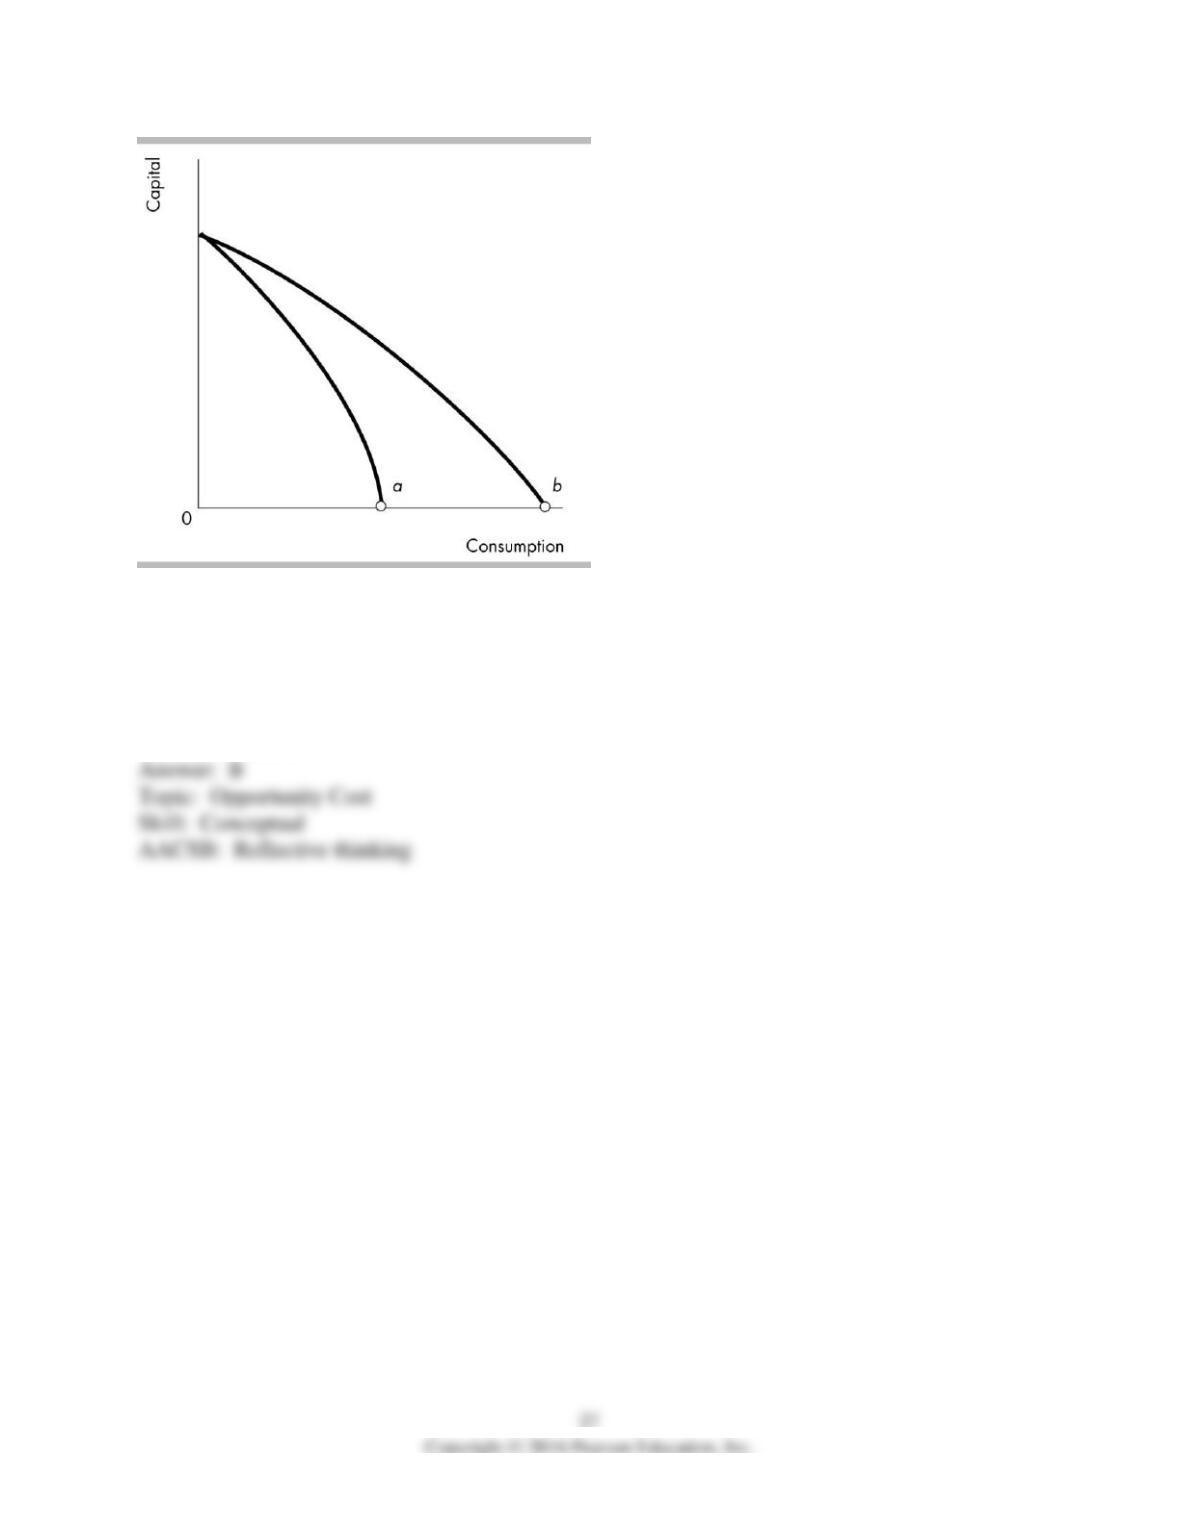
88) The opportunity cost of producing a unit of consumption at point b in the figure ________
point a.
A) is greater than at
B) is less than at
C) cannot be compared with
D) is the same as
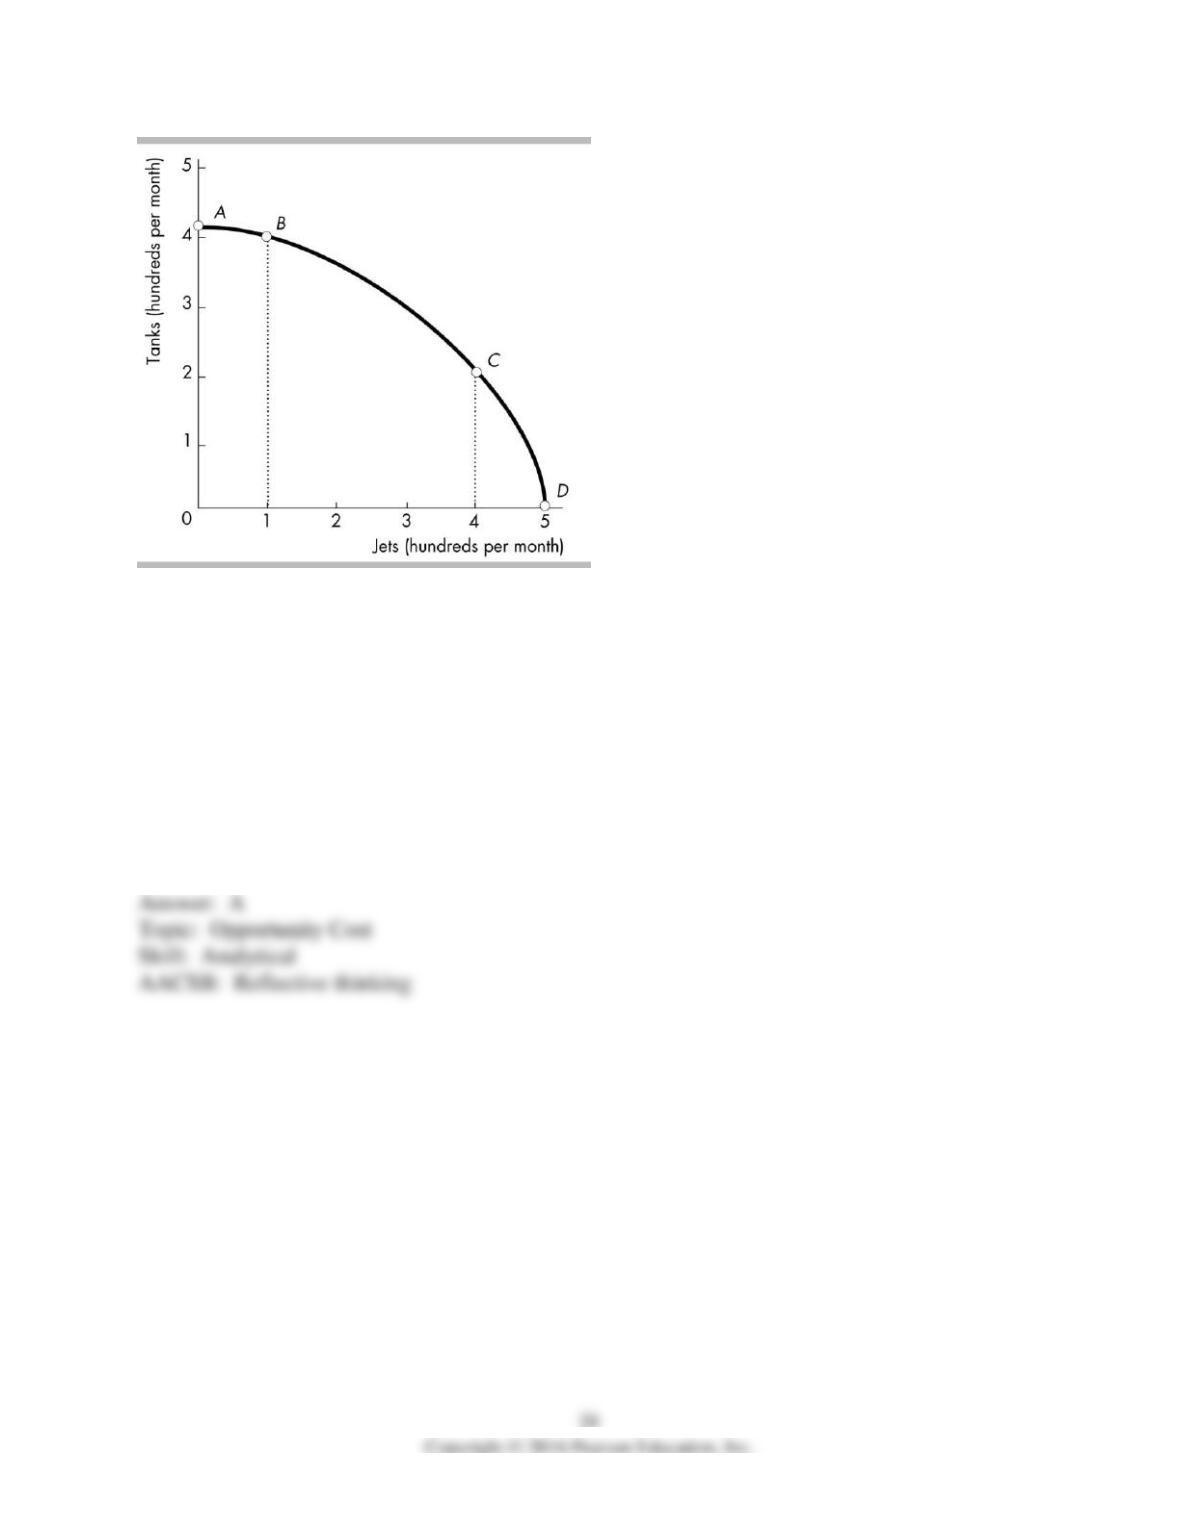
89) In the above figure, which of the following is TRUE regarding the movements from point A
to B and from point C to D?
I) The movement from point A to B shows that the economy has chosen to produce 100 more
jets.
II) The movement from point C to D shows that the economy has chosen to produce 100 more
jets.
III) The movement from point A to B and from point C to D have the same opportunity cost.
A) I and II
B) I and III
C) II and III
D) I, II and III
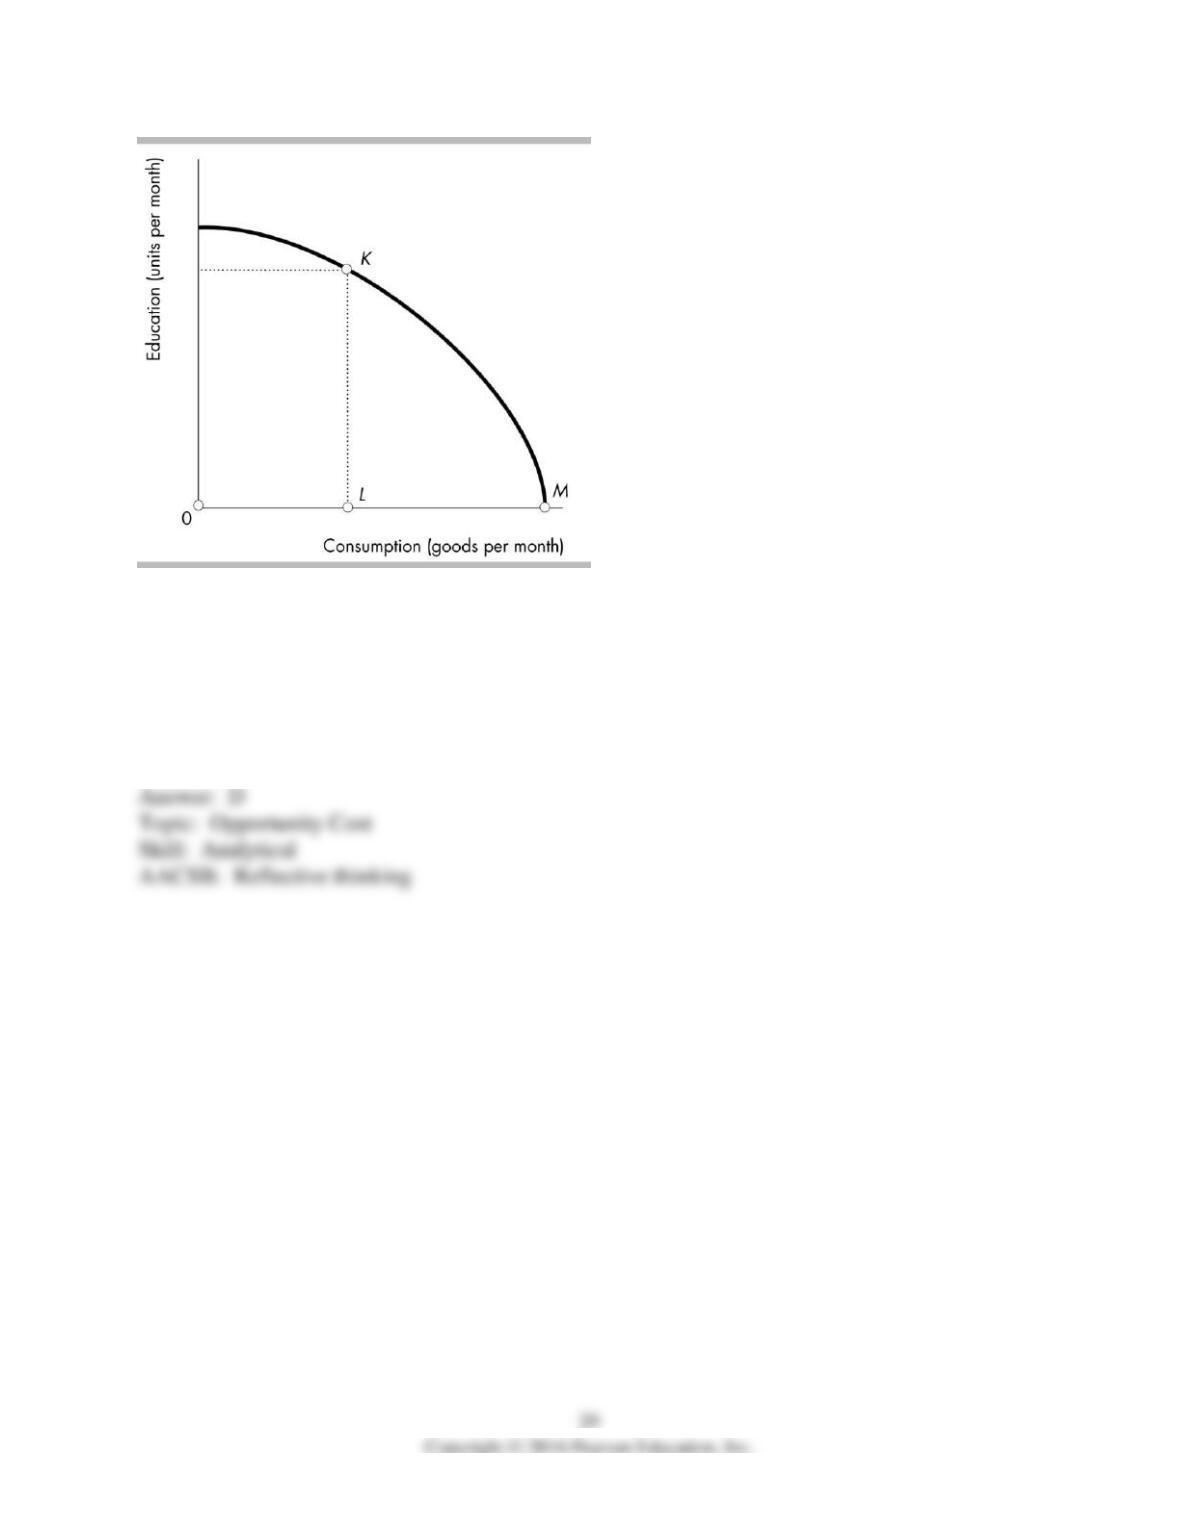
90) Molly just graduated from high school. The figure shows her possibilities frontier. If Molly
goes to college, she will move from point M to point K. In terms of consumption goods, Molly’s
opportunity cost of going to college is
A) MK.
B) OL.
C) KL.
D) LM.
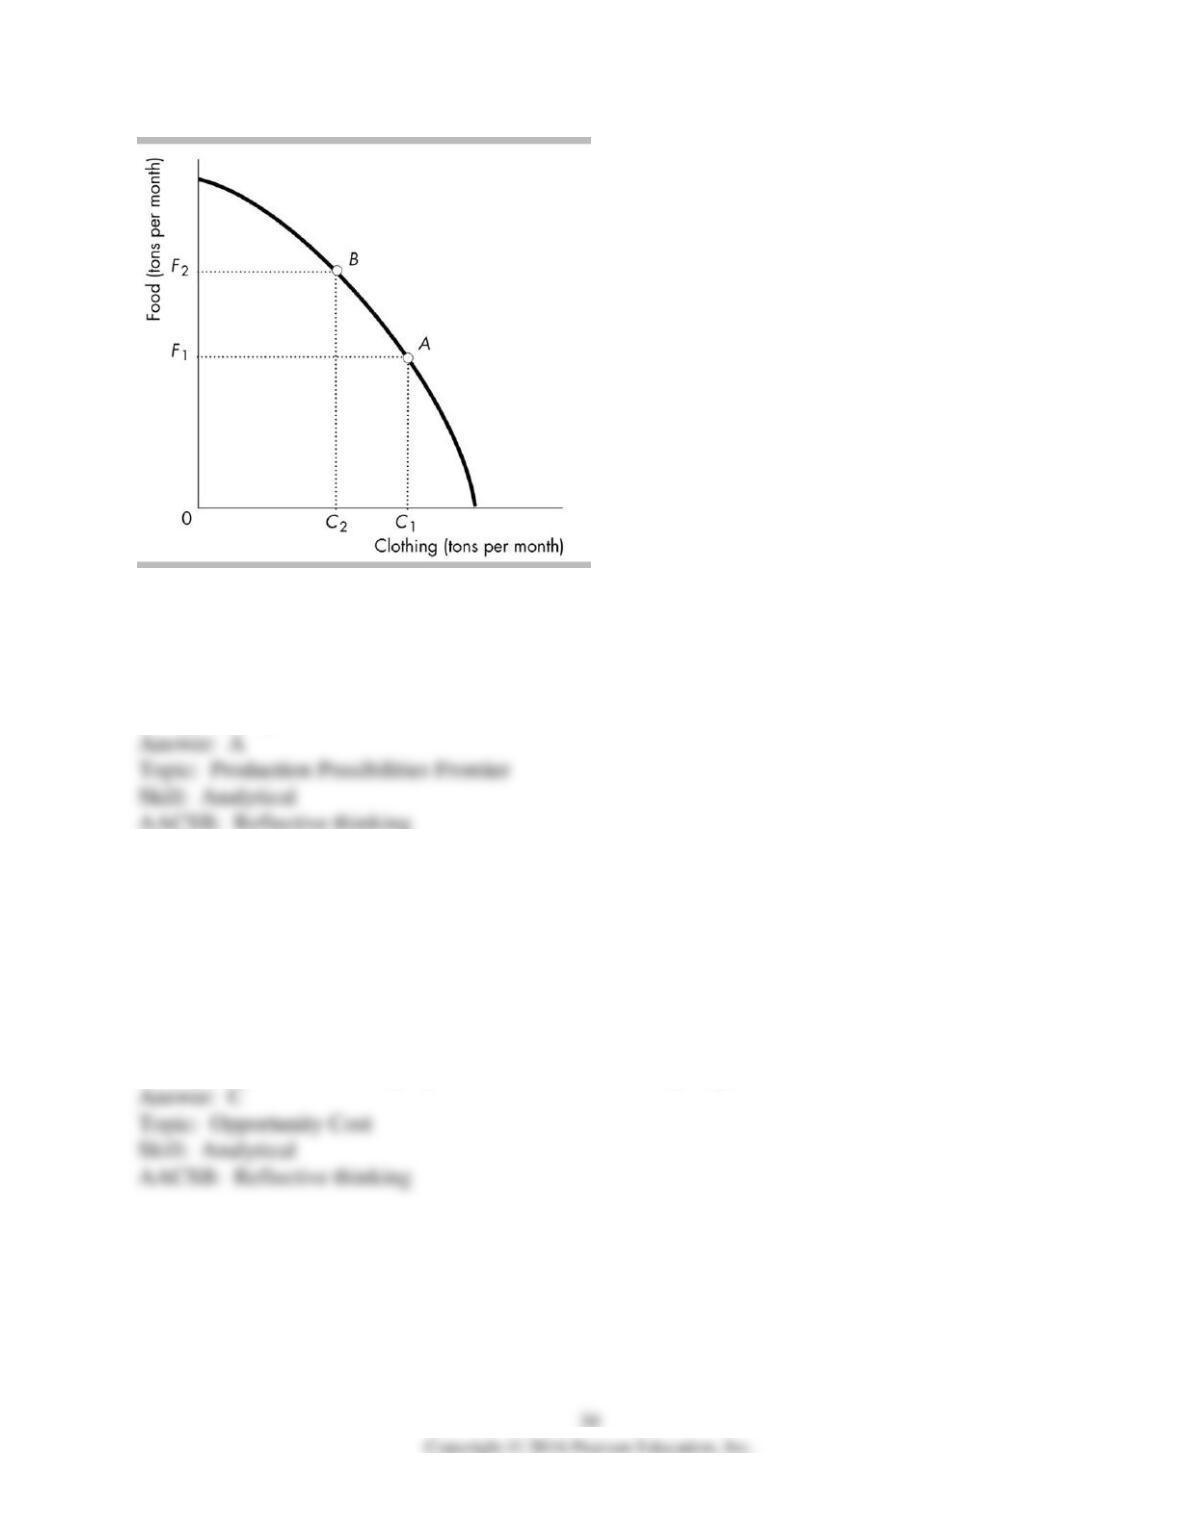
91) In the figure above, the curve is known as the
A) production possibilities frontier.
B) substitution options frontier.
C) production function.
D) opportunity cost curve.
92) The figure above illustrates that if this country wishes to have F2 – F1 additional food by
moving from point A to point B, it will
A) have to find additional workers, because the country already is operating on its production
possibilities frontier.
B) be unable to do so until additional technological progress is made.
C) have to sacrifice C1 – C2 clothing in order to free the resources necessary to produce the
additional food.
D) require that all the unemployed resources in the country be put to work.
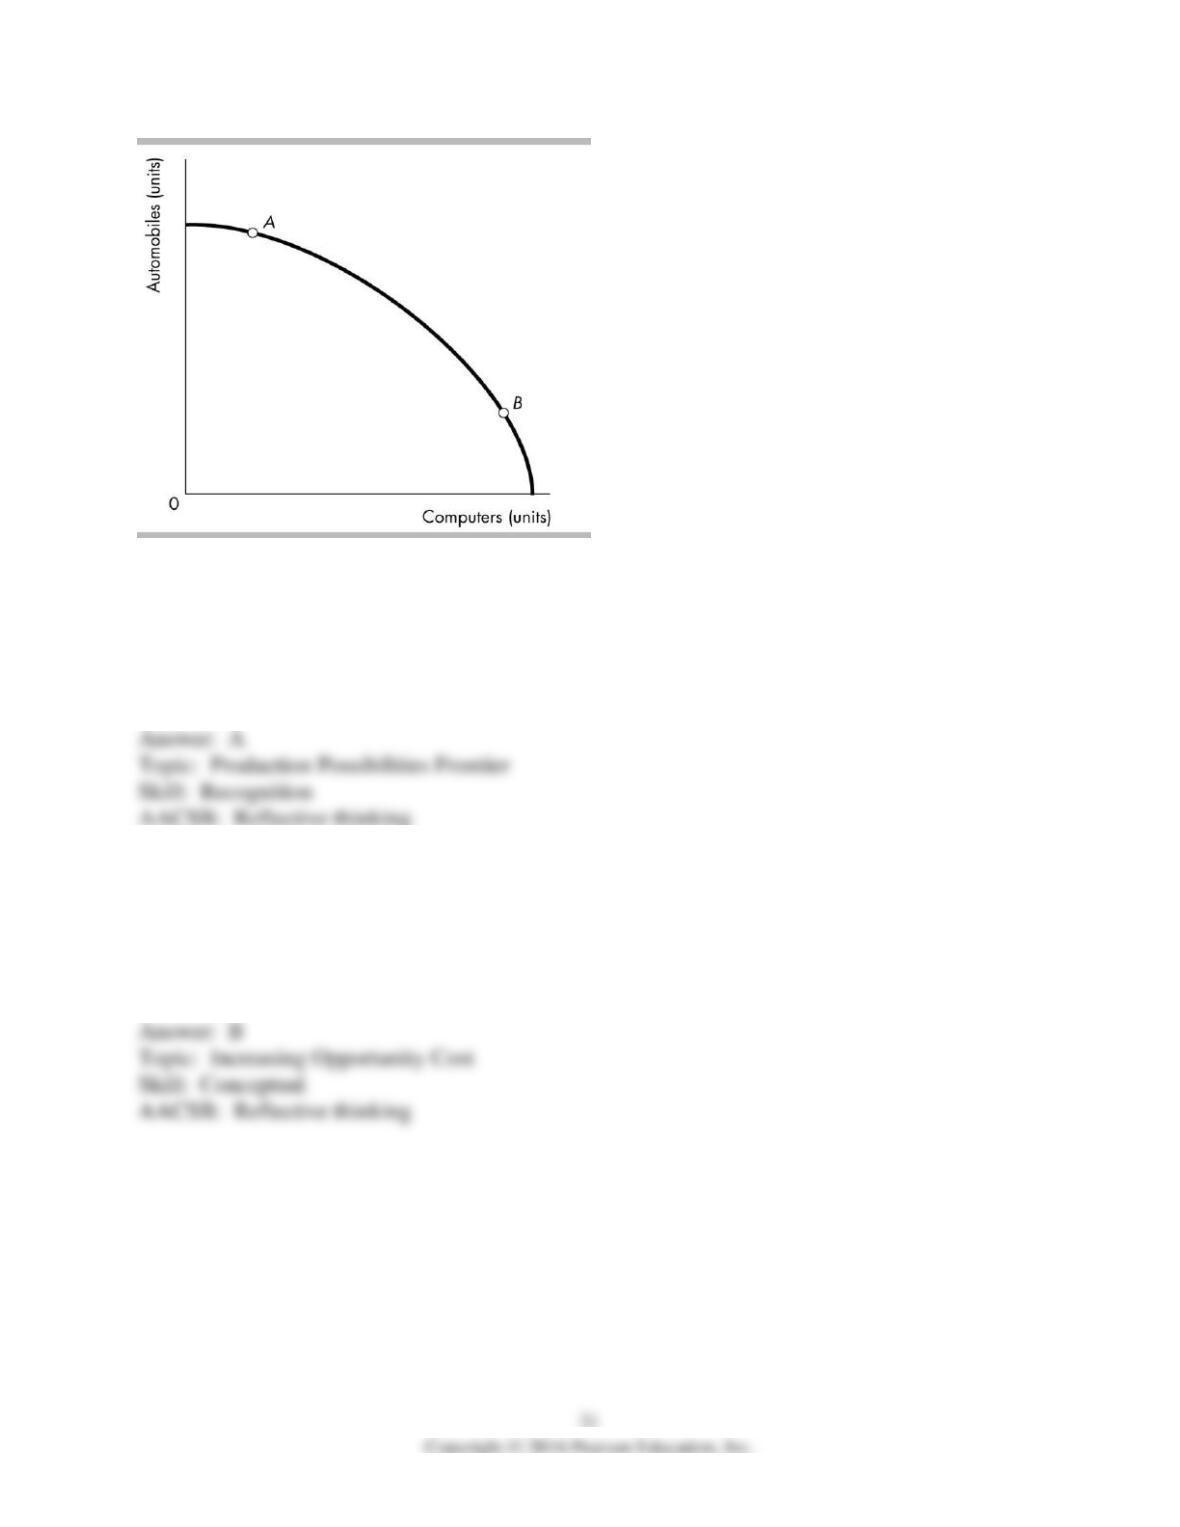
93) The bowed outward shape of the production possibilities frontier in the above figure
indicates that
A) some resources are better suited for producing computers.
B) the opportunity cost of producing more computers decreases as more computers are produced.
C) computer technology is subject to the principle of decreasing costs.
D) All of the above answers are correct.
94) According to the figure above, the opportunity cost of producing another computer is
A) higher at A.
B) higher at B.
C) the same at every point along the frontier.
D) different at most points along the frontier but equal at points A and B because they are equally
distant from the axes.
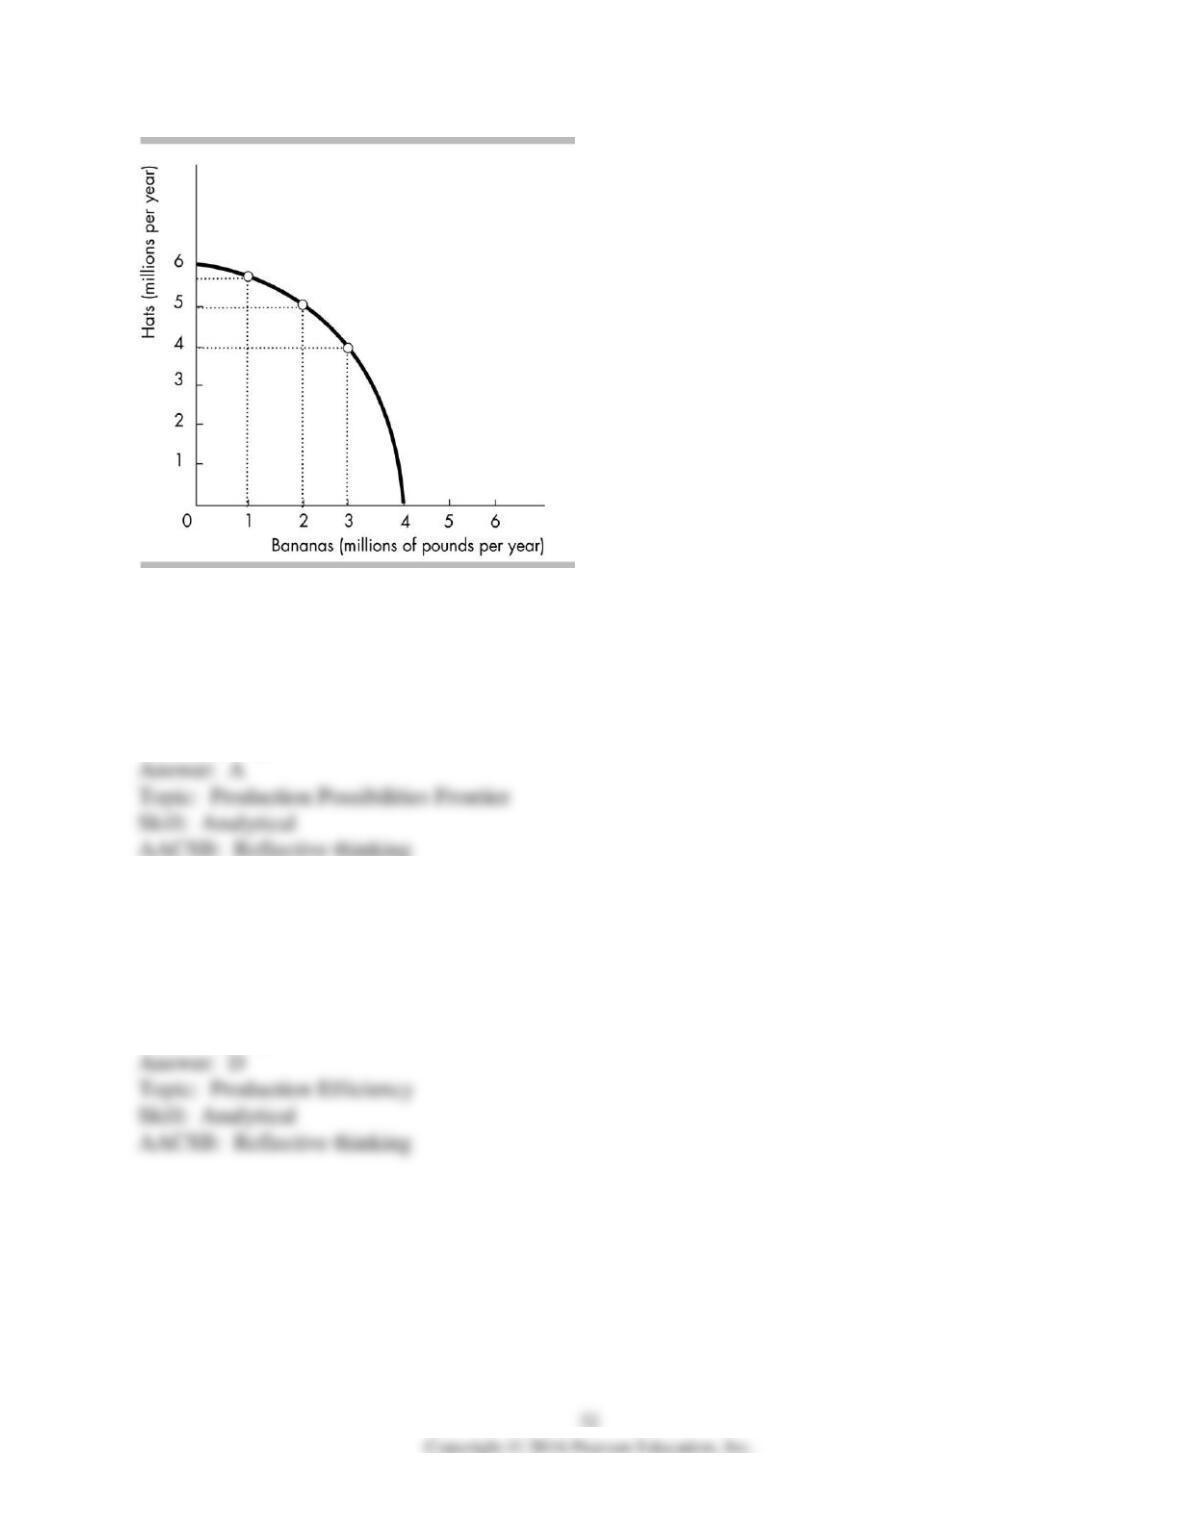
95) In the production possibilities frontier depicted in the figure above, which of the following
combinations of hats and bananas is unattainable?
A) 4 million pounds of bananas and 4 million hats
B) 2 million pounds of bananas and 5 million hats
C) 0 pounds of bananas and 6 million hats
D) 1 million pounds of bananas and 3 million hats
96) In the production possibilities frontier depicted in the figure above, which of the following
combinations of hats and bananas is inefficient?
A) 4 million pounds of bananas and 4 million hats
B) 2 million pounds of bananas and 5 million hats
C) 0 pounds of bananas and 6 million hats
D) 1 million pounds of bananas and 3 million hats
97) In the production possibilities frontier depicted in the figure above, what is the opportunity
cost of increasing the production of bananas from two million pounds to three million pounds?
A) 1/2 hat per pound of bananas
B) 1 hat per pound of bananas
C) 2 hats per pound of bananas
D) 3 hats per pound of bananas
98) Jane produces only corn, measured in tons, and cloth, measured in bolts. For her, the
opportunity cost of one more ton of corn is
A) the same as the opportunity cost of one more bolt of cloth.
B) the inverse of the opportunity cost of one more bolt of cloth.
C) the ratio of all the bolts of cloth she produces to all the tons of corn she produces.
D) the ratio of all the tons of corn she produces to all the bolts of cloth she produces.
99) The principle of increasing opportunity cost leads to
A) a production possibilities frontier (PPF) that is bowed inward from the origin.
B) a production possibilities frontier (PPF) that is bowed outward from the origin.
C) an inward shift of the production possibilities frontier (PPF).
D) an outward shift of the production possibilities frontier (PPF).
100) A PPF bows outward because
A) not all resources are equally productive in all activities.
B) consumers prefer about equal amounts of the different goods.
C) entrepreneurial talent is more abundant than human capital.
D) resources are used inefficiently.
101) Generally, opportunity costs increase and the production possibilities frontier bows
outward. Why?
A) Unemployment is inevitable.
B) Resources are not equally useful in all activities.
C) Technology is slow to change.
D) Labor is scarcer than capital.
102) Increasing opportunity cost occurs along a production possibilities frontier because
A) resources are not equally productive in all activities.
B) increasing wants need to be satisfied.
C) in order to produce more of one good decreasing amounts of another good must be sacrificed.
D) production takes time.
103) Increasing opportunity cost while moving along a production possibilities frontier is the
result of
A) taxes.
B) firms’ needs to produce profits.
C) the fact that it is more difficult to use resources efficiently the more society produces.
D) the fact that resources are not equally productive in alternative uses.
104) Increasing opportunity cost implies that
A) producing additional units of one good results in proportionately smaller reductions in the
output of the other good.
B) producing additional units of one good results in increasing amounts of lost output of the
other good.
C) the production possibilities frontier will be a straight line.
D) the society will be producing inside its production possibilities frontier.
105) When the production possibilities frontier is bowed outwards, the opportunity cost of
producing more of one good
A) increases in terms of the amount foregone of the other good.
B) decreases in terms of the amount foregone of the other good.
C) remains constant.
D) cannot be determined.
106) As a country that has a bowed-out production possibilities frontier produces more of one
good, the opportunity cost of a unit of that good ________.
A) might increase or decrease
B) remains the same
C) increases
D) decreases
107) As we move along a bowed-out production possibility frontier, producing more tacos and
less pizza, the opportunity cost of a pizza ________.
A) increases
B) remains the same
C) decreases
D) increases and then decreases
108) The production possibilities frontier bows outward because
A) opportunity costs are decreasing as the production of a good increases.
B) opportunity costs are increasing as the production of a good increases.
C) opportunity costs are fixed as the production of a good increases.
D) resources are of uniform quality.
109) The fact of increasing opportunity costs means that a production possibilities frontier will
A) be a straight line.
B) reach a maximum and then gradually decrease.
C) bow outward.
D) shift outward over time.
110) A bowed outward production possibilities frontier occurs when
A) opportunity costs are constant.
B) resources are not scarce.
C) as more of a good is produced, producing additional units of it require greater reductions in
the other good.
D) the society is operating on the production possibilities frontier.
111) When the production possibilities frontier bows outward from the origin
A) some of society’s resources are unemployed.
B) opportunity costs are constant.
C) opportunity costs are increasing.
D) opportunity costs are decreasing.
112) The slope of a production possibilities frontier that displays increasing opportunity cost is
A) positive and constant.
B) negative and constant.
C) steeper near the horizontal intercept than near the vertical intercept.
D) steeper near the vertical intercept than near the horizontal intercept.
113) Assuming farmers can plant either corn or soybeans, as U.S. farmers plant more corn to
meet rising global demand
A) the opportunity cost of producing corn increases.
B) the opportunity cost of producing corn decreases.
C) the U.S. PPF for corn and other goods and services shifts outward.
D) the United States produces at a point beyond its PPF.
114) The fact that individual productive resources are NOT equally useful in all activities
A) implies that a production possibilities frontier will be bowed outward.
B) implies that gain from specialization and trade is unlikely.
C) follows from the law of demand.
D) implies a linear production possibilities frontier.
115) Consider a PPF for tapes and soda. If the opportunity cost of a tape increases as the
quantity of tapes produced increases and also the opportunity cost of a soda increases as the
quantity of soda produced increases, then the PPF between the two goods will be
A) a straight, downward-sloping line.
B) a straight, upward-sloping line.
C) bowed outward.
D) All of the above are possible and more information is needed to determine which answer is
correct.
116) One point on a PPF shows production levels at 50 tons of coffee and 100 tons of bananas.
Remaining on the PPF, an increase of banana production to 140 tons shows coffee production at
30 tons. Still remaining on the PPF, coffee production at 10 tons allows banana production at
160 tons. The opportunity cost of a ton of bananas is
A) constant because coffee production decreased by the same amount each time.
B) decreasing, since the increase in banana production is less at each point considered.
C) 16 to 1, that is every 1 ton of coffee given up will result in 16 more tons of bananas.
D) increasing from 1/2 ton of coffee per ton of bananas to 1 ton of coffee per ton of bananas.
117) The nation’s production possibilities frontier is bowed outward. Suppose that the
government decides to increase the production of armaments by $20 billion, and that as a result
the output of consumer goods falls by $20 billion. If a further $20 billion increase beyond the
initial $20 billion increase in armaments output is sought, we can expect that the output of
consumer goods and services will fall further by
A) less than $20 billion.
B) $20 billion.
C) more than $20 billion.
D) There is not enough information to determine the answer.
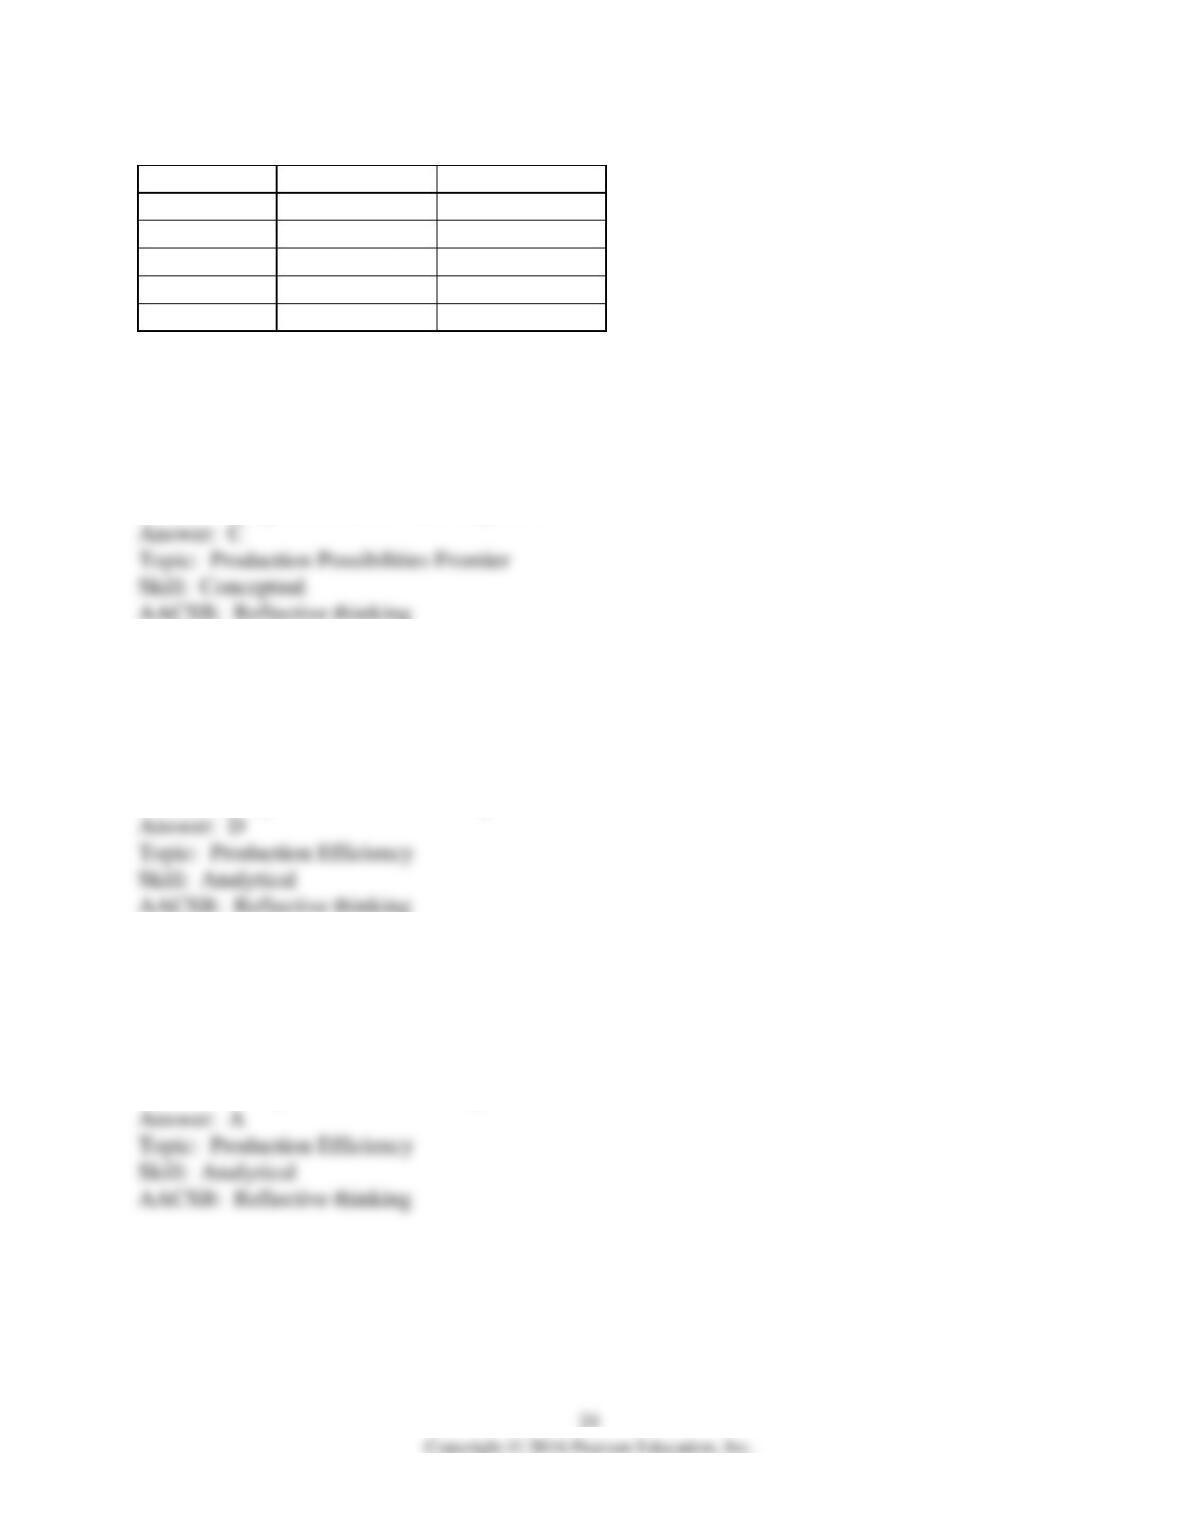
Production possibilities
Possibility
Pizza
(per hour)
Soda
(cases per
hour)
A
0
100
B
1
95
C
2
80
D
3
60
E
4
35
F
5
0
118) In the above table, the production of 3 pizzas and 80 cases of soda is
A) impossible unless more resources become available or technology improves.
B) feasible but would involve unemployed or misallocated resources.
C) possible only if the economy produces with maximum efficiency.
D) possible only if there is inflation.
119) In the above table, the production of 3 pizzas and 35 cases of soda is
A) impossible unless more resources become available.
B) feasible but would involve unemployed or misallocated resources.
C) possible only if the economy produces with maximum efficiency.
D) possible only if there is inflation.
120) In the above table, the opportunity cost of the 2nd pizza is
A) 0 cases of soda per pizza.
B) 15 cases of soda per pizza.
C) 95 cases of soda per pizza.
D) 80 cases of soda per pizza.
121) Based on the above table, as the production of pizza increases, the opportunity cost of pizza
in terms of forgone cases of soda
A) increases.
B) decreases.
C) does not change.
D) initially increases then decreases.
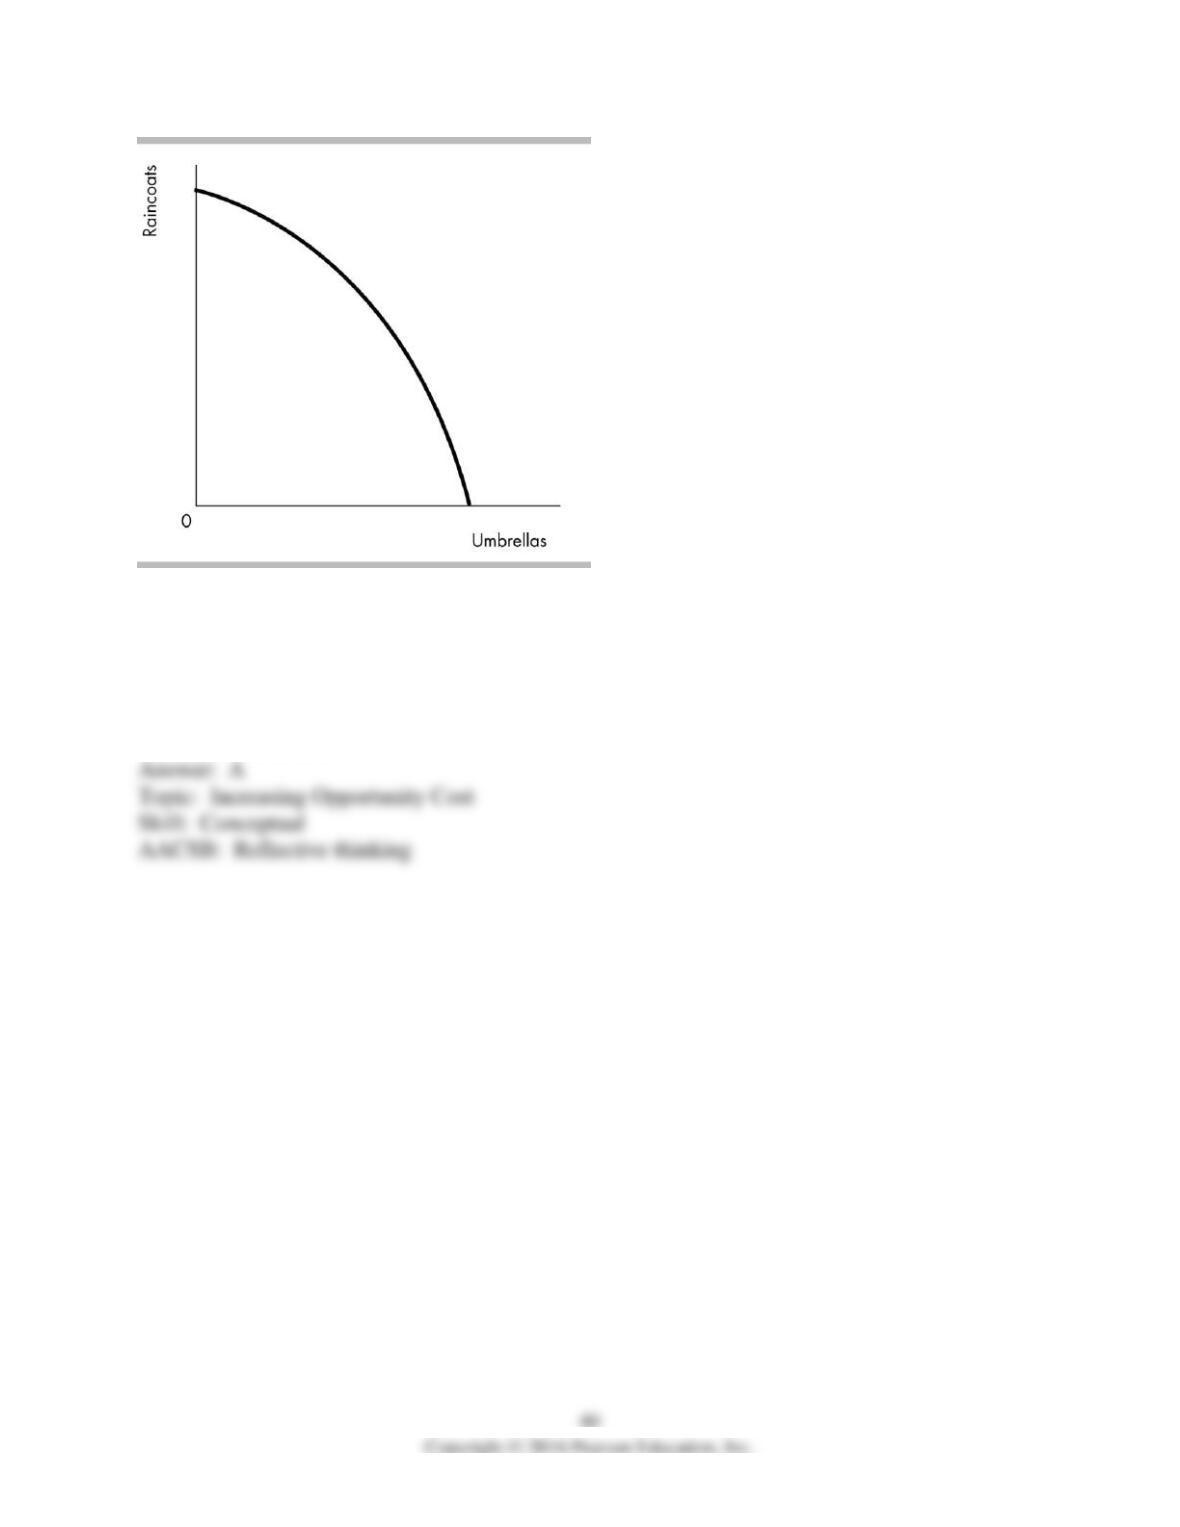
122) As Rainclouds Inc. moves downward along its production possibilities frontier, illustrated
in the figure above, the opportunity cost of a raincoat ________.
A) decreases
B) depends on the initial quantity produced
C) increases
D) remains the same