9 Extended Problems
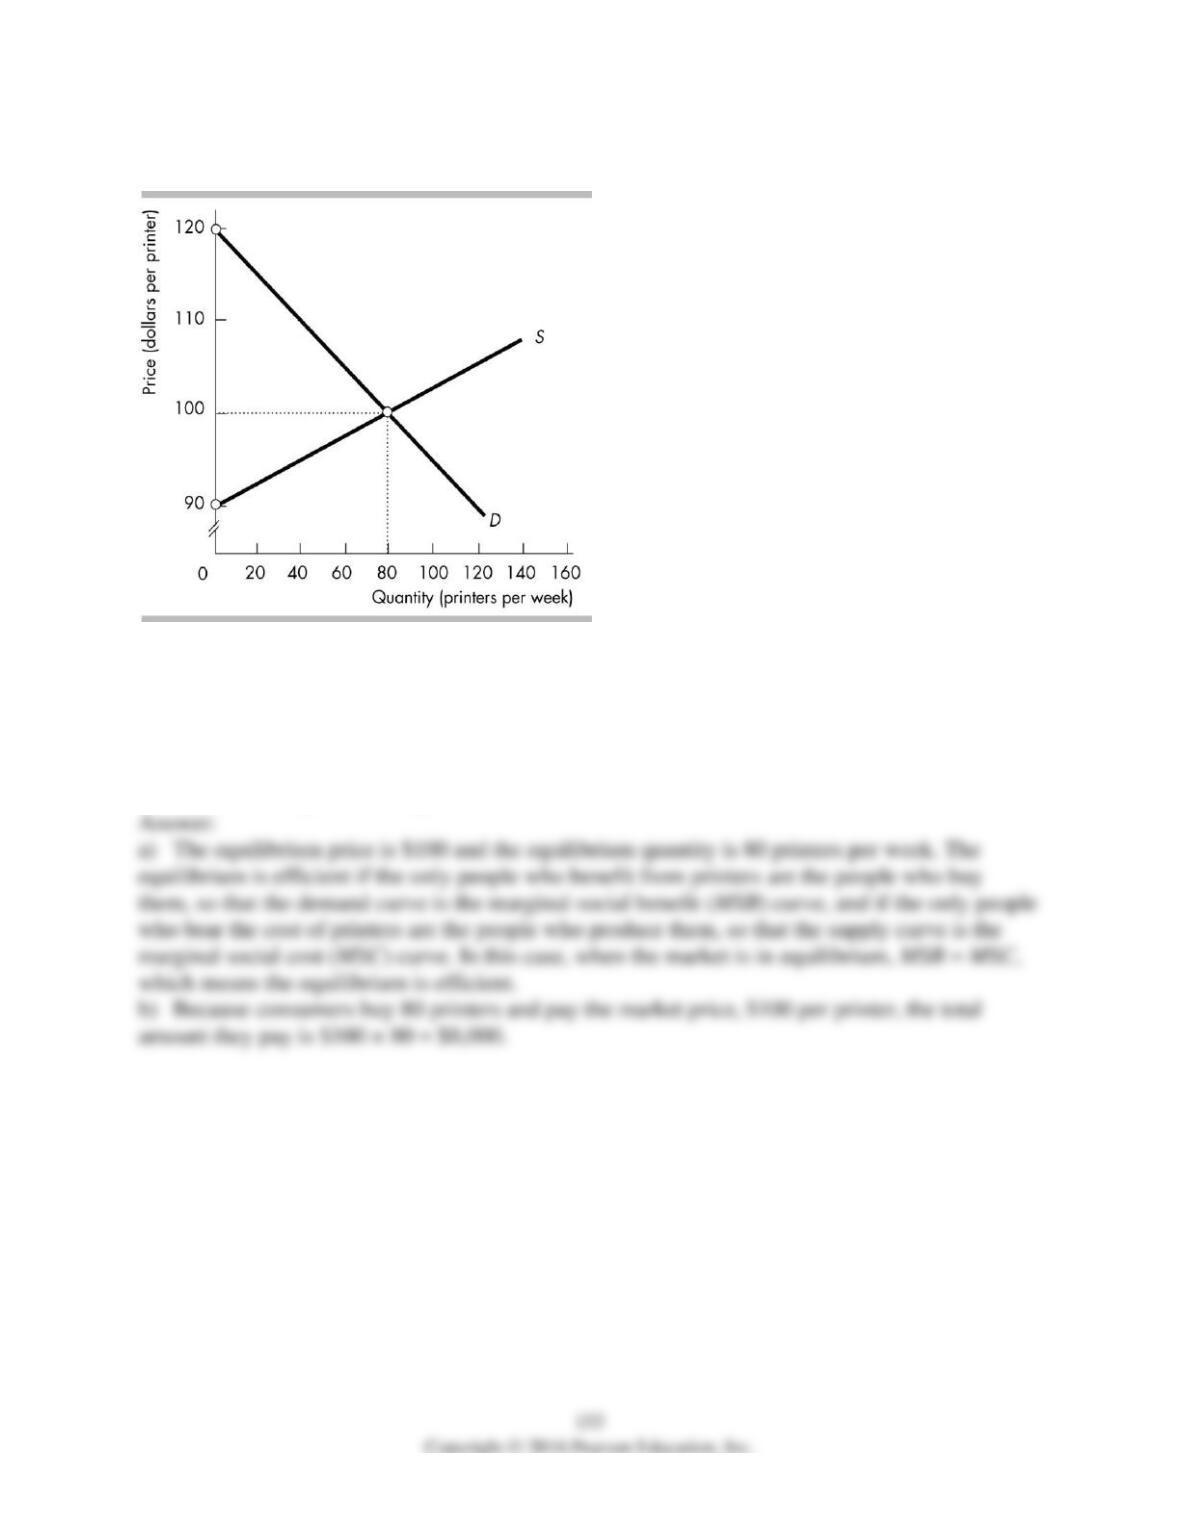
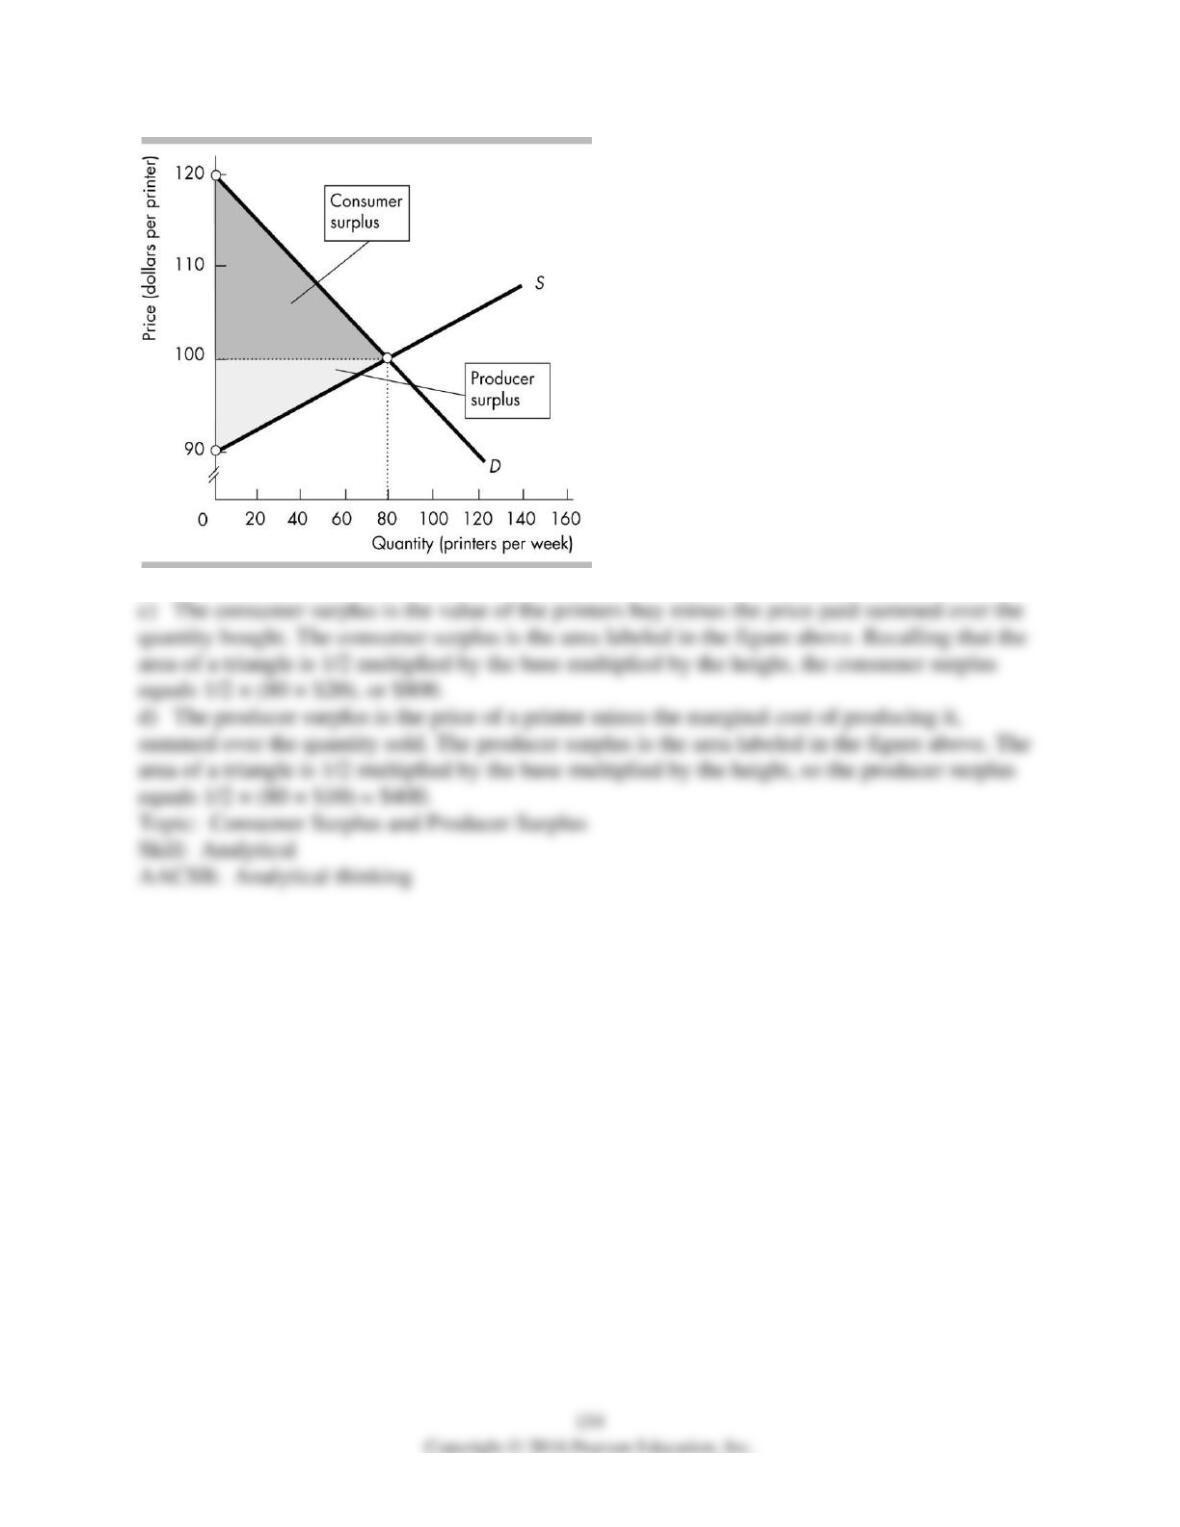
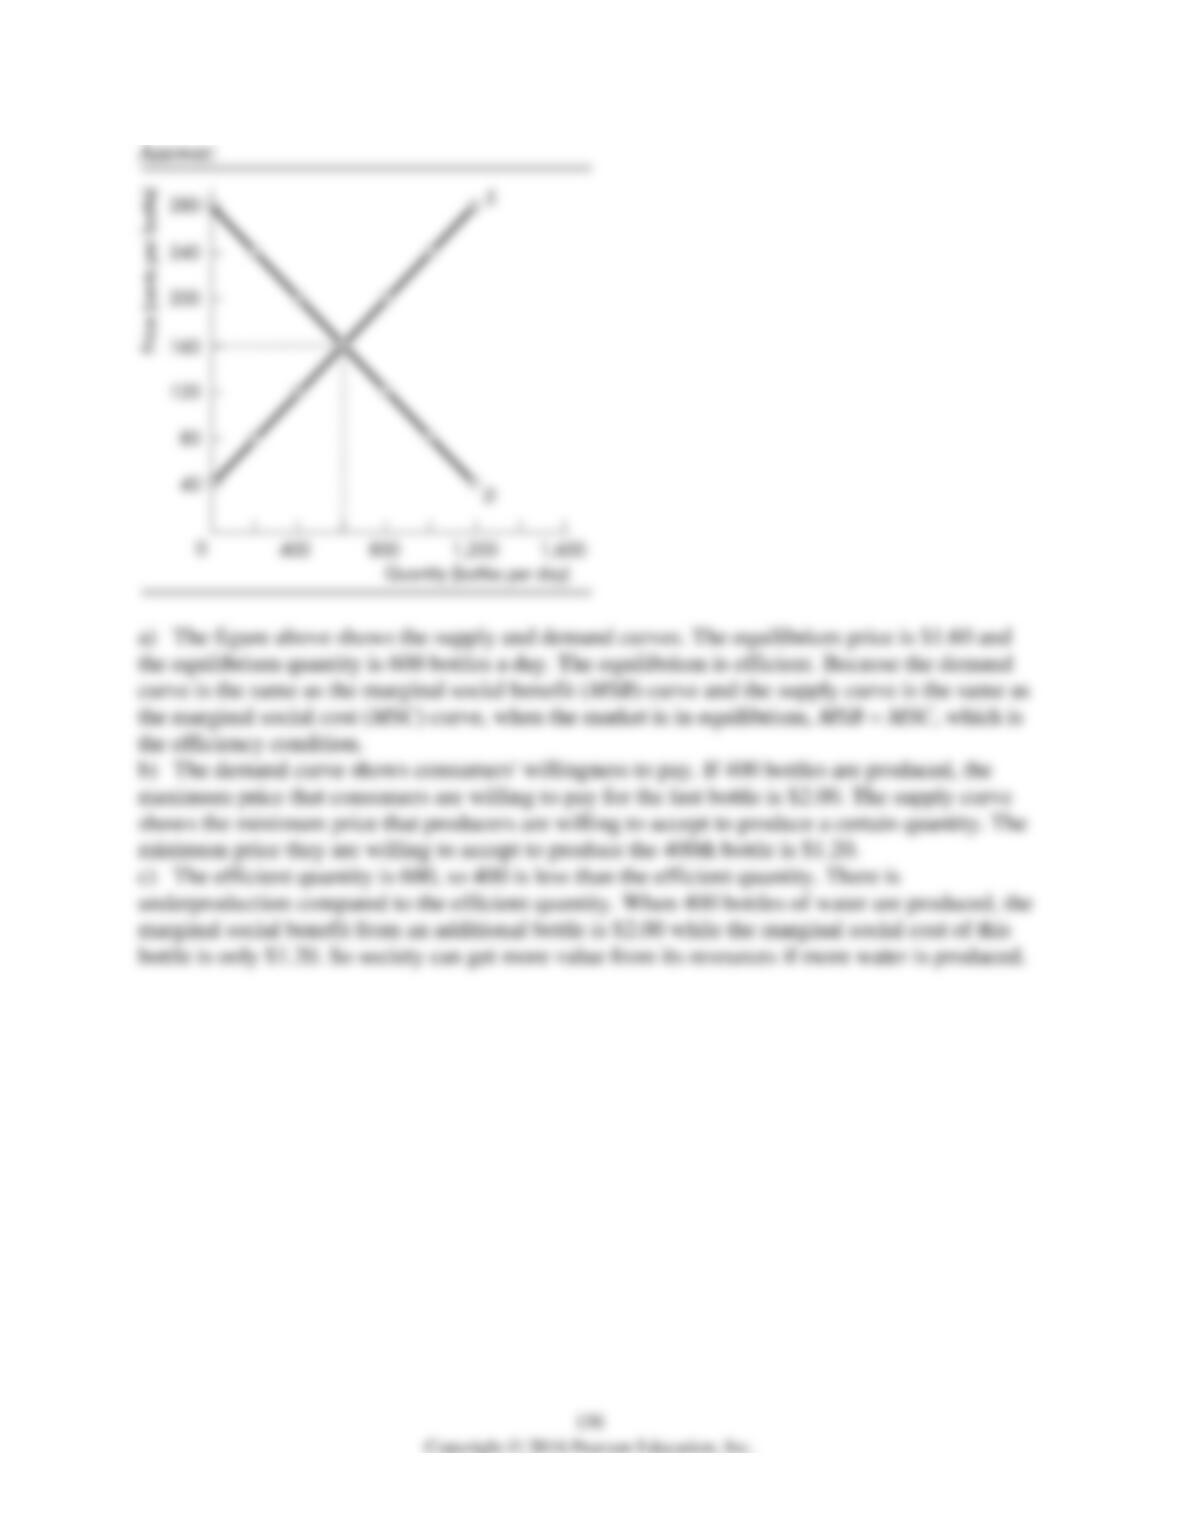
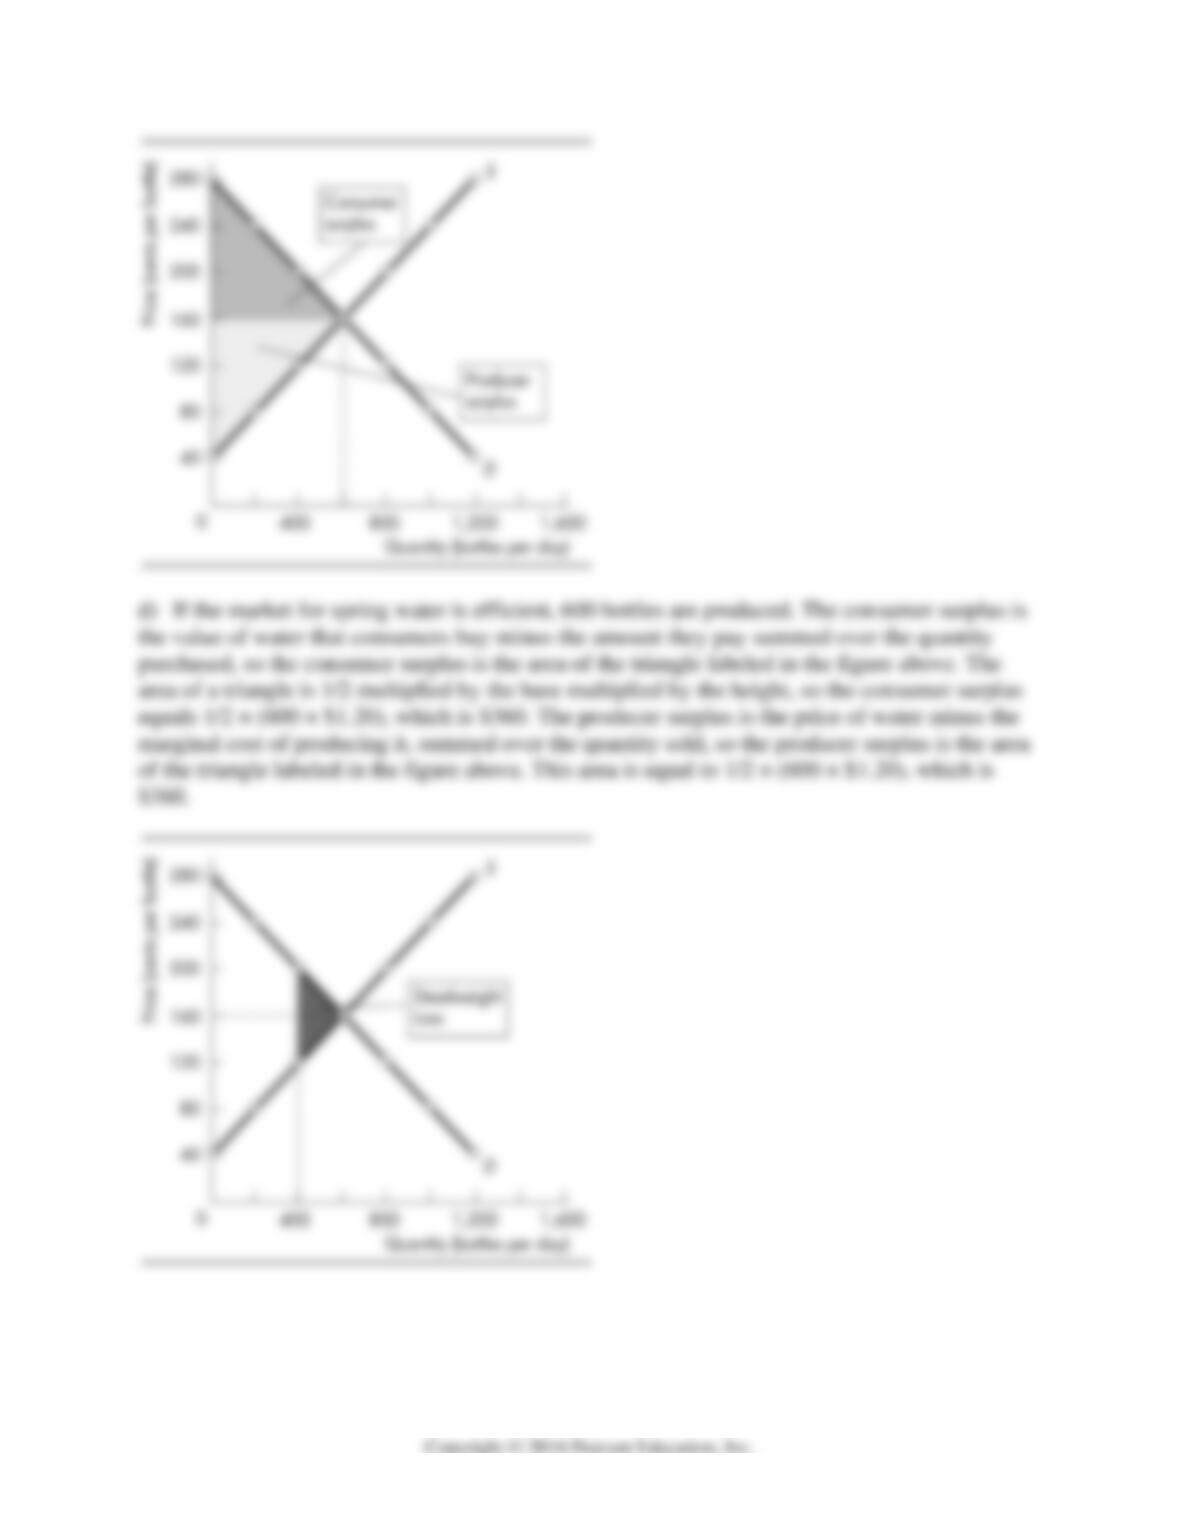
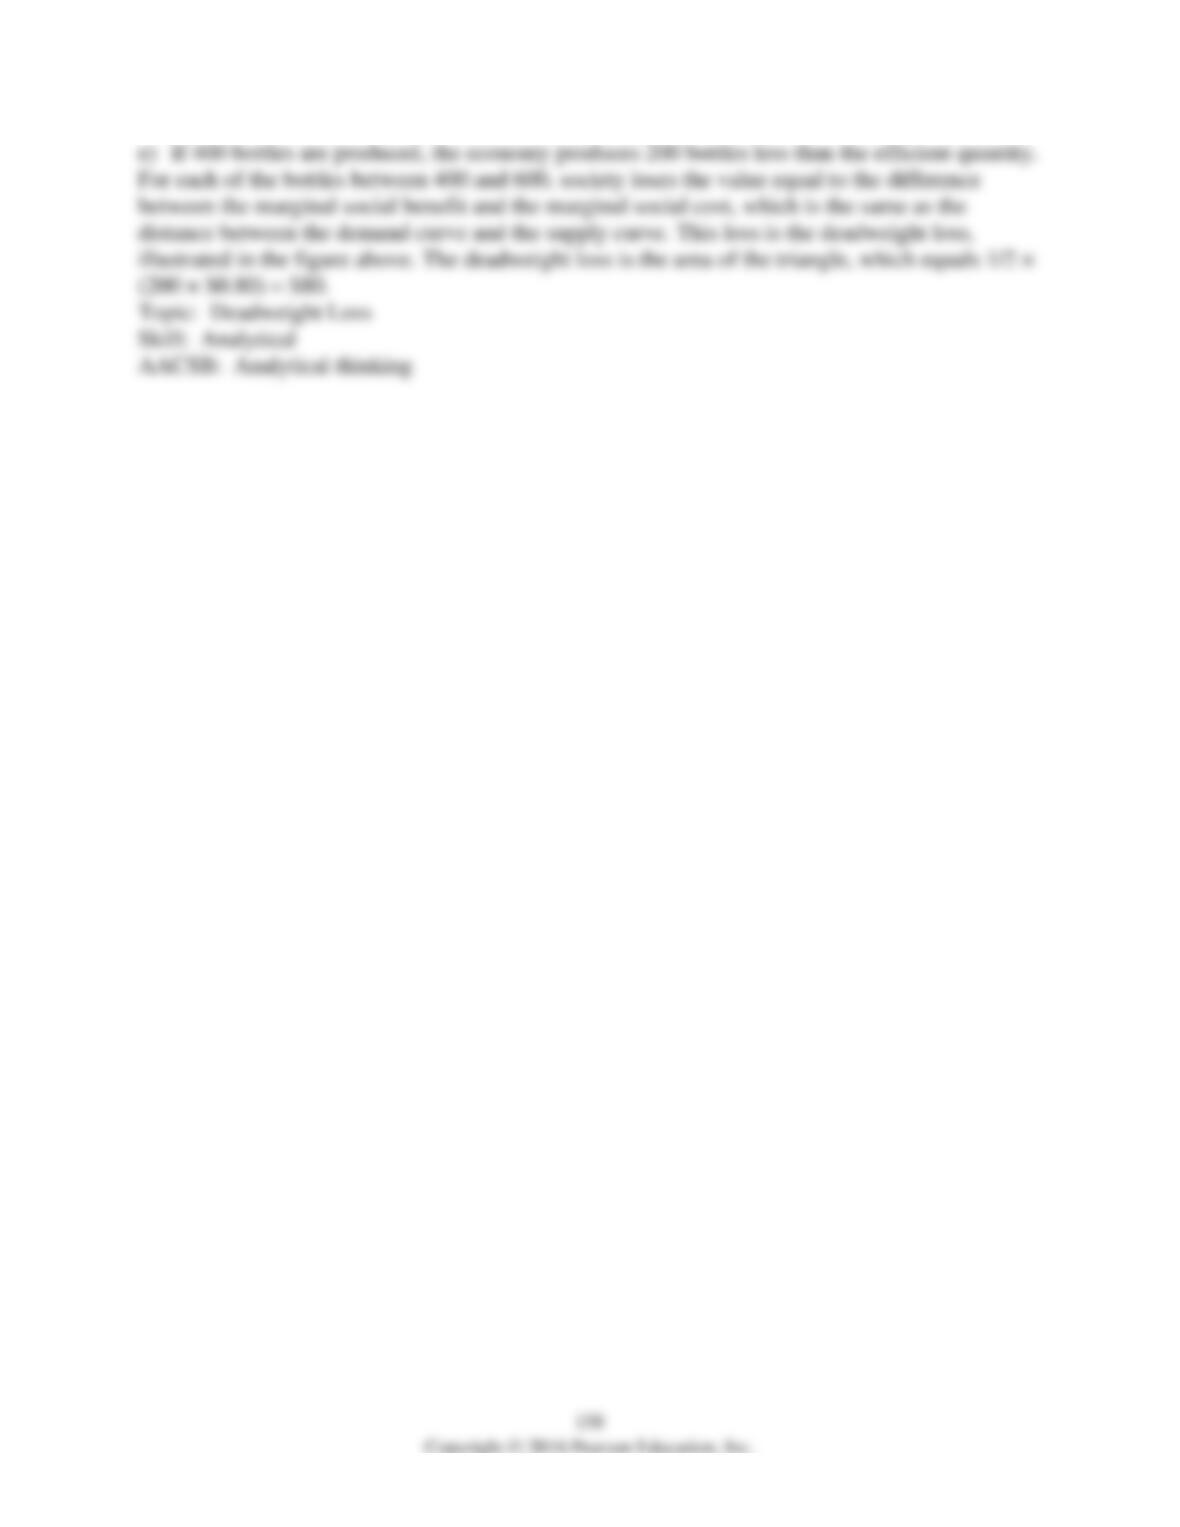
1) The figure above shows the market for ink-jet printers.
a) What are the equilibrium price and equilibrium quantity of printers? Is this equilibrium
efficient? Explain.
b) Calculate the total amount consumers paid for printers bought.
c) Calculate the consumer surplus.
d) Calculate the producer surplus.
155
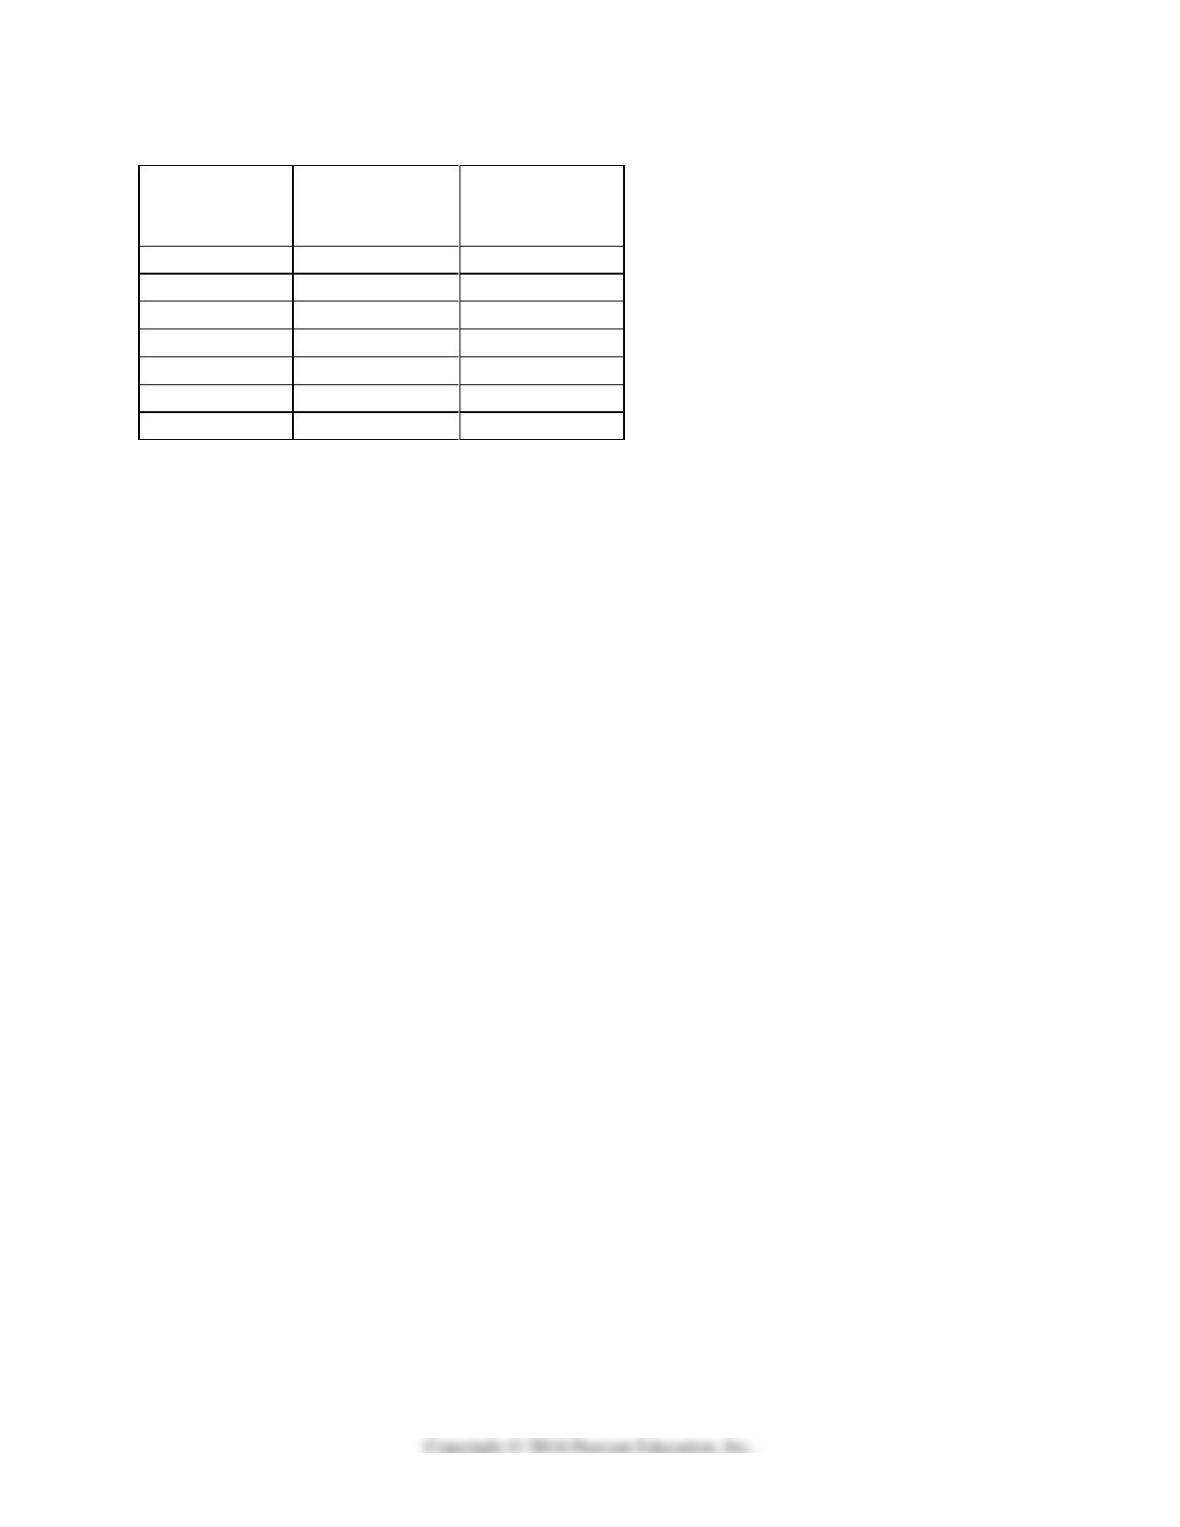
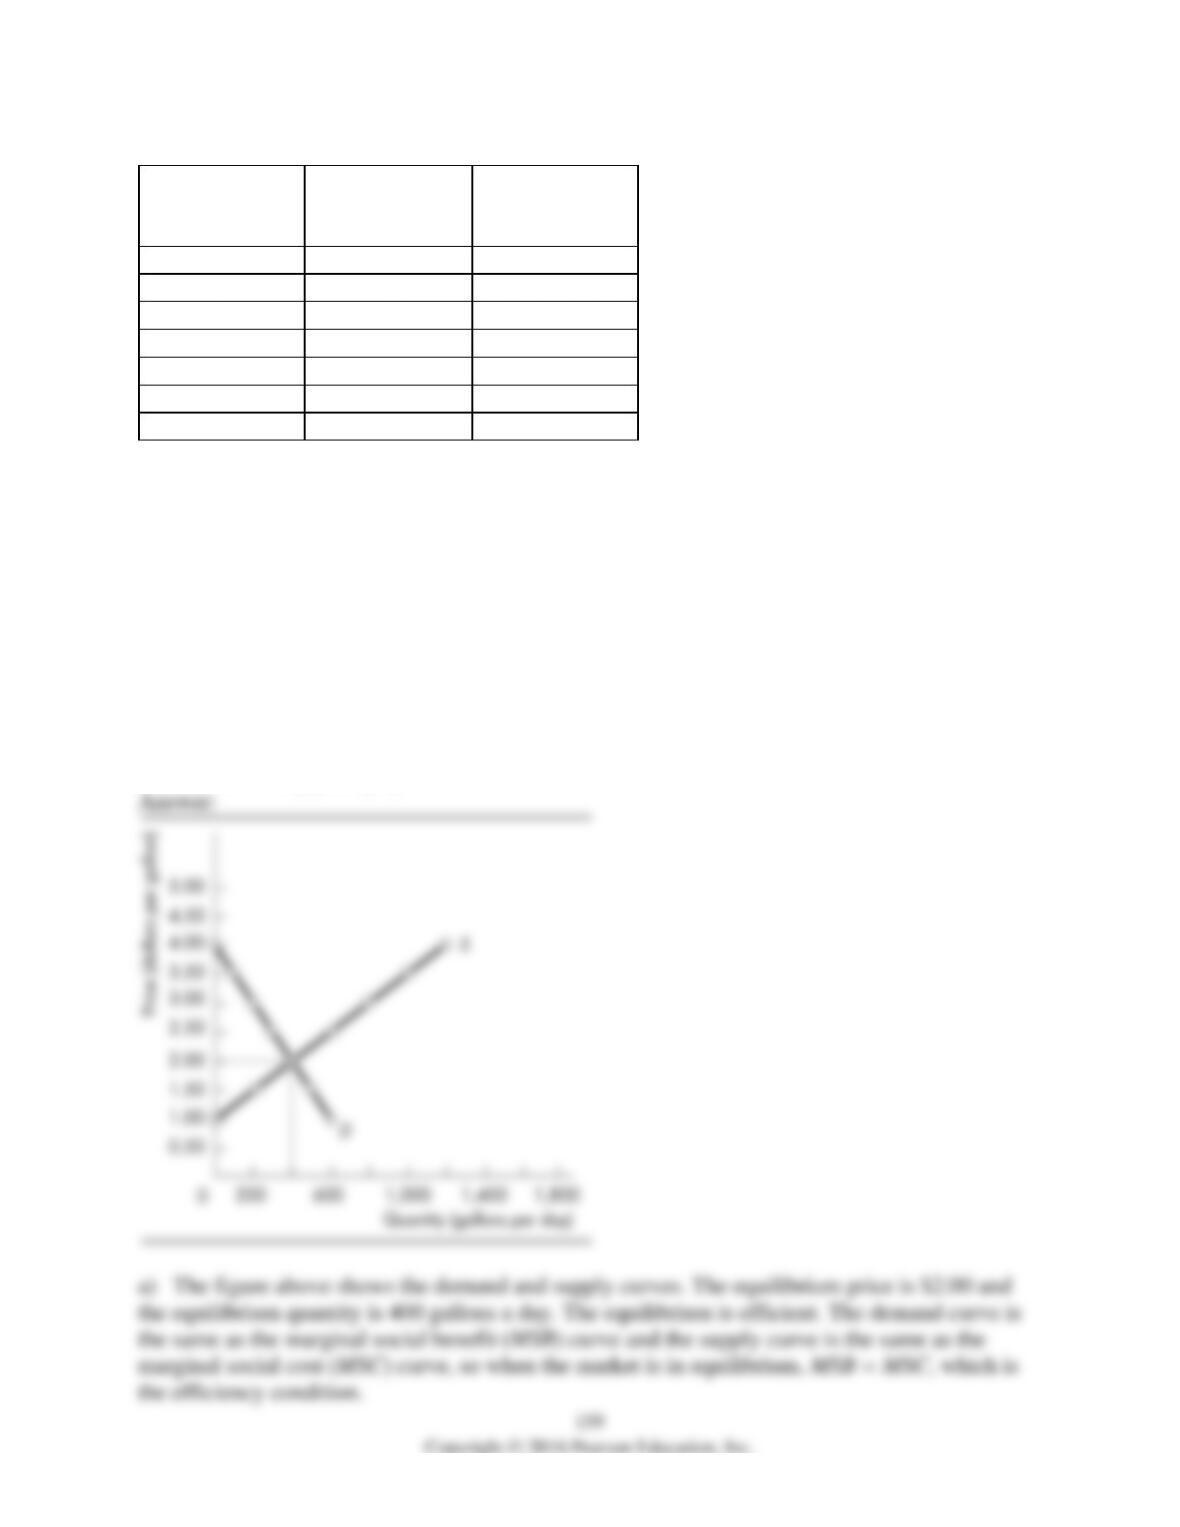
Price
(cents per
bottle)
Quantity
demanded
(bottles per day)
Quantity
supplied
(bottles per day)
40
1,200
0
80
1,000
200
120
800
400
160
600
600
200
400
800
240
200
1,000
280
0
1,200
2) The table above gives the demand and supply schedules for bottled spring water in
Springsboro. Assume that the only people who benefit from spring water are the people who
drink it and the only people who bear the cost of bottled spring water are the people who produce
it.
a) Draw the market demand and market supply curves. What are the equilibrium price and
equilibrium quantity of spring water? Is this equilibrium efficient? Explain.
b) What is the maximum price that consumers are willing to pay for the 400th bottle? What is
the minimum price that producers are willing to accept for the 400th bottle? Explain.
c) Are 400 bottles a day less than or greater than the efficient quantity? Explain your answer.
d) If the market for spring water is efficient, what is the consumer surplus? Show it on your
graph. What is the producer surplus? Show it on your graph.
e) If spring water bottlers produce 400 bottles a day, is there a deadweight loss? If yes, what is
it? Explain your answer using your graph.
157
Price
(dollars per
gallon)
Quantity
demanded
(gallons per day)
Quantity
supplied
(gallons per day)
1.00
600
0
1.50
500
200
2.00
400
400
2.50
300
600
3.00
200
800
3.50
100
1,000
4.00
0
1,200
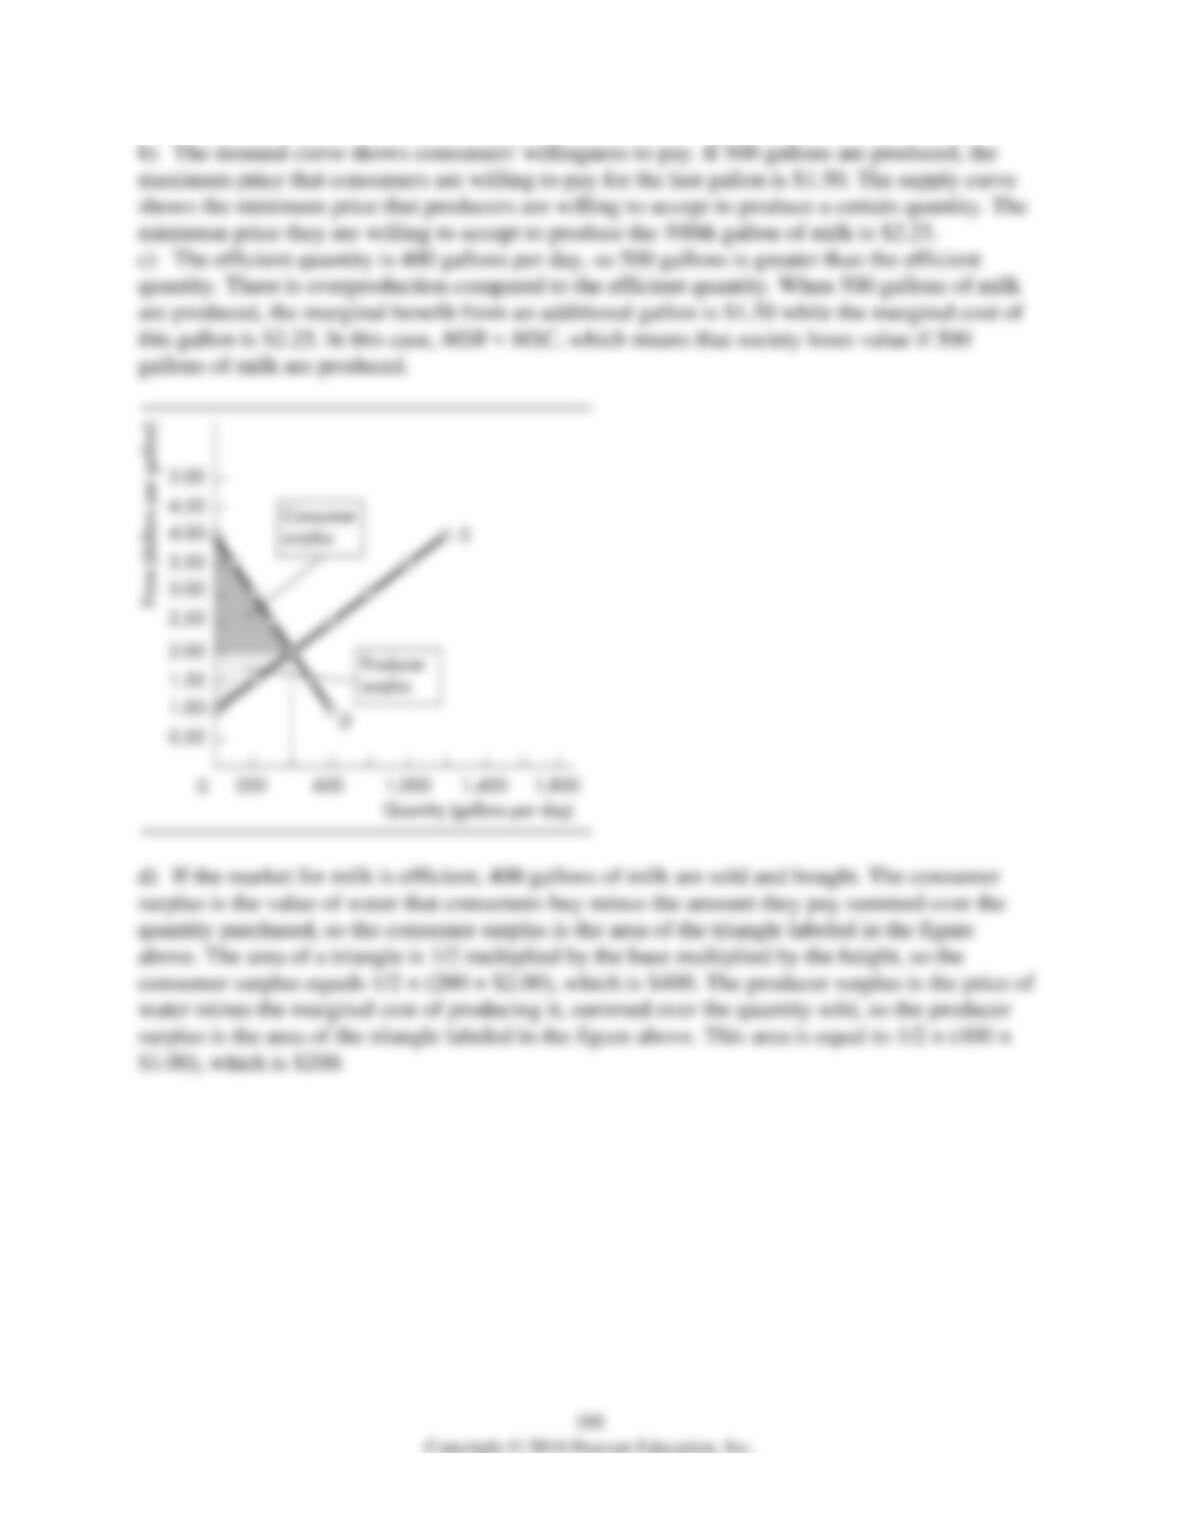
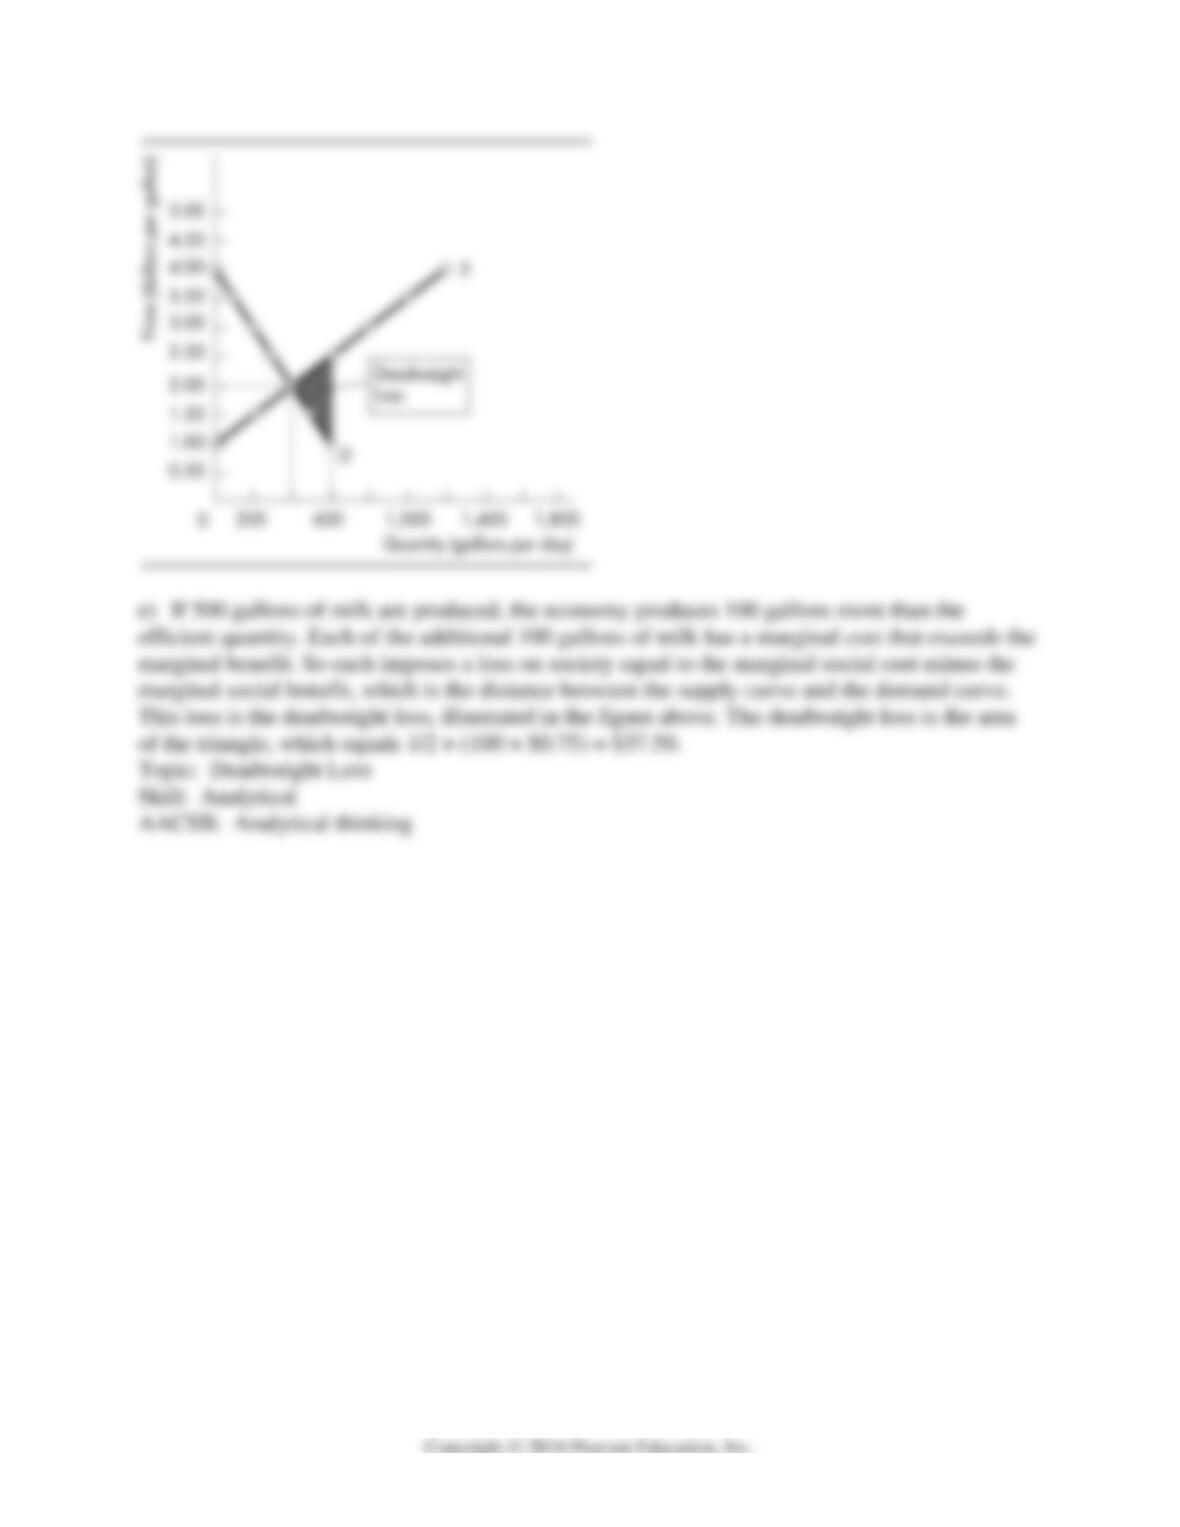
3) The table gives the demand and supply schedules for milk in Cowburg. Assume that the only
people who benefit from milk are the people who consume it and the only people who bear the
cost of milk are the people who produce it.
a) Draw the market demand and market supply curves. What are the equilibrium price and
equilibrium quantity of milk? Is this equilibrium efficient? Explain.
b) What is the maximum price that consumers are willing to pay for the 500th gallon? What is
the minimum price that producers are willing to accept for the 500th gallon? Explain.
c) Are 500 gallons a day less than or greater than the efficient quantity? Explain your answer.
d) If the market for milk is efficient, what is the consumer surplus? Show it on your graph.
What is the producer surplus? Show it on your graph.
e) If farmers produce 500 gallons a day, is there a deadweight loss? If yes, what is it? Explain
your answer using your graph.
161
162
Price
(dollars per
gallon)
Quantity
demanded in July
(gallons per day)
Quantity
demanded in
November
(gallons per day)
Quantity
supplied
(gallons per day)
2.00
300
150
0
2.50
250
100
100
3.00
200
50
200
3.50
150
0
300
4.00
100
0
400
4.50
50
0
500
5.00
0
0
600
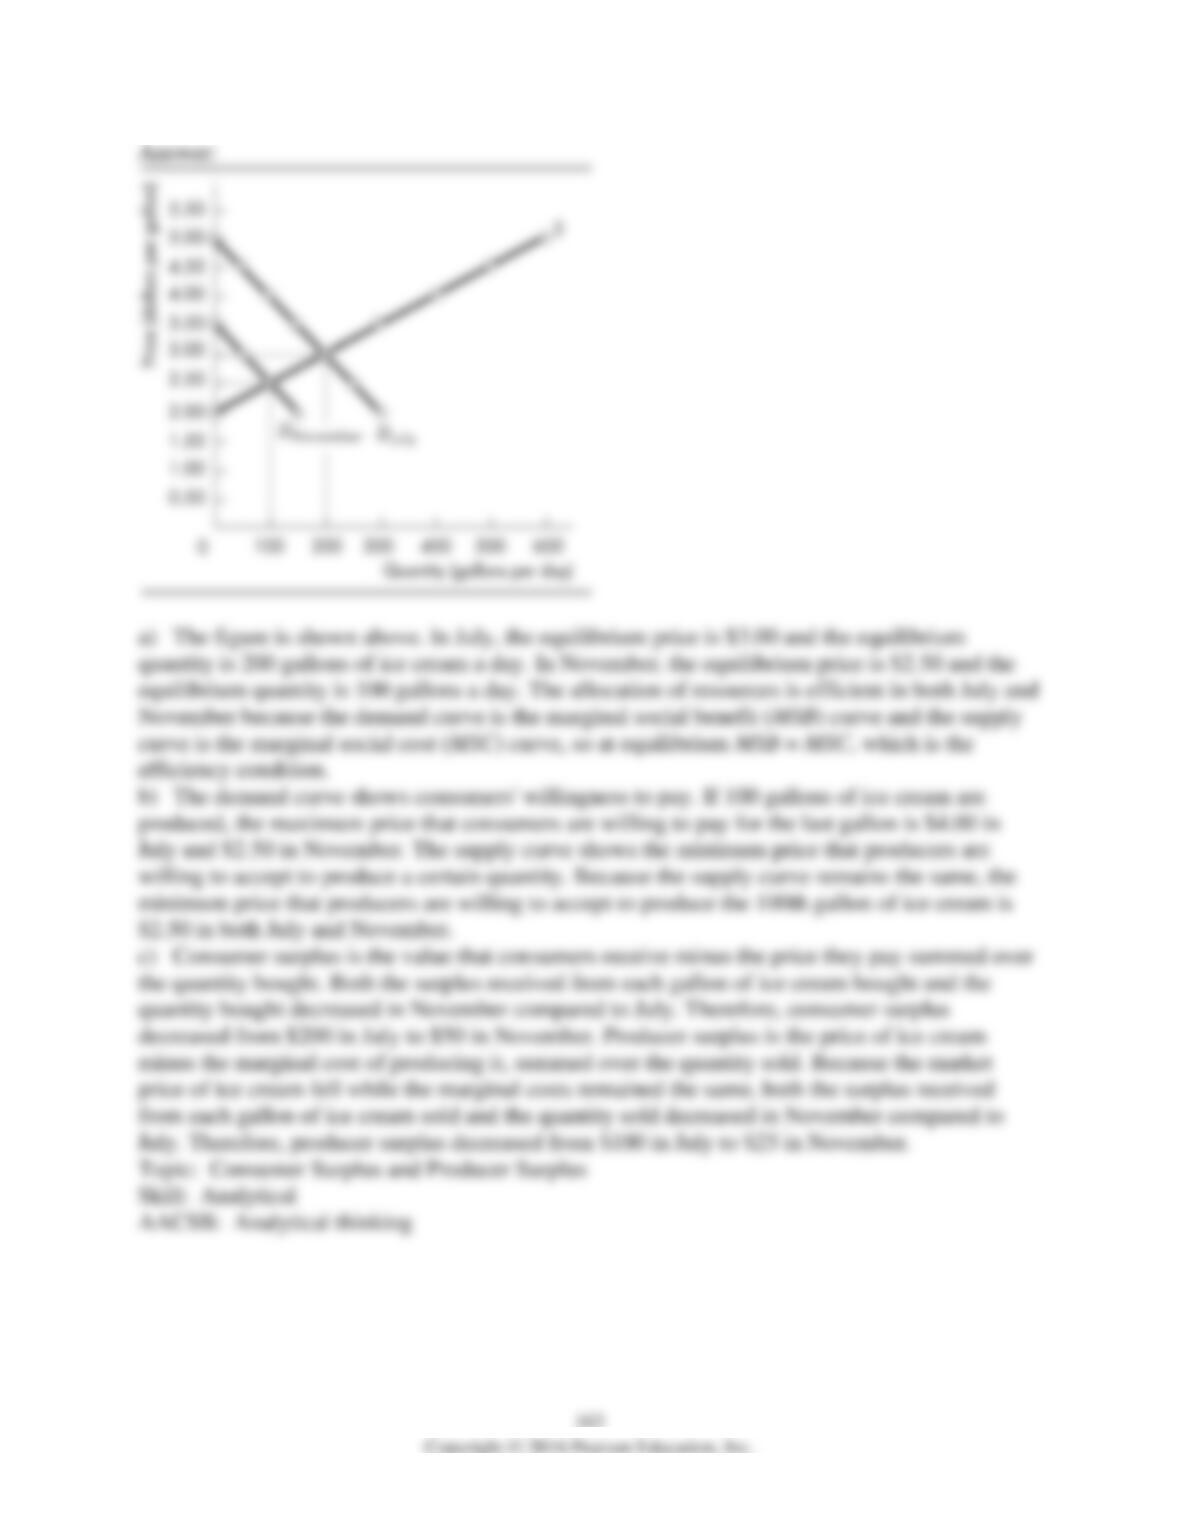
4) The table gives the demand and supply schedules for ice cream in Sweetsville in July and
November. Assume that the only people who benefit from ice cream are the people who
consume it and the only people who bear the cost of ice cream are the people who produce it.
a) Draw the market demand and market supply curves. What are the equilibrium price and
equilibrium quantity of ice cream in July and November? Is the allocation of resources efficient
in July? Is it efficient in November? Explain.
b) What is the maximum price that consumers are willing to pay for the 100th gallon of ice
cream in July? In November? What is the minimum price that producers are willing to accept for
the 100th gallon in July and November? Explain.
c) What happens to consumer surplus and producer surplus in November compared to July?
Why?