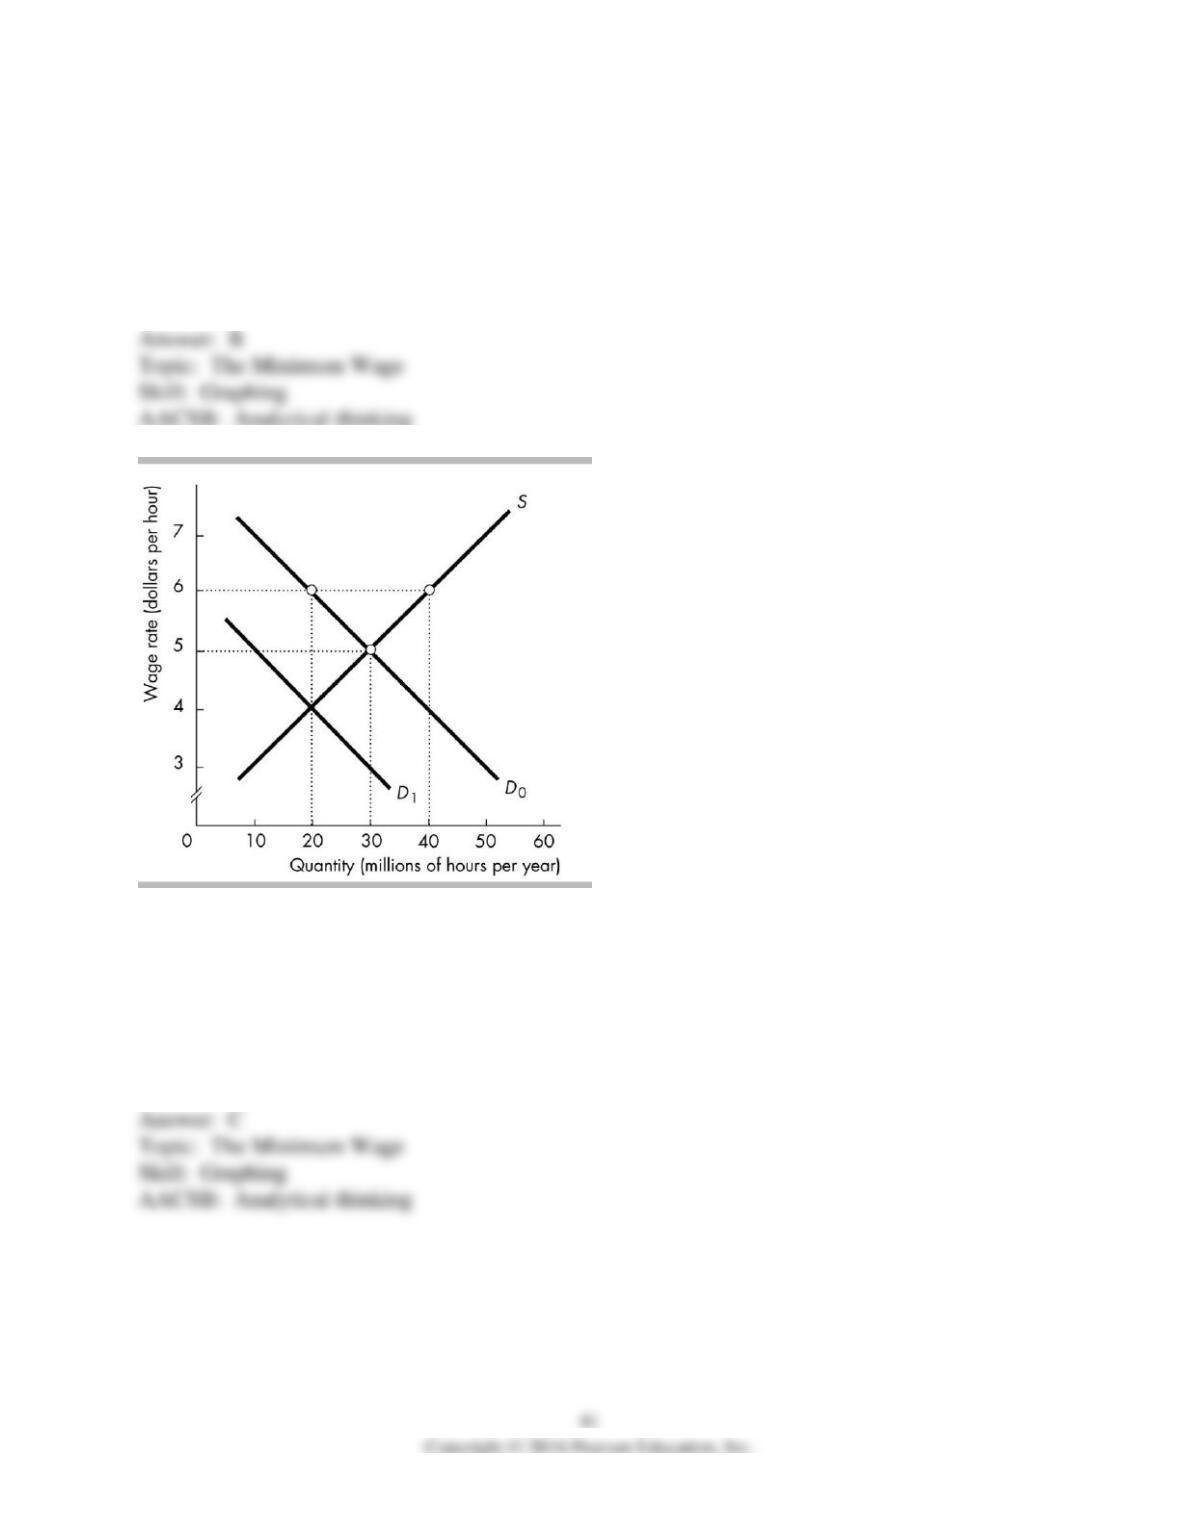
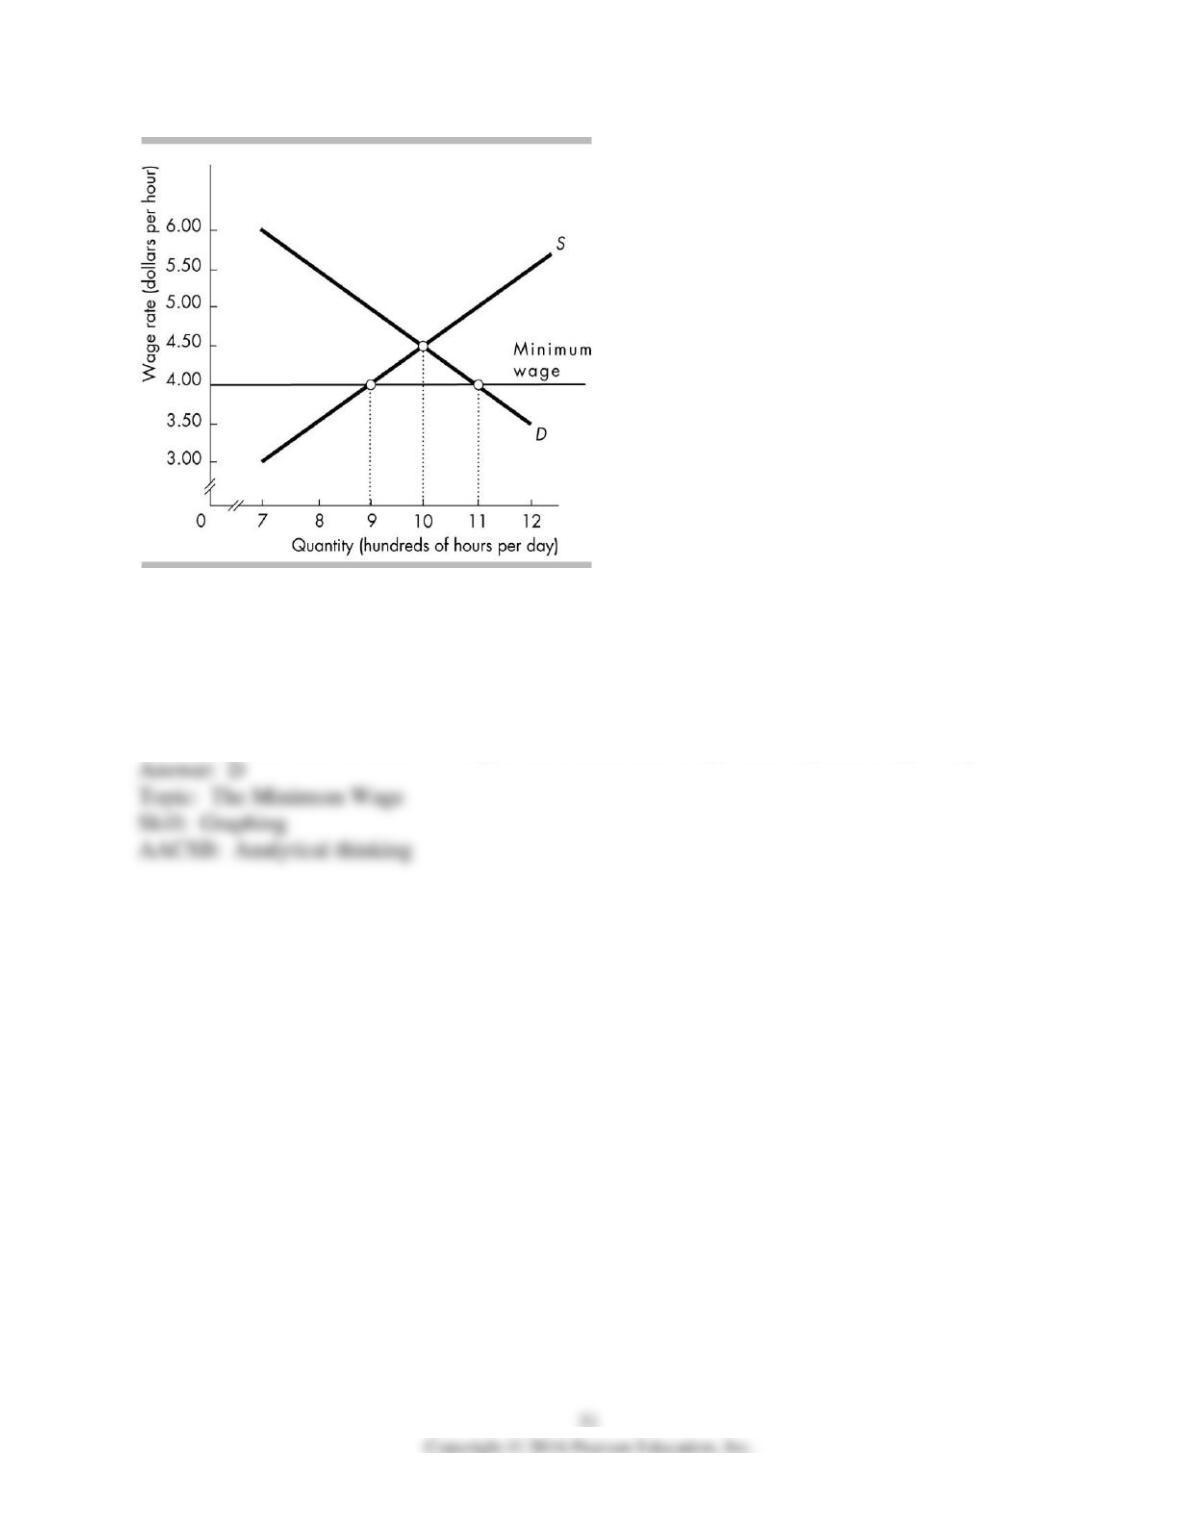
37) The figure above shows the market for low-skilled labor in Midland city. The government
sets a minimum wage at $6 per hour. With the minimum wage law enacted, the potential loss
from job search in Midland city is
A) $60 million.
B) $120 million.
C) $40 million.
D) zero.
38) In the figure above, if a minimum wage of $6 per hour has been imposed and the labor
demand curve then shifts from D0 to D1 the wage rate ________ and the amount of employment
________.
A) falls; decreases
B) does not change; increases
C) does not change; decreases
D) falls; increases
39) In the figure above, D0 is the demand for labor curve. Imposing a minimum wage of $6 per
hour will initially
A) increase employment from 20 to 40 million hours per year.
B) increase employment from 30 to 40 million hours per year.
C) decrease employment from 40 to 20 million hours per year.
D) decrease employment from 30 to 20 million hours per year.
40) In the figure above, D0 is the demand for labor curve. Imposing a minimum wage of $3 per
hour will
A) have no effect on the market.
B) result in unemployment.
C) result in a labor shortage.
D) immediately shift the demand curve to D1.

41) The market for unskilled labor is illustrated in the figure above. The market is in equilibrium
and then a minimum wage of $5 per hour is imposed. Employment will fall by
A) 0 hours.
B) 10 million hours per year.
C) 20 million hours per year.
D) 30 million hours per year.
42) The market for unskilled labor is illustrated in the figure above. The market is in equilibrium
and then a minimum wage of $3 per hour is imposed. Employment will decrease by
A) 0 hours.
B) 10 million hours per year.
C) 20 million hours per year.
D) 30 million hours per year.

43) The market for unskilled labor is illustrated in the figure above. The market is in equilibrium
and then a minimum wage of $5 per hour is imposed. Unemployment will equal
A) 0 hours.
B) 10 million hours per year.
C) 20 million hours per year.
D) 30 million hours per year.
44) The market for unskilled labor is illustrated in the figure above. The market is in equilibrium
and then a minimum wage of $3 per hour is imposed. Unemployment will equal
A) 0 hours.
B) 10 million hours per year.
C) 20 million hours per year.
D) 30 million hours per year.
45) The market for unskilled labor is illustrated in the figure above. If a minimum wage of $5 per
hour is imposed, an employer who breaks the law will be able to find a worker who is willing to
work for
A) less than or equal to $4 per hour.
B) between $4 and $5 per hour.
C) more than or equal to $5 per hour.
D) None of the above because workers are not willing to supply labor for wage rates less than $5
per hour.
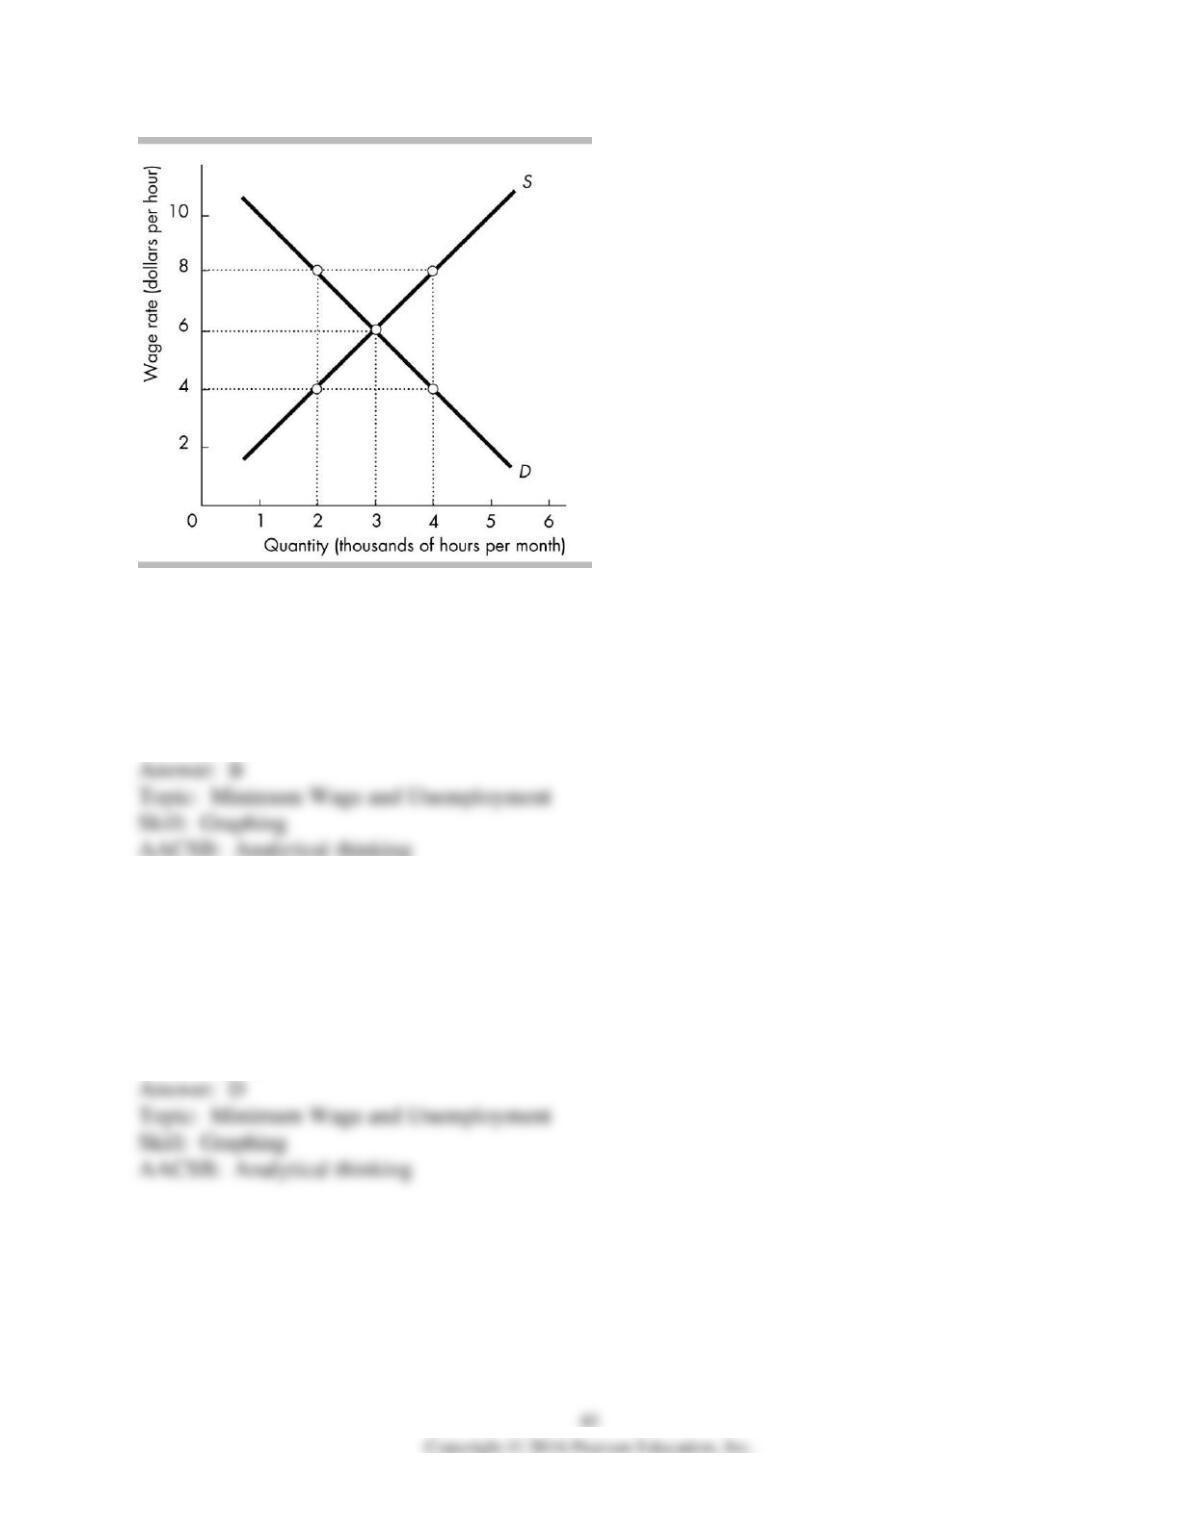
46) In the above figure, if the minimum wage is equal to ________, there would be ________
hours of labor employed.
A) $8 per hour; 4,000
B) $8 per hour; 2,000
C) $6 per hour; 3,000
D) $4 per hour; 2,000
47) In the above figure suppose a minimum wage of $8 per hour is imposed. As a result, the
quantity of labor supplied is ________ hours and the quantity of labor demanded is ________
hours.
A) 3,000; 4,000
B) 4,000; 4,000
C) 2,000; 4,000
D) 4,000; 2,000
48) In the above figure, if there is no minimum wage, the equilibrium employment is ________;
if the government imposed a minimum wage of $8 per hour, employment is ________.
A) 4,000 hours; 2,000 hours
B) 3,000 hours; 4,000 hours
C) 3,000 hours; 2,000 hours
D) 4,000 hours; 3,000 hours
49) In the above figure, if the government imposed a minimum wage of $8 per hour in this labor
market, the increase in the hourly wage for those who are able to keep their jobs is
A) $2 per hour.
B) $4 per hour.
C) $6 per hour.
D) $8 per hour.
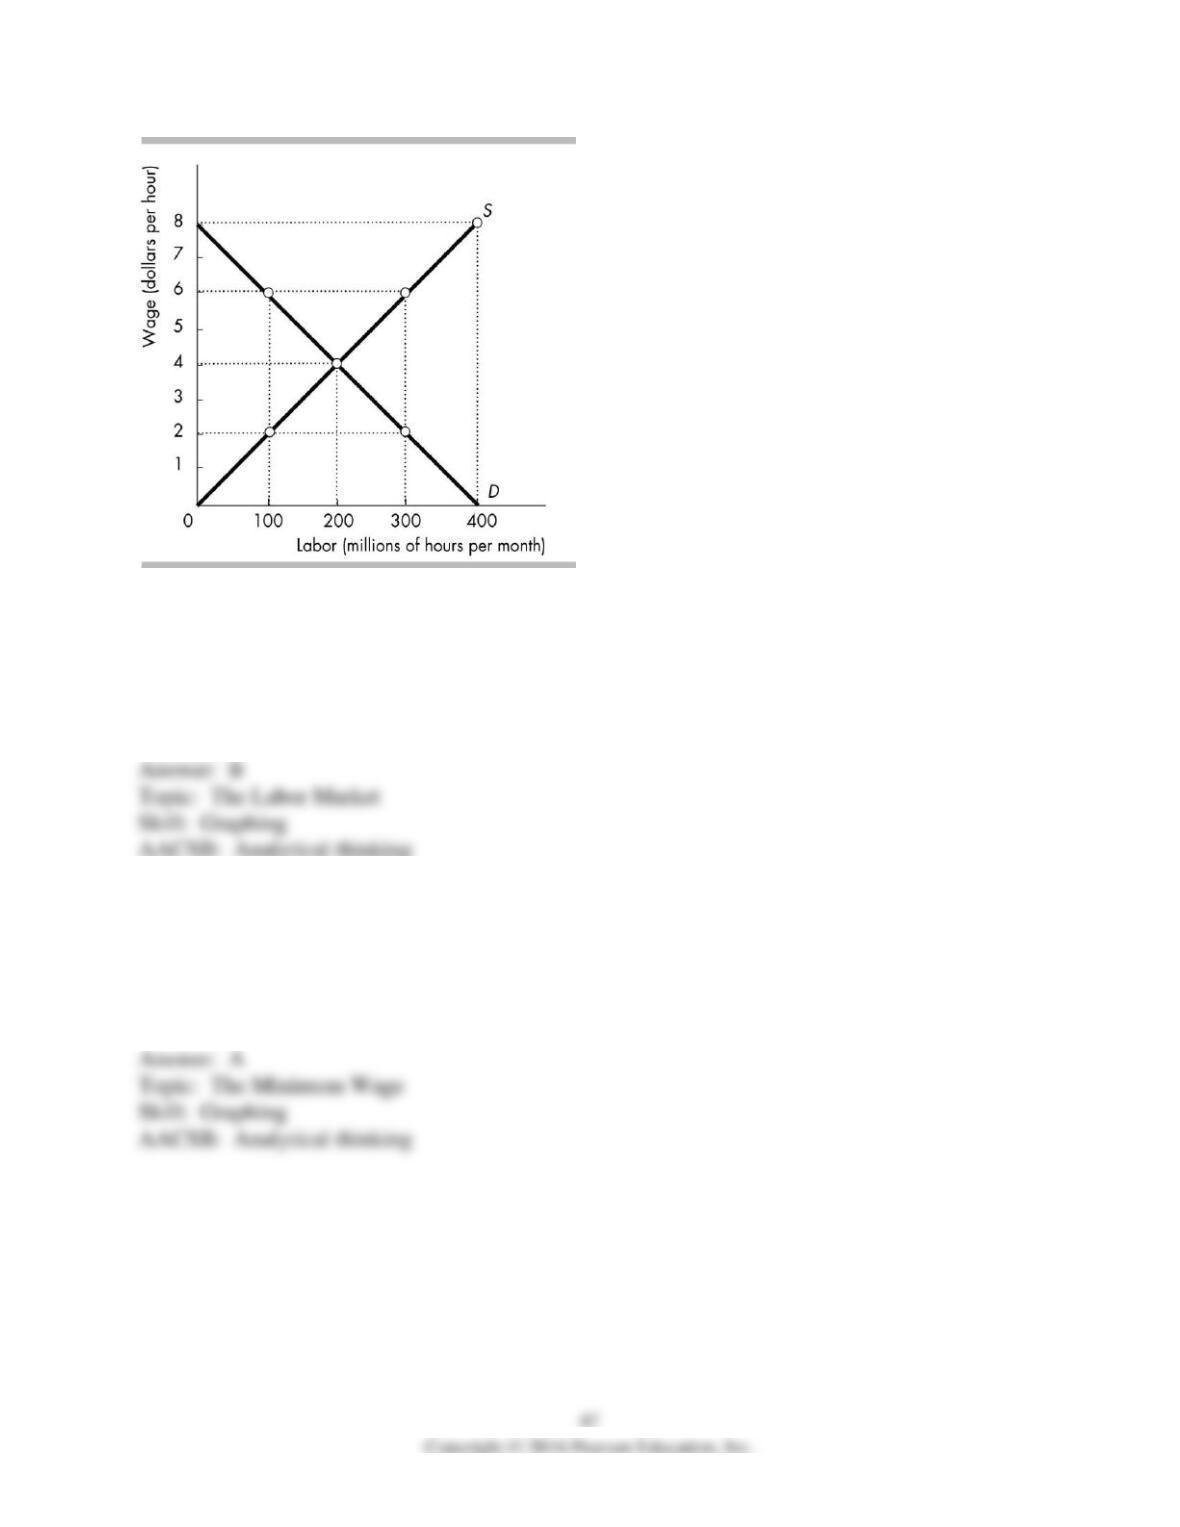
50) In the above figure, without a minimum wage, the equilibrium quantity of labor employed
________ million hours, and the equilibrium wage rate is ________ per hour.
A) 100; $2
B) 200; $4
C) 300; $6
D) 400; $8
51) In the above figure, if the minimum wage is set at $6 per hour, what quantity of labor is
employed?
A) 100 million hours
B) 200 million hours
C) 300 million hours
D) 400 million hours
52) In the above figure, if the minimum wage is set at $2 per hour, what quantity of labor is
employed?
A) 100 million hours
B) 200 million hours
C) 300 million hours
D) 400 million hours
53) In the above figure, at what minimum wage is the unemployment level equal to 200 million
hours?
A) $2 per hour
B) $4 per hour
C) $6 per hour
D) $8 per hour
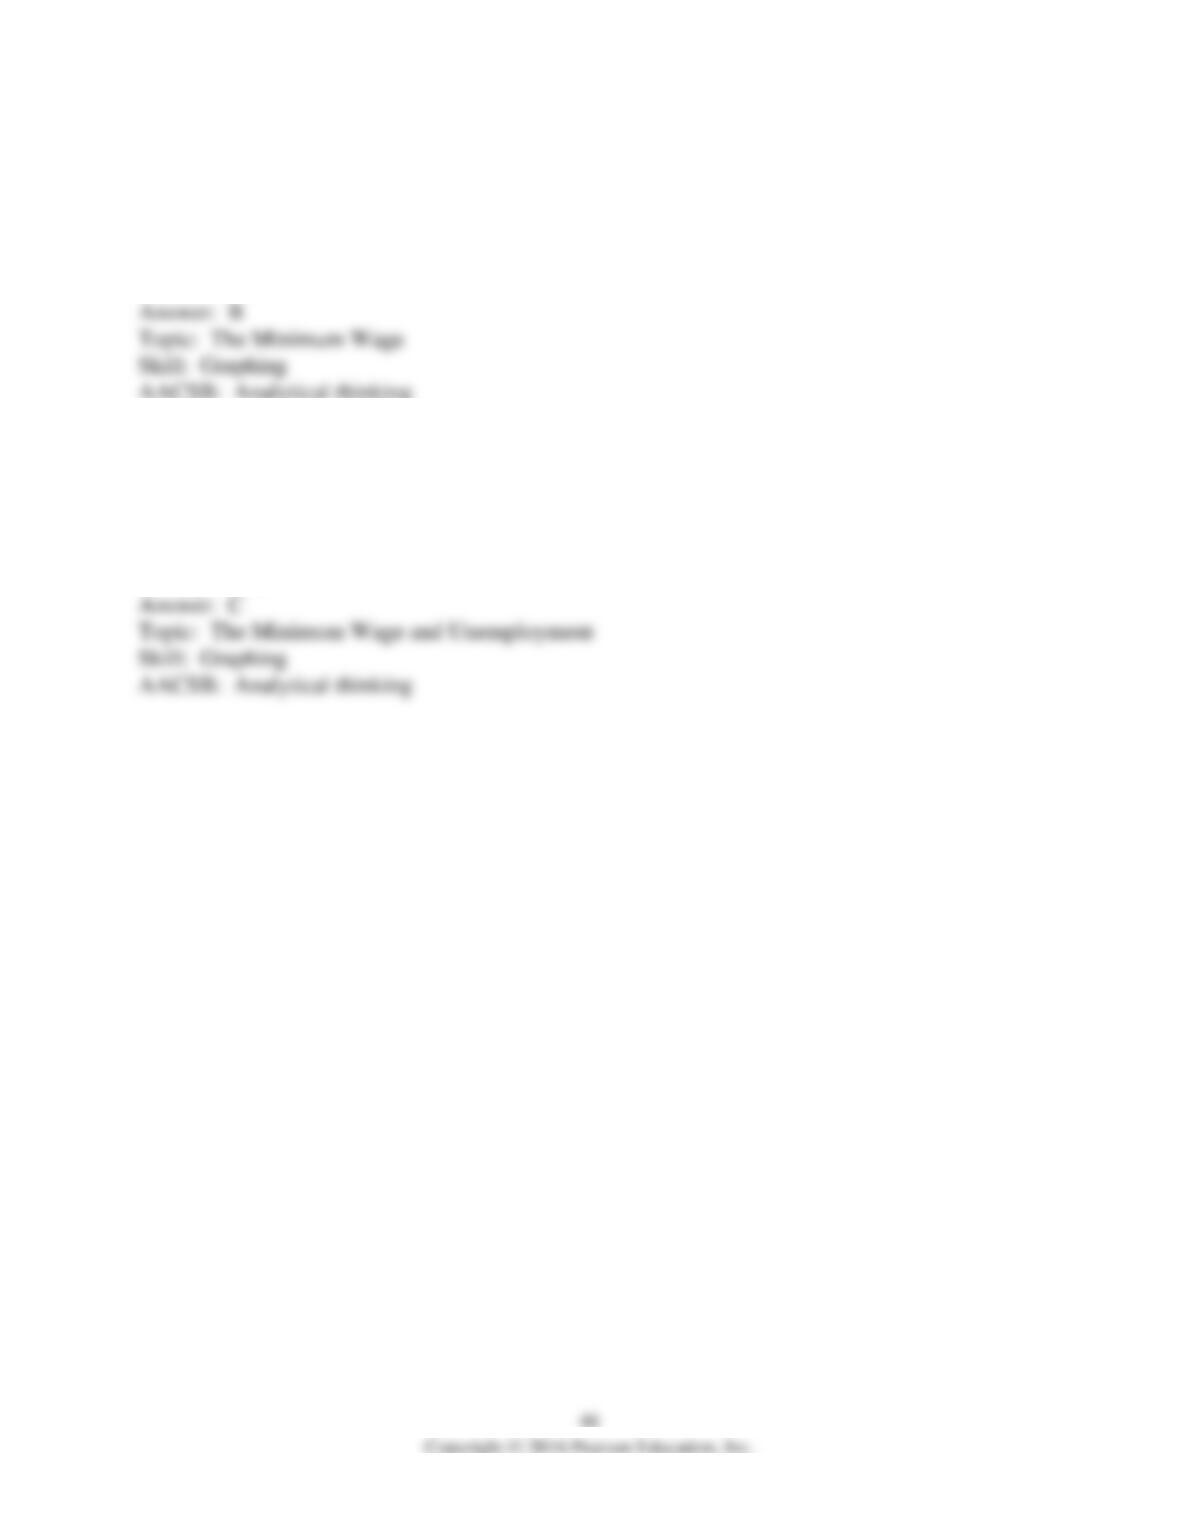
54) In the figure above, if the minimum wage is $4 per hour, then
A) the quantity of labor supplied is less than the quantity of labor demanded.
B) the quantity of labor supplied is 4 million hours and the quantity of labor demanded is 2
million hours.
C) unemployment is 1 million hours.
D) the quantity of labor supplied is 3 million hours and the quantity of labor demanded is 3
million hours.
55) In the figure above, if the minimum wage is $2 per hour, then
A) the quantity of labor supplied is 4 million hours and the quantity of labor demanded is 2
million hours.
B) the quantity of labor demanded is 4 million hours and the quantity of labor supplied is 2
million hours.
C) unemployment is 1 million hours.
D) the quantity of labor supplied is 3 million hours and the quantity of labor demanded is 3
million hours.
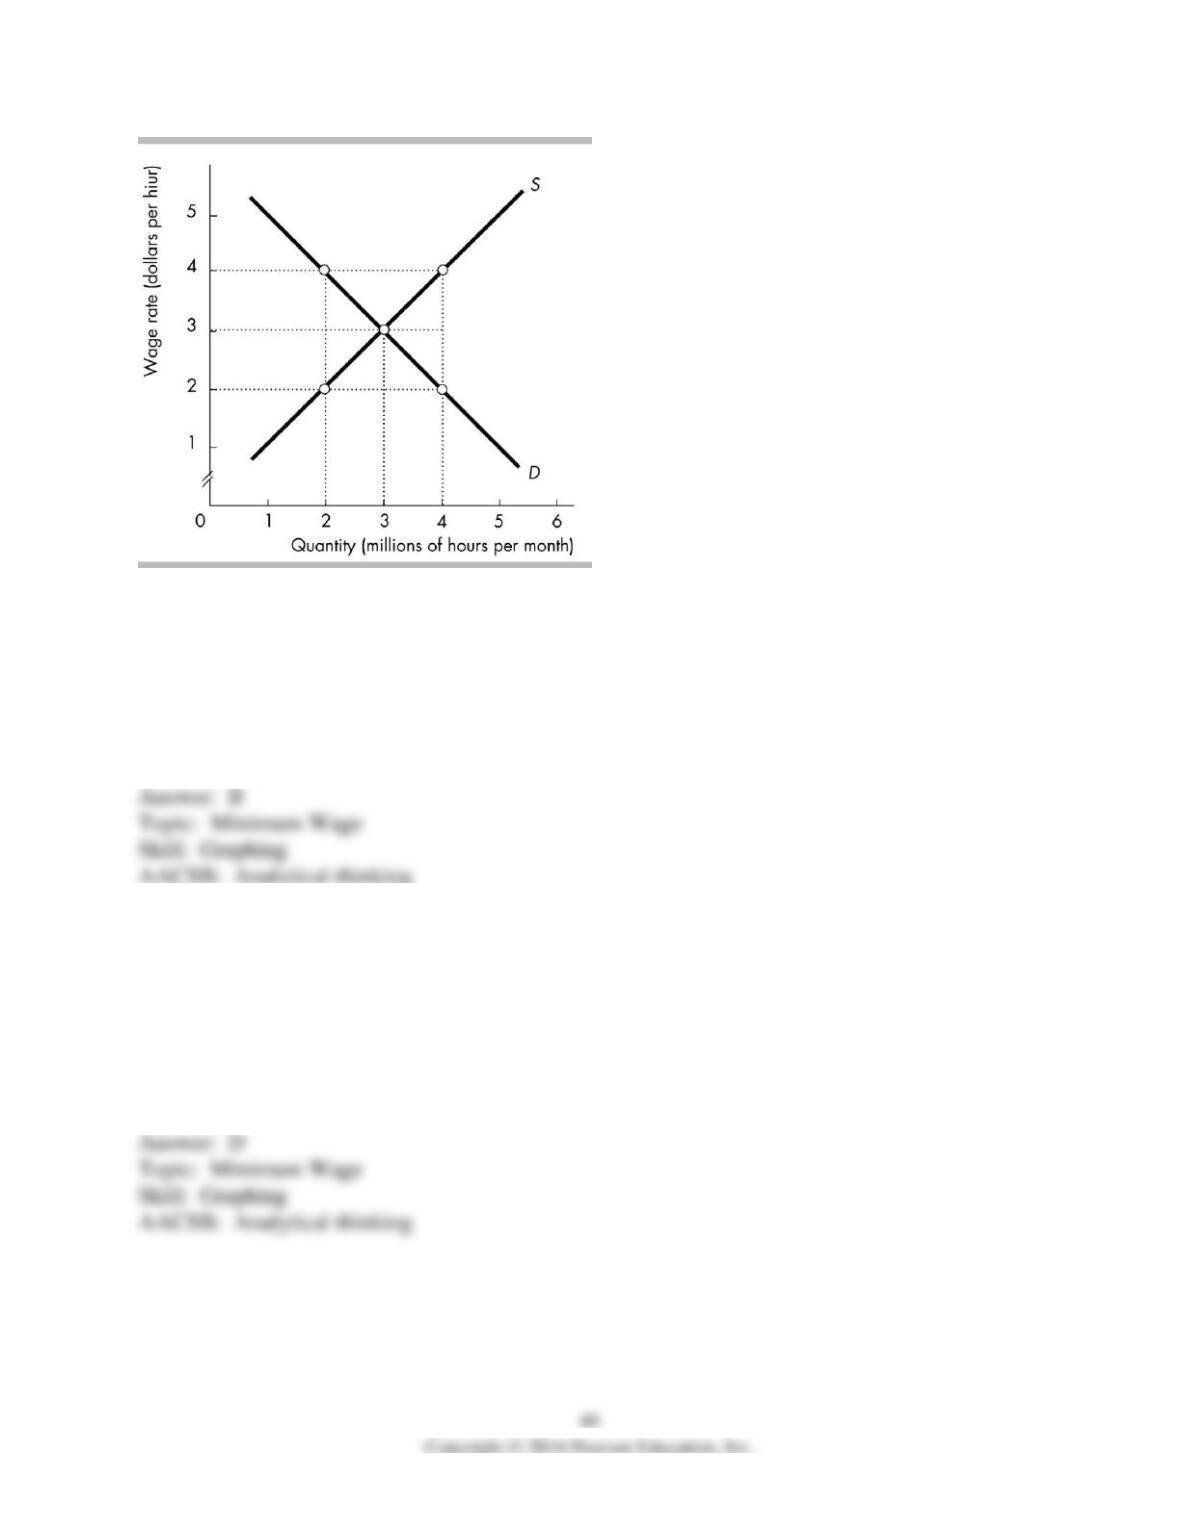
56) The above figure illustrates the labor market for fast food restaurants in a small city in Peru.
What would be the effects of a minimum wage imposed at $5.50 per hour?
A) unemployment equal to 400 hours
B) unemployment equal to 200 hours
C) a shortage of 400 hours
D) nothing because the minimum wage has no effect on the equilibrium price and quantity
57) The above figure illustrates the labor market for fast food restaurants in a small city in Peru.
What would be the effects of a minimum wage imposed at $4 per hour?
A) a shortage of 200 hours
B) a shortage of 100 hours
C) a surplus of 200 hours
D) nothing because the minimum wage has no effect on the equilibrium price and quantity
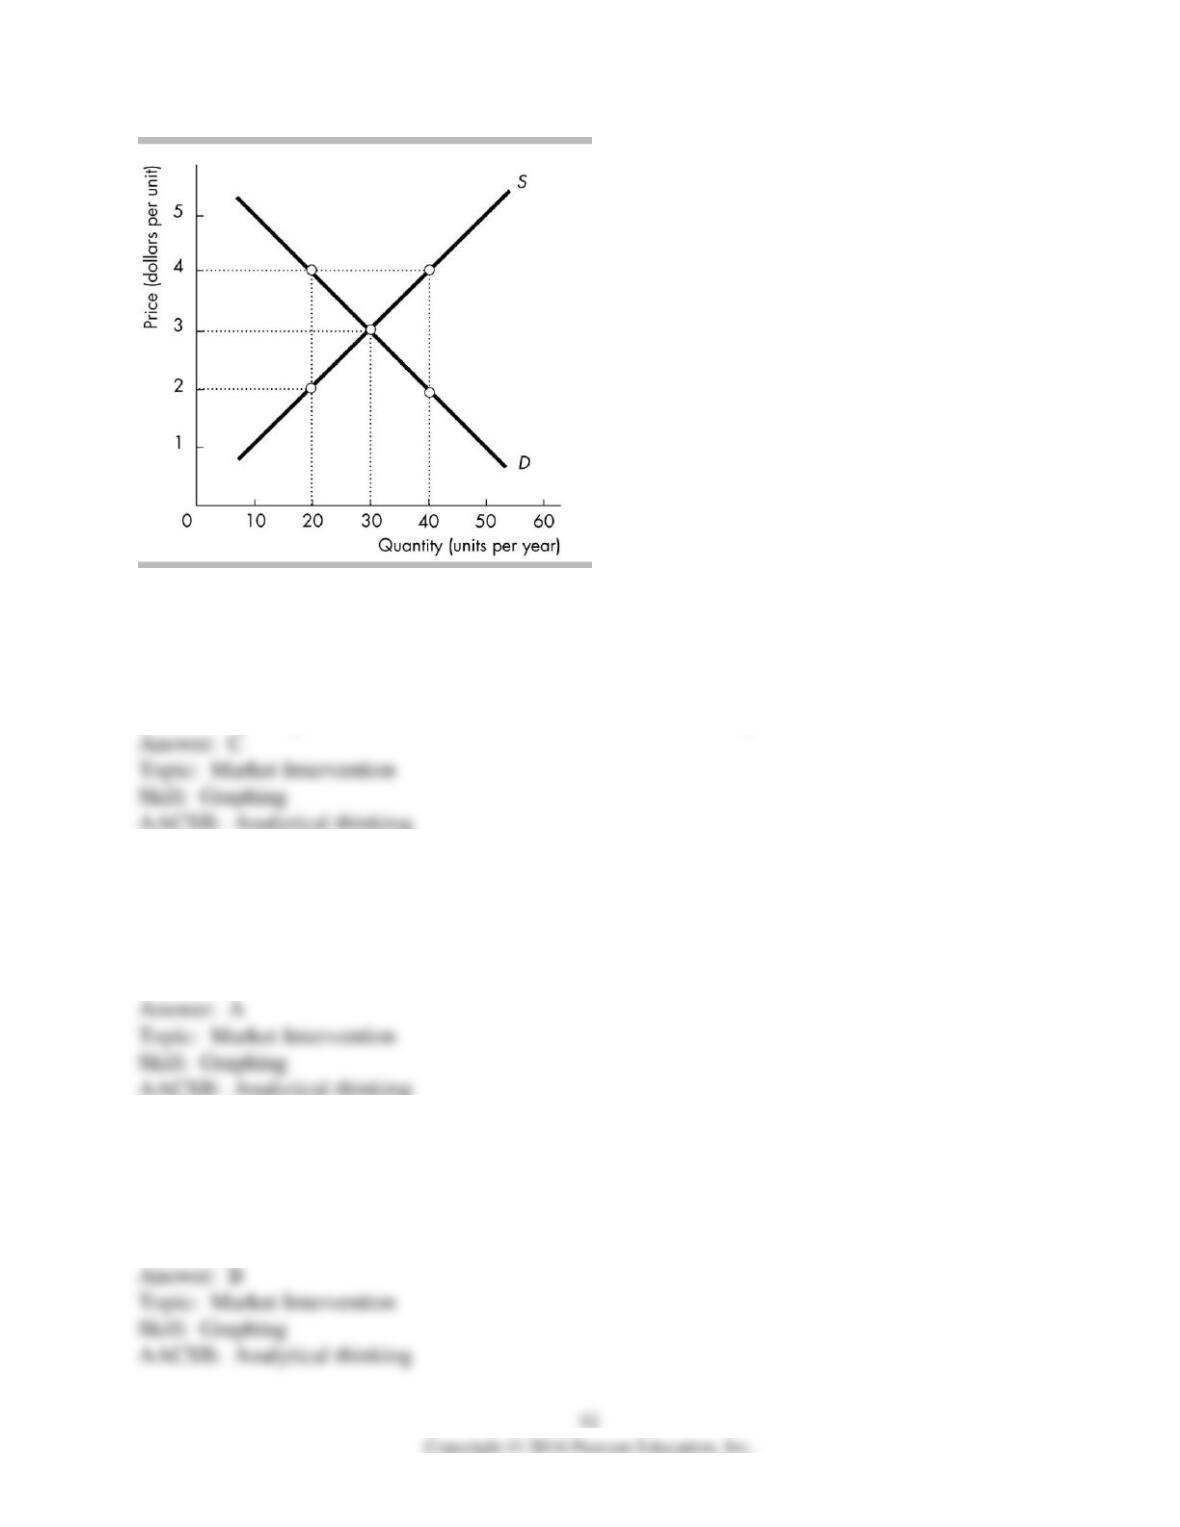
58) In the above figure, a price ceiling of $4 would
A) result in a shortage in the long run.
B) result in a surplus in the long run.
C) have no effect.
D) result in a surplus in the short run but have no effect in the long run.
59) In the above figure, a price ceiling of $2 would
A) create a shortage.
B) create a surplus.
C) have no effect.
D) cause the demand curve to shift leftward.
60) In the above figure, a price floor of $4
A) leads to a shortage.
B) leads to a surplus.
C) has no effect.
D) shifts the demand curve leftward.
61) In the above figure, a black market emerges with a
A) price ceiling of $4.
B) price floor of $2.
C) price floor of $4.
D) a rationed quantity 30.
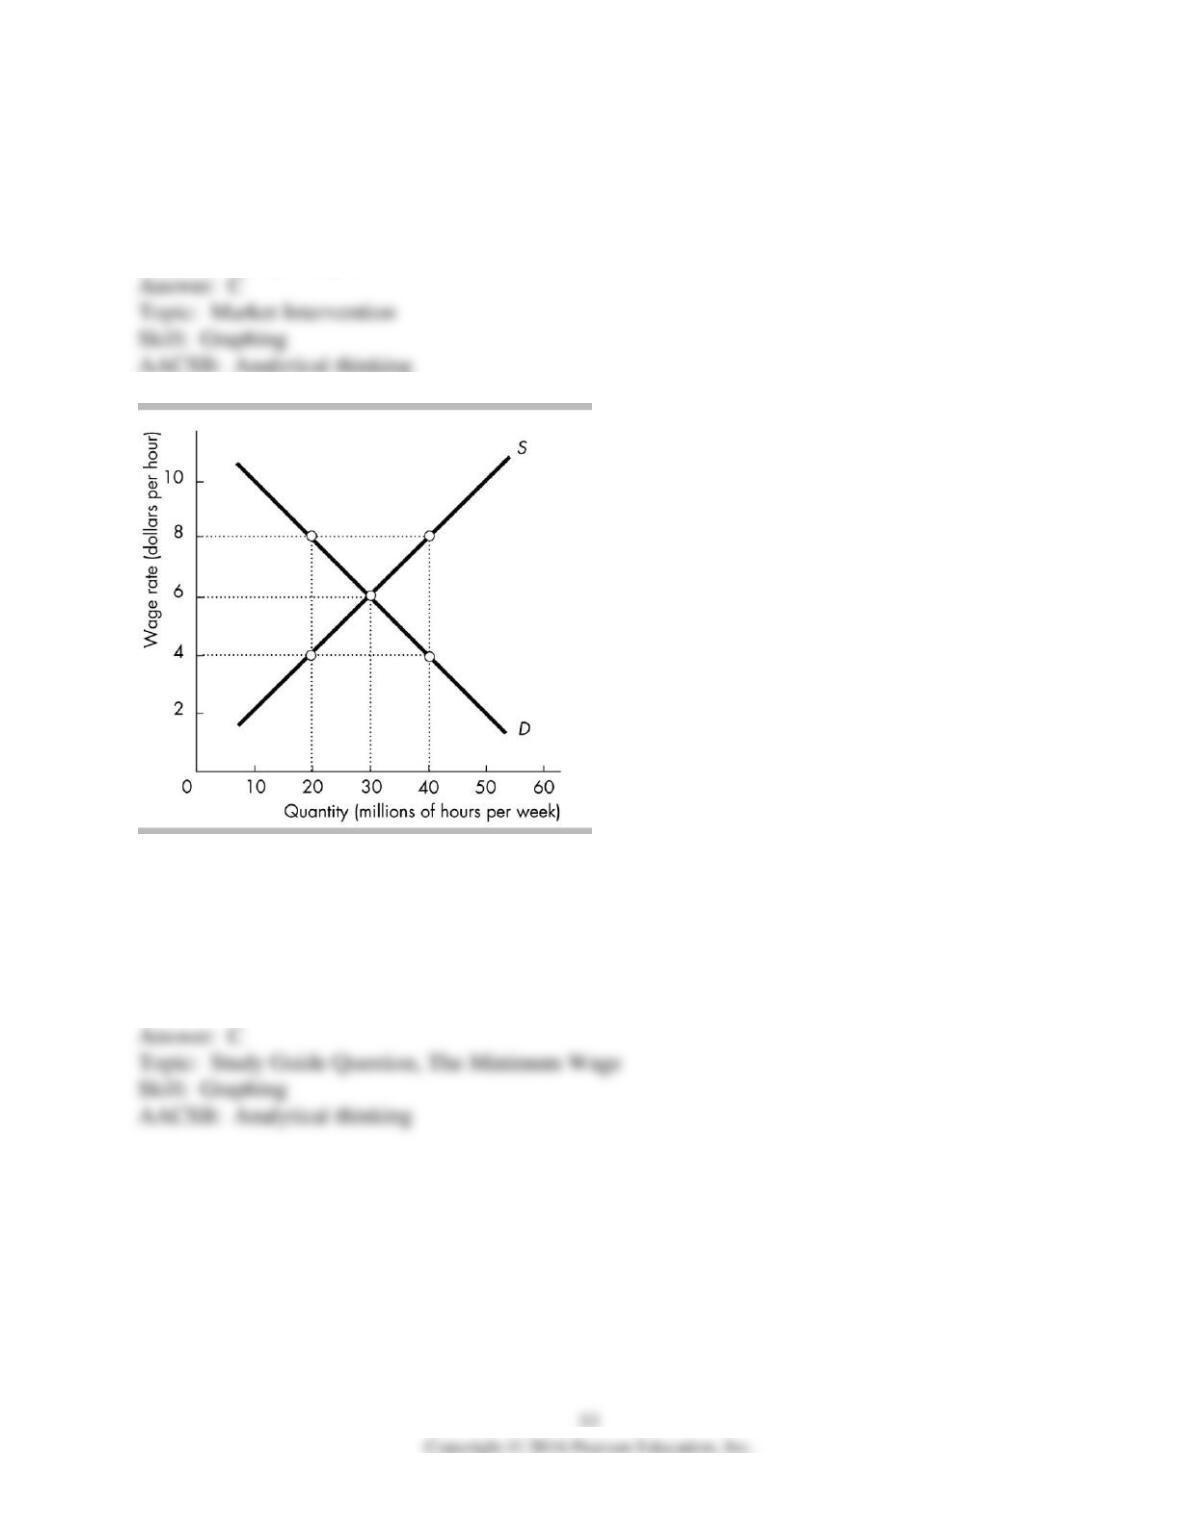
62) In the above figure, if the minimum wage is set at $8 per hour, the level of unemployment is
________ hours per week is
A) 40 million
B) 30 million
C) 20 million
D) 0
63) In the above figure, if the minimum wage is set at $6 per hour, the level of unemployment is
________ hours per week is
A) 40 million
B) 30 million
C) 20 million
D) 0
3 Taxes
1) A sales tax is imposed on the sellers of gasoline. This tax shifts
A) the supply of gasoline curve leftward.
B) the supply of gasoline curve rightward.
C) the demand for gasoline curve leftward.
D) both the supply curve of gasoline and demand curve for gasoline leftward.
2) A sales tax imposed on sellers shifts the supply curve leftward for the taxed good because the
A) tax is paid by the seller to the government and is, therefore, like a cost of production.
B) tax is actually shifted entirely onto the buyer who can afford only a smaller supply.
C) higher price causes entry into the market.
D) tax shifts the demand curve leftward.
3) When a sales tax is imposed on sellers, the supply curve shifts so that the vertical distance
between the old and the new supply curve equals the
A) sales tax multiplied by the price elasticity of demand.
B) sales tax multiplied by the price elasticity of supply.
C) amount of the sales tax.
D) sales tax divided by the price elasticity of demand.

4) The government raises the sales tax on shirts. The tax is imposed on sellers. As a result, the
________.
A) supply curve of shirts shifts leftward
B) supply curve of shirts shifts rightward
C) demand curve for shirts becomes vertical
D) demand curve for shirts becomes horizontal
5) As long as the supply curve for a good is upward sloping and the demand curve is downward
sloping, a sales tax imposed on sellers shifts the supply curve
A) leftward and definitely raises the equilibrium price.
B) leftward and possibly raises the equilibrium price.
C) rightward and possibly increases the equilibrium quantity.
D) rightward and definitely decreases the equilibrium quantity.
6) In the above figure, a sales tax of $1 per unit imposed on sellers ________ the price buyers
pay and ________ the price that suppliers keep for themselves.
A) affects; does not affect
B) does not affect; affects
C) does not affect; does not affect
D) affects; affects
7) In the above figure, a sales tax of $1 per unit imposed on sellers shifts the
A) demand curve rightward.
B) supply curve leftward.
C) demand curve leftward.
D) supply curve rightward.
8) Suppose the demand for wine is elastic and that initially 5 million bottles of wine are
produced and consumed in the United States. If the government imposes a tax of $2 per bottle of
wine, the government will collect
A) more than $10 million in tax revenues.
B) $10 million in tax revenues.
C) less than $10 million in tax revenues.
D) an amount that may be more than, equal to, or less than $10 million in tax revenues
depending on the precise elasticity of demand.
9) How a sales tax is divided between buyers and sellers is determined by
A) the government’s choice of whom to tax.
B) who the law says must pay the tax.
C) the elasticities of supply and demand.
D) the revenue needs of government.
10) When a tax is imposed on a good or service, buyers respond only to the price that ________
the tax, and sellers respond to the price that ________ the tax.
A) excludes; includes
B) includes; excludes
C) excludes; excludes
D) includes; includes
11) The demand and the supply for a good are each neither perfectly elastic nor perfectly
inelastic. If a sales tax on sellers of the good is imposed, the tax is paid by
A) only buyers.
B) only sellers.
C) both buyers and sellers.
D) neither buyers nor sellers.
12) A tax is imposed on the sale of a product. As long as neither the supply nor the demand is
perfectly elastic or inelastic
A) there is no change in the price paid by the consumers.
B) the price paid by the consumers increases by the full amount of the tax.
C) the price paid by the consumers increases by less than the amount of the tax.
D) the price paid by the consumers increases by more than the amount of the tax.
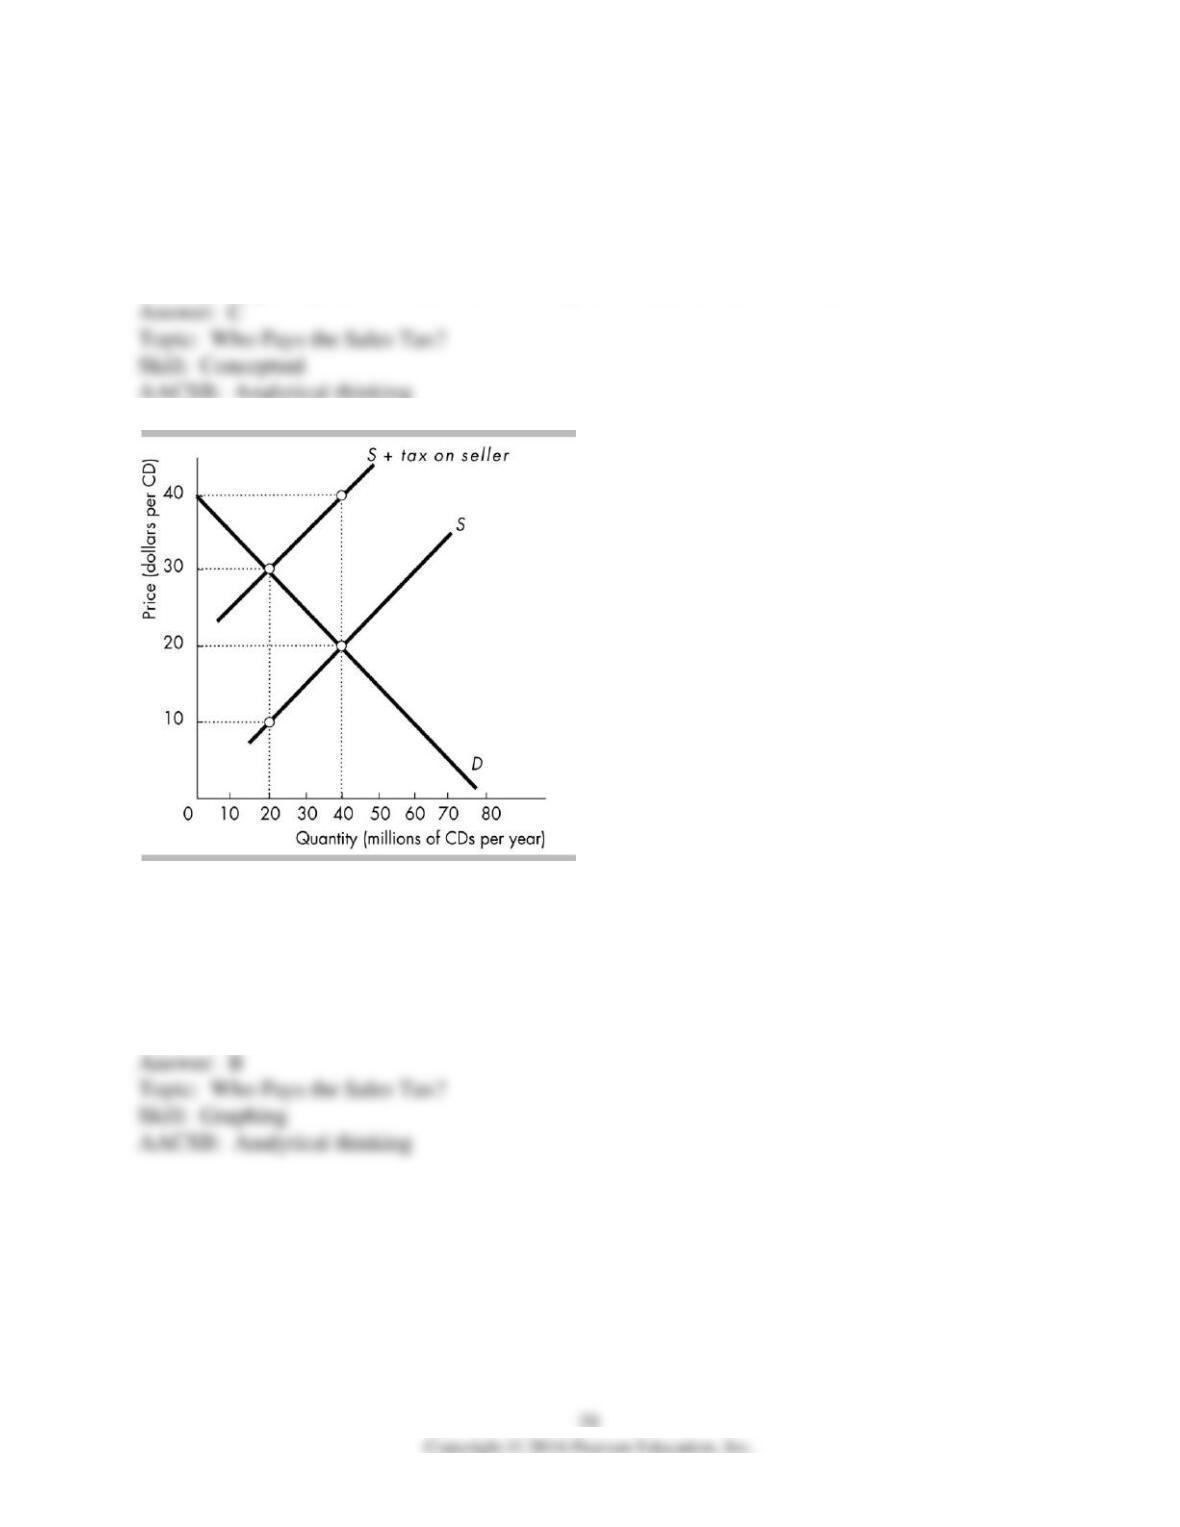
13) In the above figure, the price paid by the buyer before the tax is ________ per compact disc,
and the price paid by the buyer after the tax is ________ per compact disc.
A) $20; $20
B) $20; $30
C) $30; $20
D) $30; $30
14) In the above figure, the price received by the seller before the tax is ________ per compact
disc, and the price received and kept by the seller after the tax is ________ per compact disc.
A) $20; $20
B) $20; $10
C) $30; $20
D) $30; $10
15) In the above figure, what is the amount of the tax per compact disc?
A) $10
B) $20
C) $30
D) $40
16) In the above figure, what is the total tax revenue collected by the government?
A) $20 million
B) $40 million
C) $200 million
D) $400 million
17) In the above figure, who pays the larger share of the tax?
A) buyers
B) sellers
C) Buyers and sellers each pay the same amount of the tax and each pays $10 per compact disc.
D) Buyers and sellers each pay the same amount of the tax, but the amount each pays is different
than $10 per compact disc.
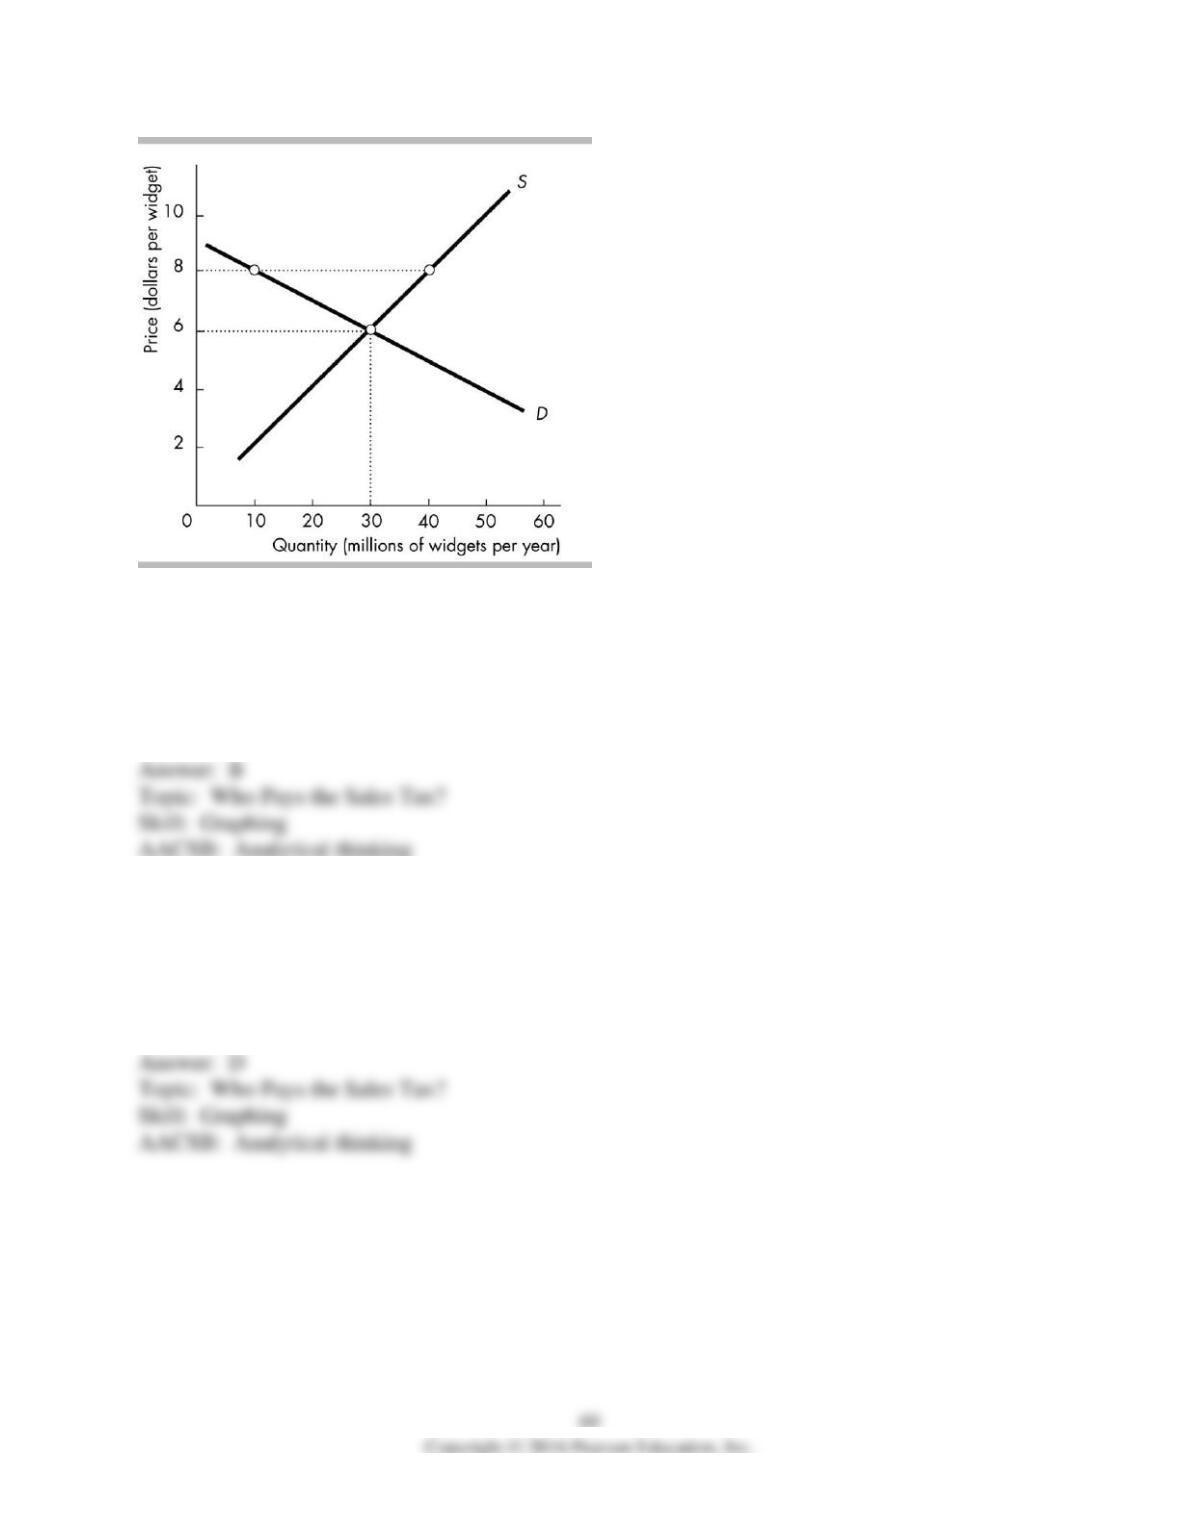
18) In the figure above, if a tax of $2 per widget is imposed on sellers, then the price of widgets
paid by the buyer will be
A) more than or equal to $8.
B) between $8 and $6.
C) $6.
D) less than $6.
19) In the figure above, if a tax of $2 per widget is imposed on sellers, then the after-tax amount
per widget received by the seller will be
A) more than or equal to $8.
B) between $8 and $6.
C) $6.
D) less than $6.