52) The above figure shows Dana’s marginal benefit curve for ice cream. If the market price is $2
per gallon, then Dana’s consumer surplus from the 4th gallon of ice cream is
A) $0.
B) $2.
C) $3.
D) $10.
53) The above figure shows Dana’s marginal benefit curve for ice cream. If the price of ice cream
is $2 per gallon, then Dana’s consumer surplus from the 4th gallon
A) is greater than her consumer surplus from the 8th gallon.
B) is the same as her consumer surplus from the 8th gallon.
C) is less than her consumer surplus from the 8th gallon.
D) could be greater than, equal to, or less than the consumer surplus from the 8th gallon.
54) The above figure shows Dana’s marginal benefit curve for ice cream. If the price of ice cream
is $2 per gallon, then the gallon that gives Dana exactly zero consumer surplus is
A) the 8th gallon.
B) the 12th gallon.
C) the 16th gallon.
D) the 20th gallon.
55) The above figure shows Dana’s marginal benefit curve for ice cream. If the price of ice cream
is $2 per gallon and Dana is allowed to buy only 8 gallons of ice cream, then her consumer
surplus on the 8th gallon is
A) $1.
B) $2.
C) $3.
D) $8.
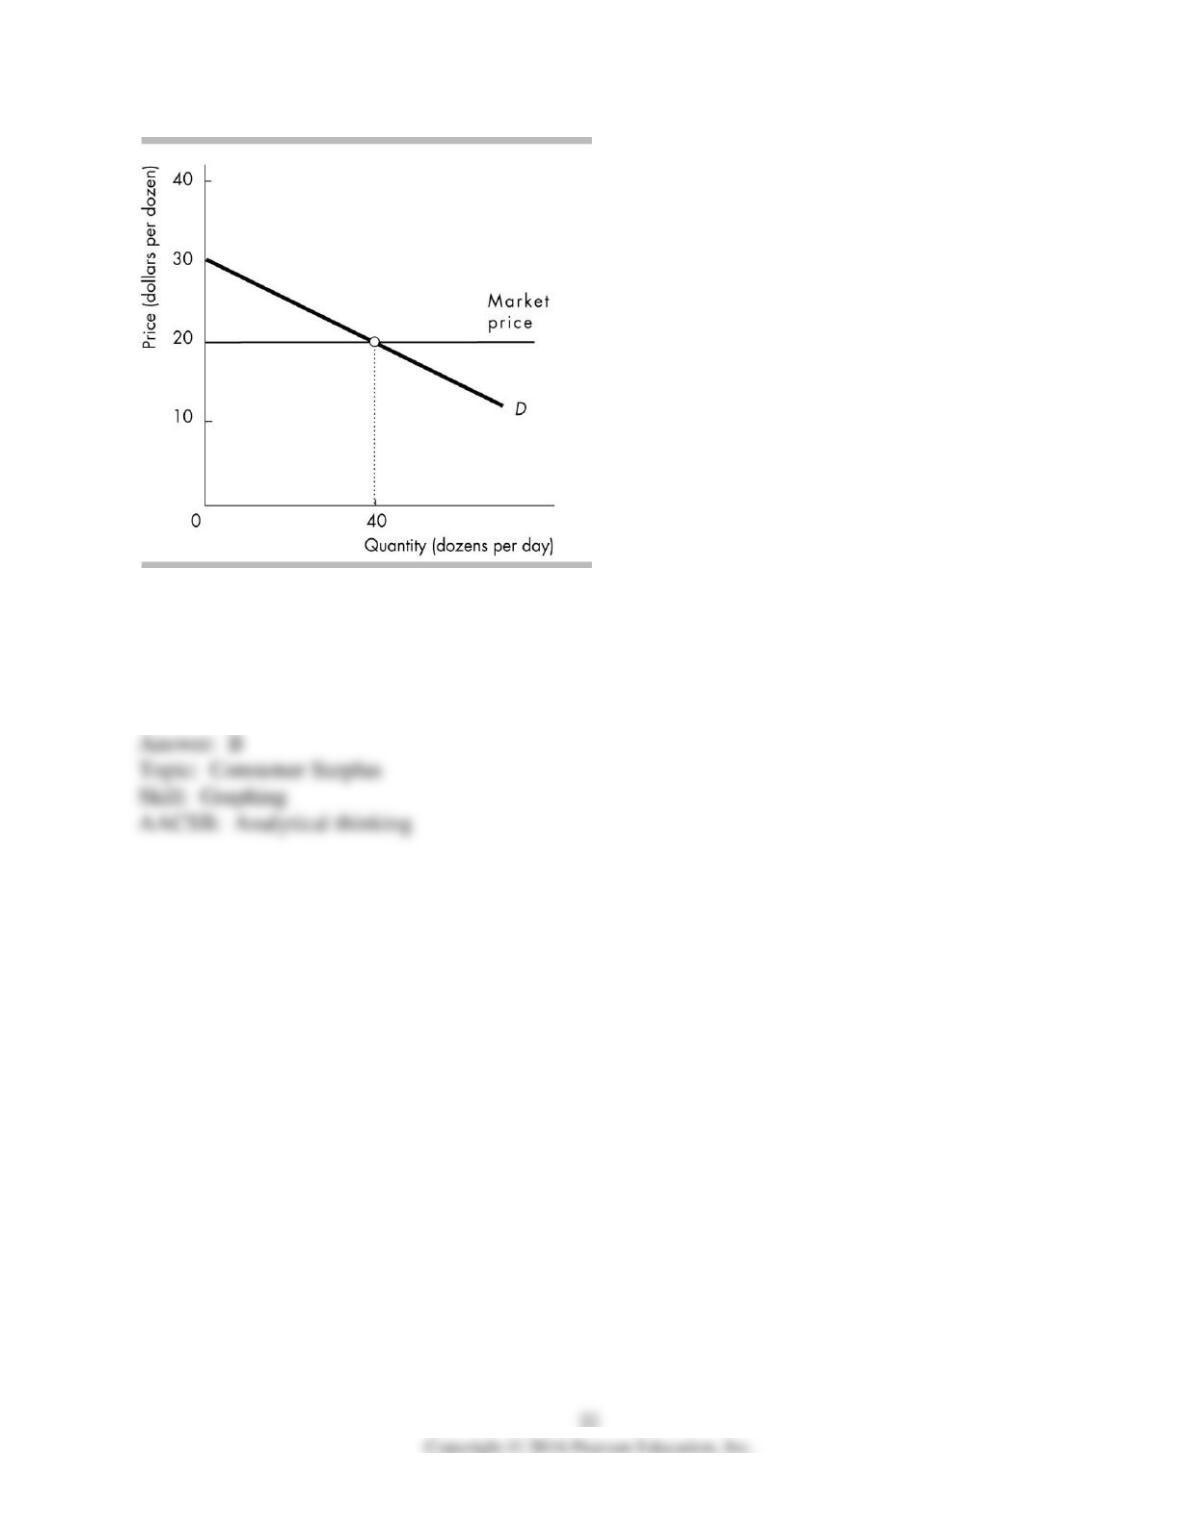
56) The figure tells us about the market for red roses. The consumer surplus is ________ a day.
A) $800
B) $200
C) $1,000
D) $20
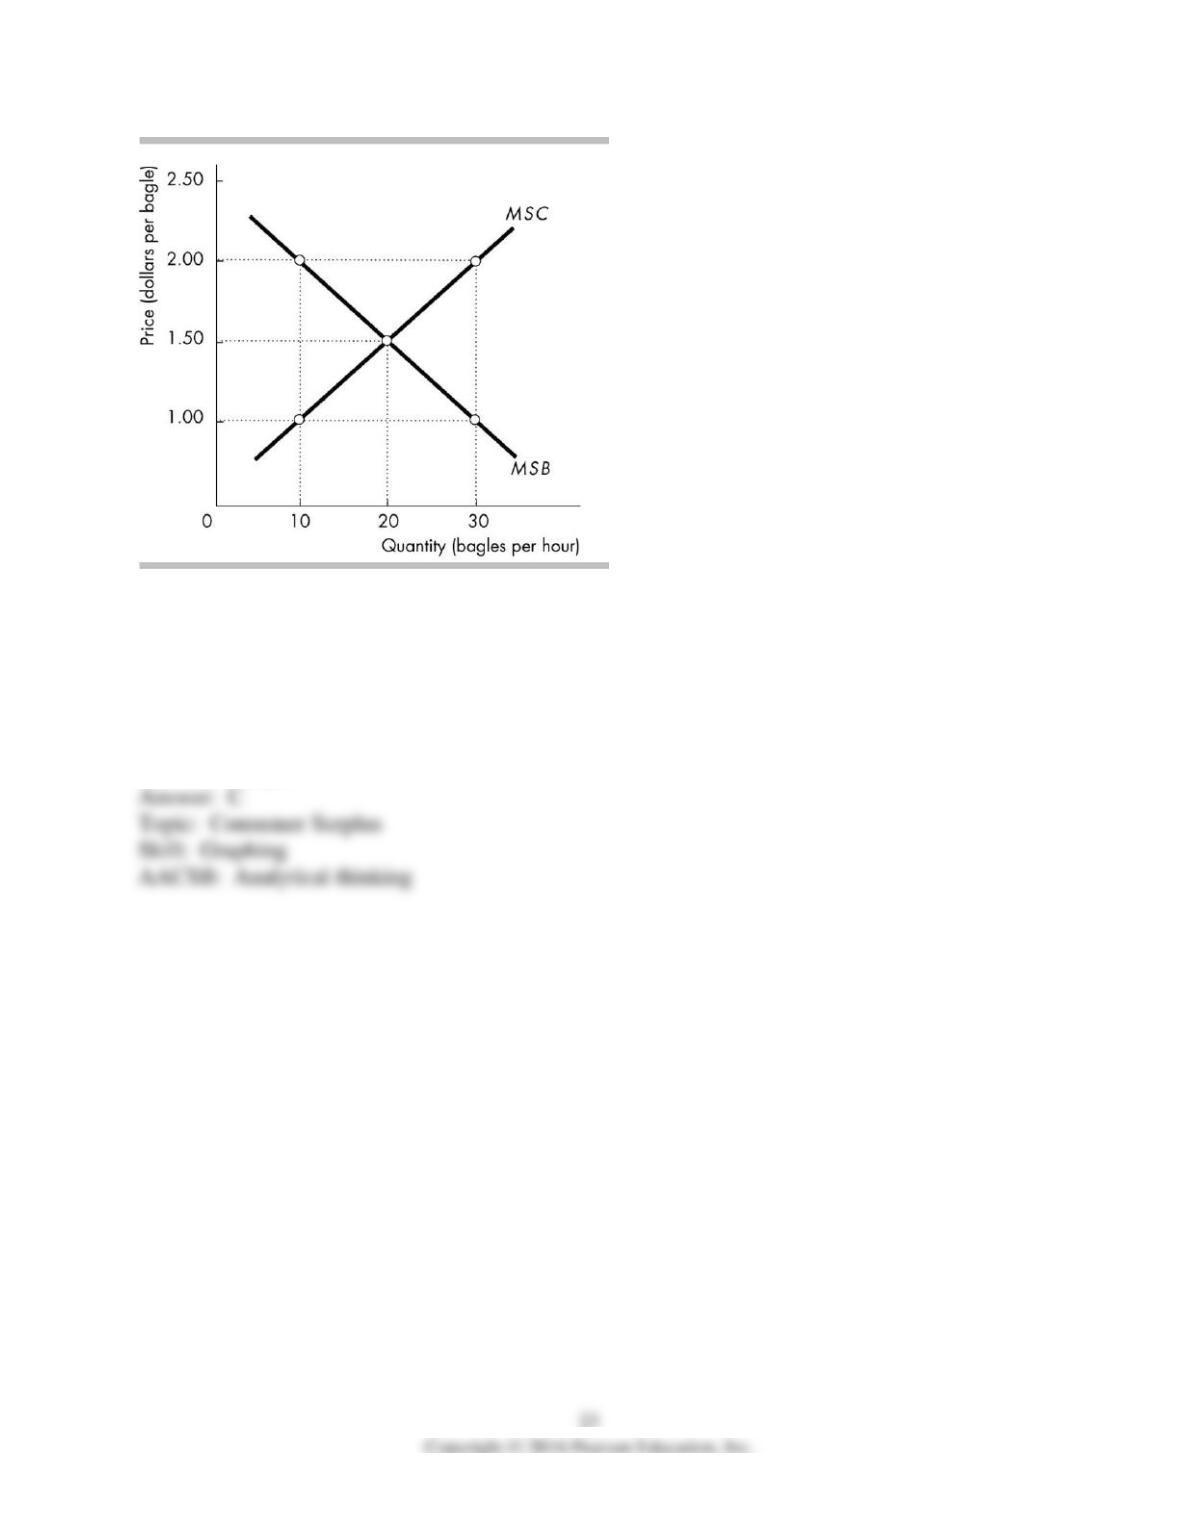
57) The figure illustrates the market for bagels. Initially the market is in equilibrium, Then the
number of bagels produced is cut from 20 to 10 an hour and the price rises to $2.00 per bagel.
Consumer surplus decreases by ________.
A) $5.00 an hour
B) $2.50 an hour
C) $7.50 an hour
D) $0.50 a bagel
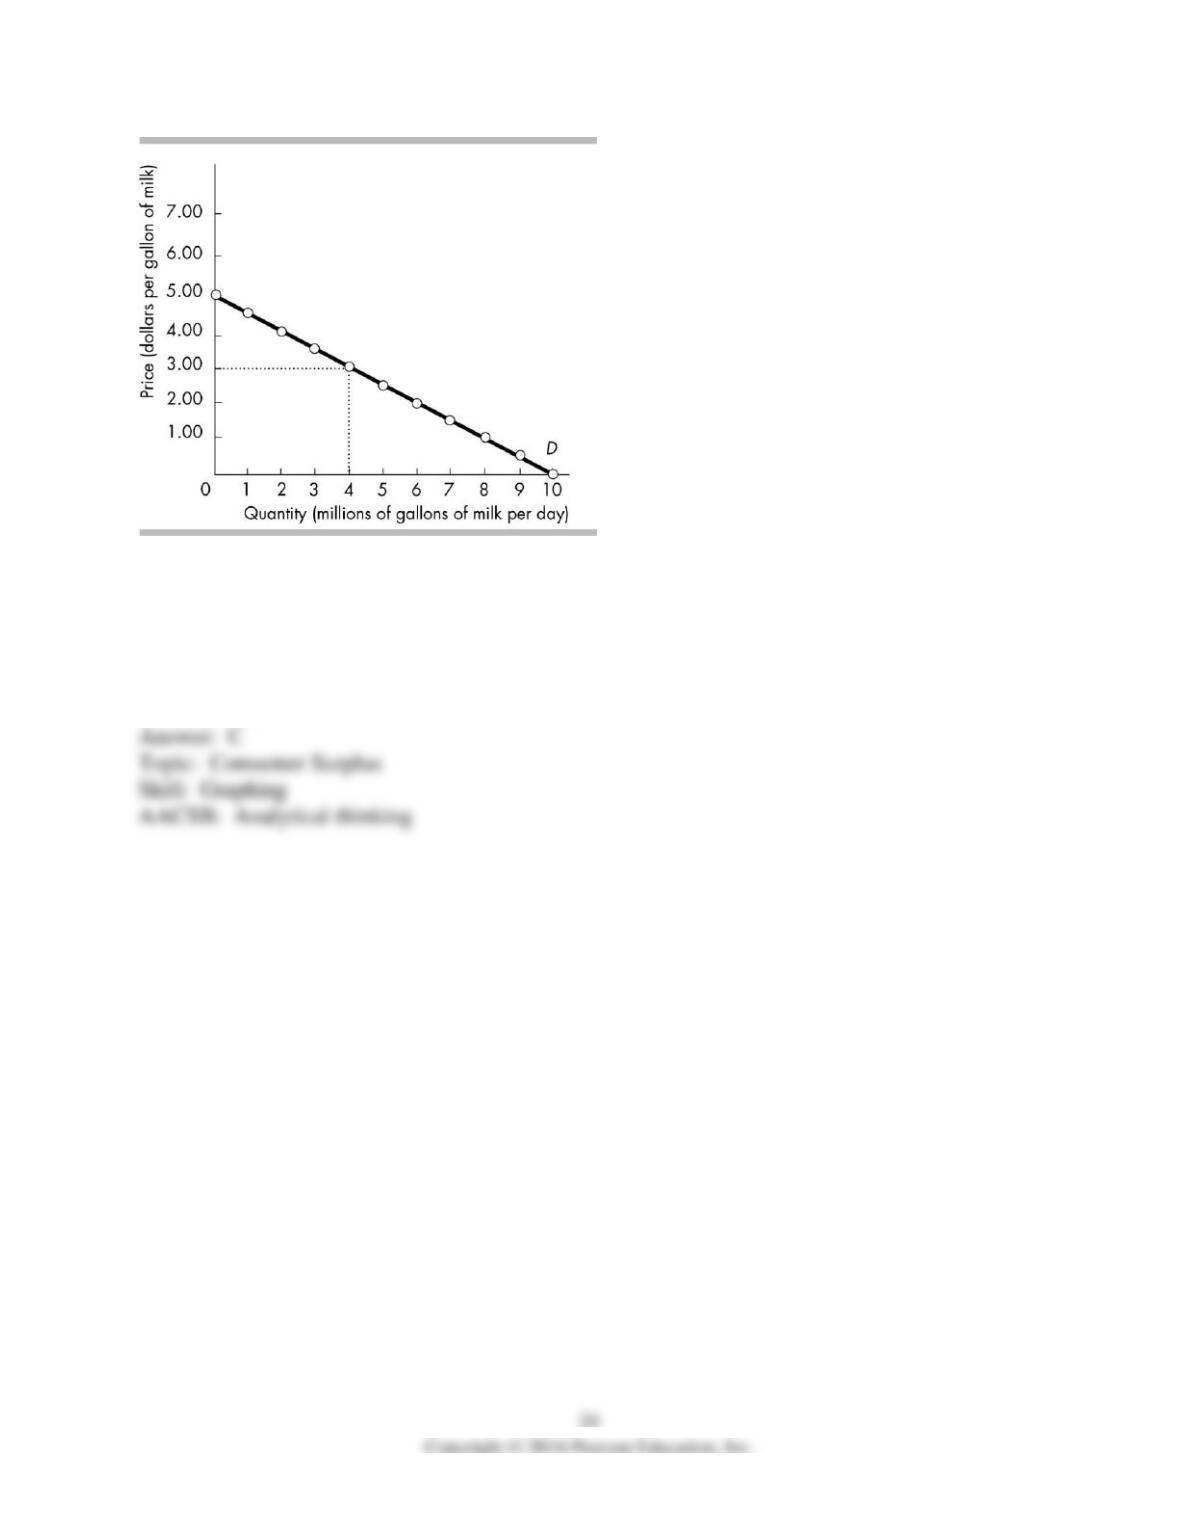
58) In the above figure, what is the total consumer surplus from all the milk bought if the price of
milk is $3.00 per gallon?
A) $16 million
B) $12 million
C) $4 million
D) $2 million
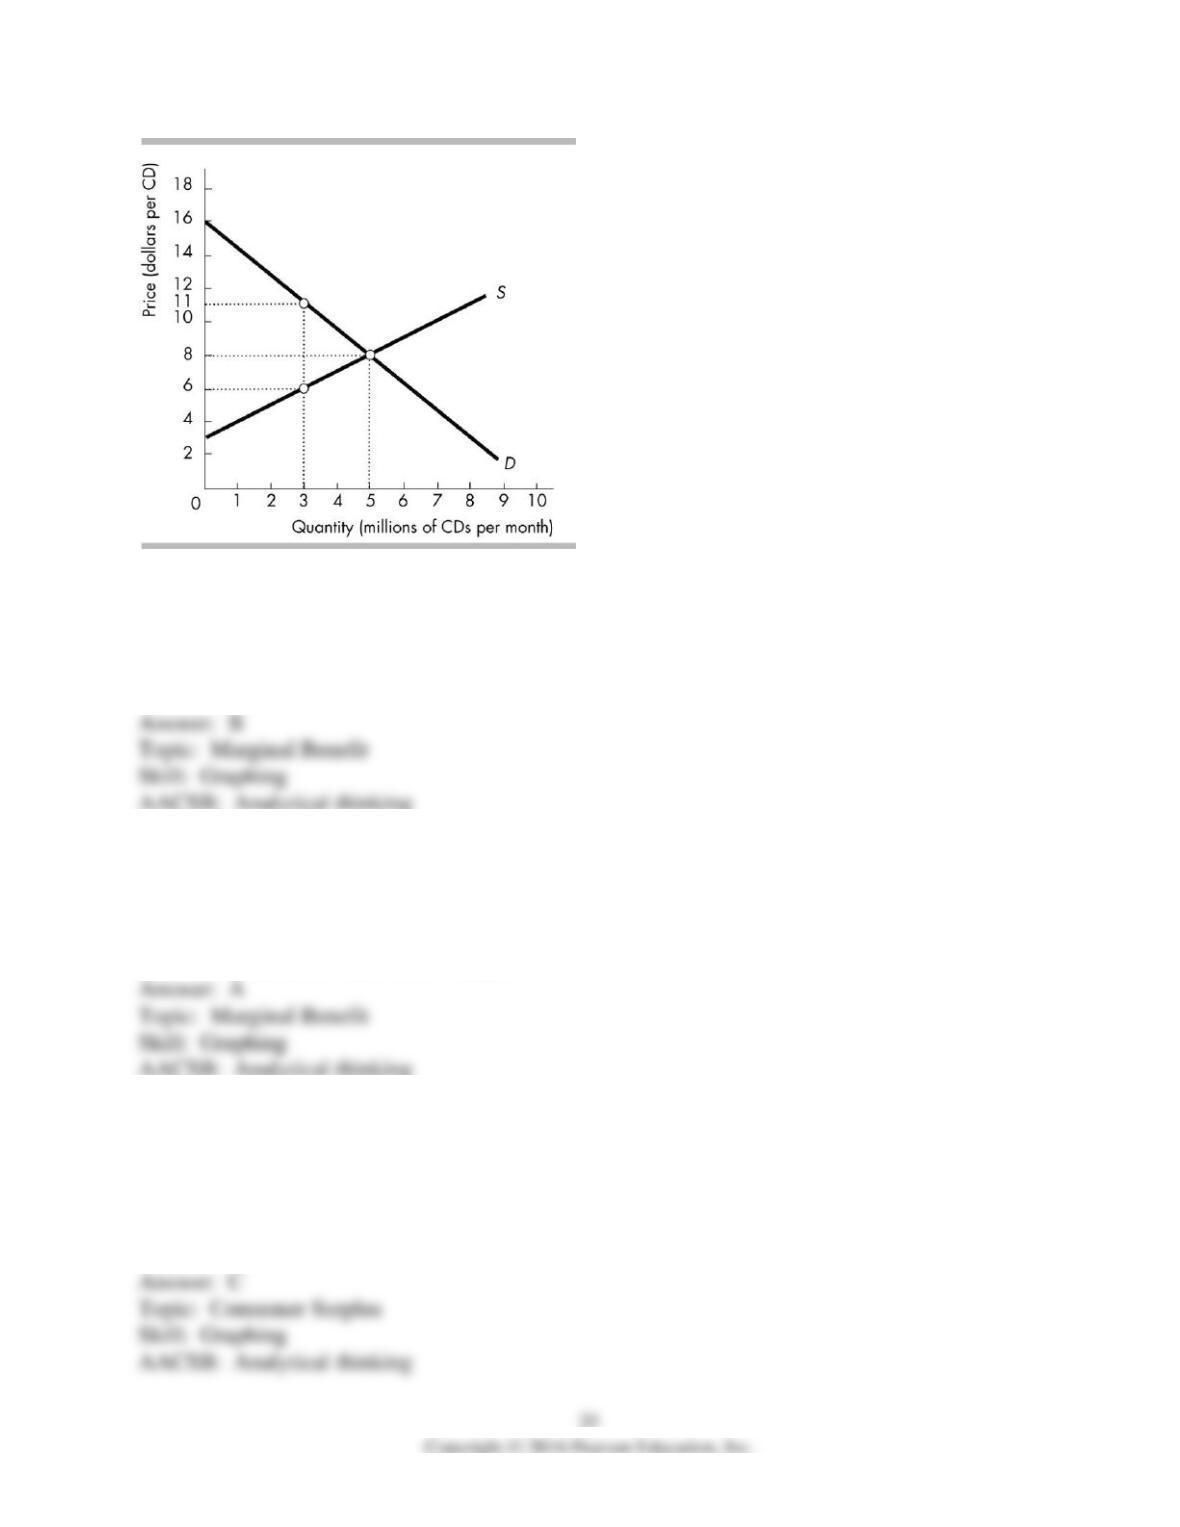
59) In the figure above, for each CD, the price a consumer is willing to pay is equal to the
A) economy’s marginal social cost of producing that CD.
B) consumer’s own marginal benefit from consuming that CD.
C) consumer’s total consumer surplus.
D) Both answers A and B are correct.
60) In the figure above, what is the marginal social benefit of the 3,000,000th CD per month?
A) $11.00 per CD
B) $8.00 per CD
C) $6.00 per CD
D) None of the above answers is correct.
61) In the figure above, when the market is in equilibrium, total consumer surplus on all the CDs
bought will be
A) greater than $30 million.
B) less than at any other price.
C) $20 million.
D) less than $15 million.
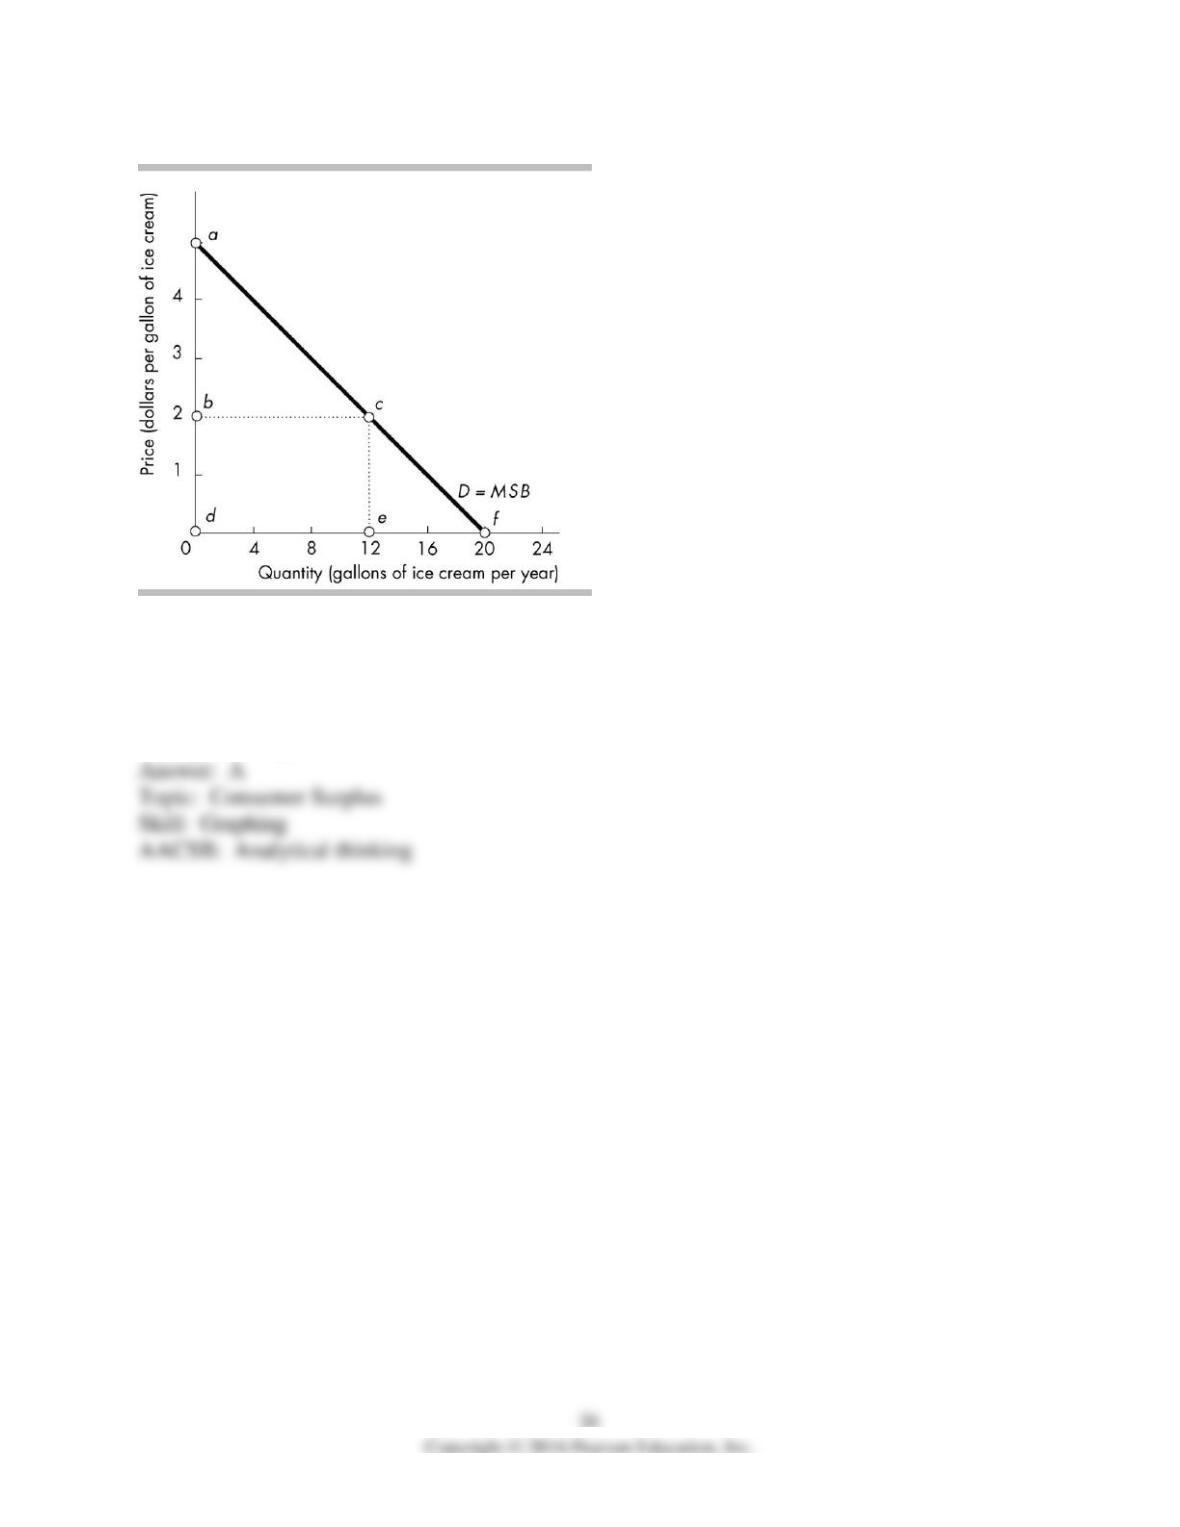
62) In the above figure, if the price is $2, then the total consumer surplus is
A) triangle abc.
B) triangle cef.
C) trapezoid adec.
D) trapezoid bdfc.
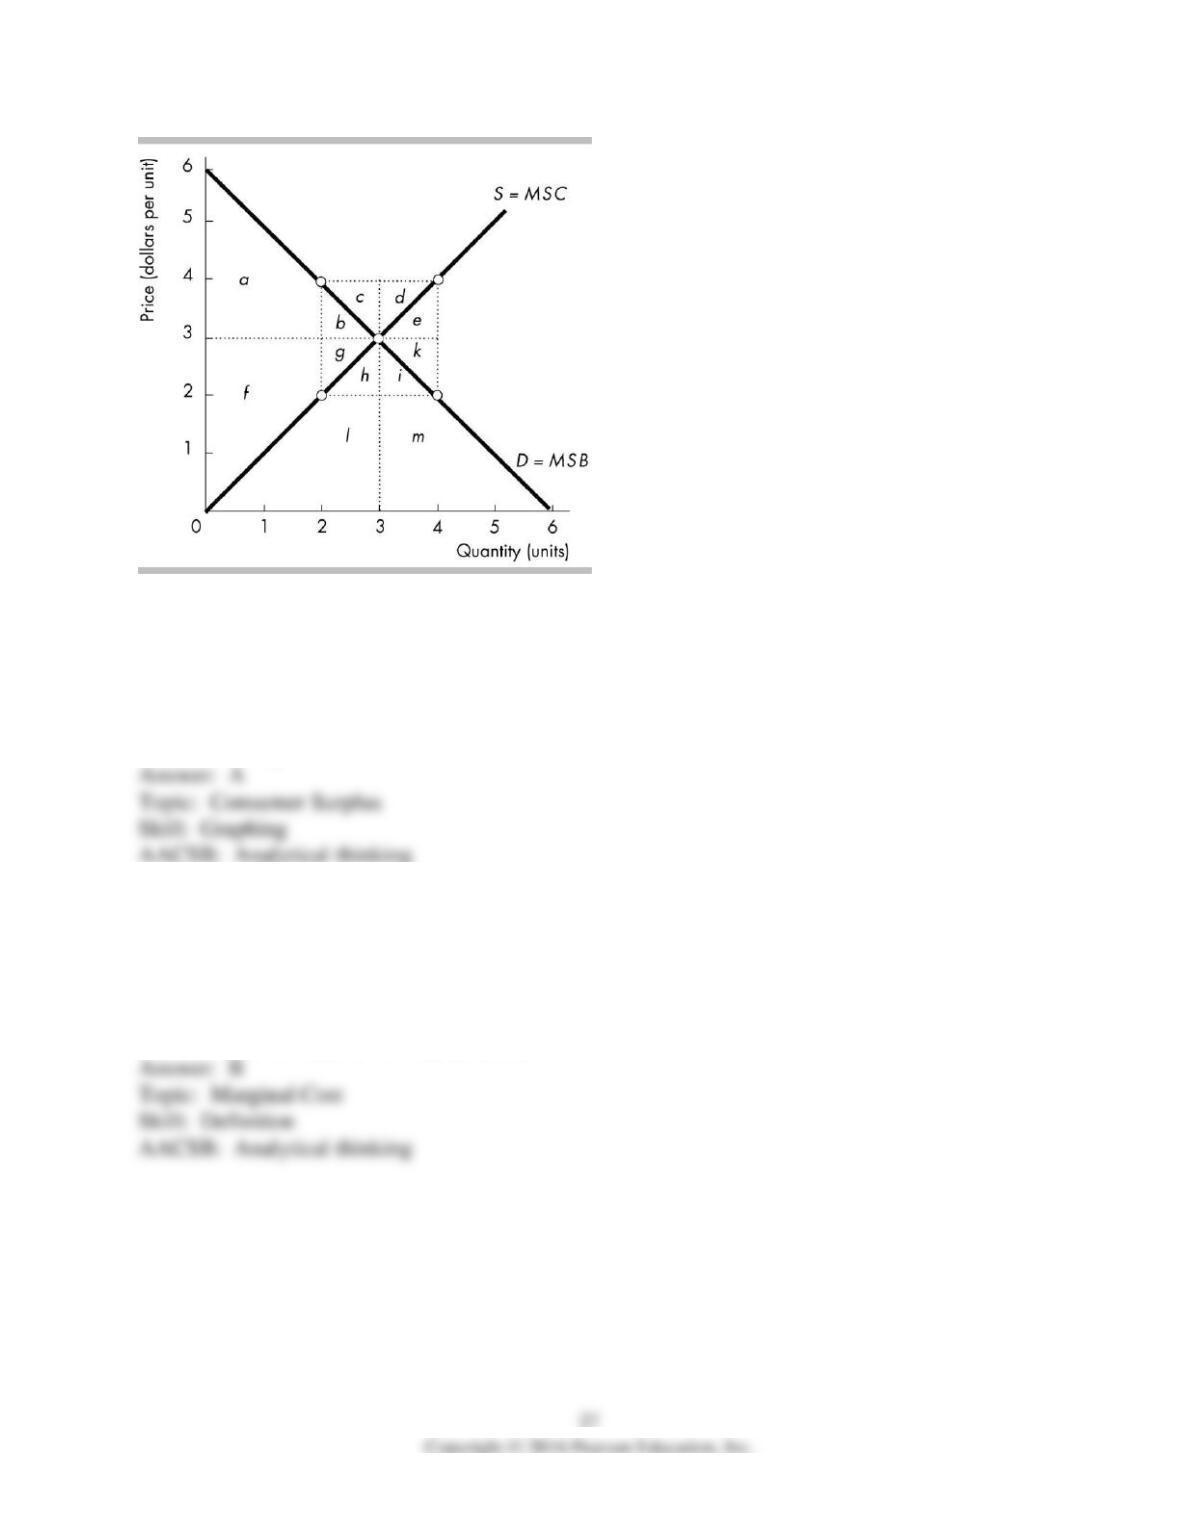
63) In the figure above, when production is 3 units with a price of $3, the consumer surplus
equals
A) a + b.
B) a + b + f + g.
C) a + b + f + g + h + l.
D) a + b + f + g + h + l + i + m.
64) Marginal cost is
A) the same as the marginal benefit because producers benefit from the money they receive
when they sell the good.
B) the opportunity cost of producing one more unit.
C) the total opportunity cost of producing all the units of the good.
D) zero at the efficient level of production.
65) Marginal cost is best defined as
A) the extra cost of producing one more unit of output.
B) the profit earned from selling one more unit of output.
C) the price received from selling one more unit of output.
D) equal to producer surplus.
66) Marginal cost is the
A) extra benefit that people receive from producing one more unit of a good or service.
B) maximum amount consumers are willing to pay for one more unit of a good or service.
C) opportunity cost of producing one more unit of a good or service.
D) None of the above answers is correct.
67) Which of the following represents the marginal cost of a soda?
I. The opportunity cost of producing another soda.
II. The minimum price someone is willing to pay for another soda.
A) I only
B) II only
C) I and II
D) Neither I nor II
68) The minimum supply-price is the same as
A) marginal cost.
B) market price.
C) producer surplus.
D) profit.
69) Currently tire producers must receive a price of $50 per tire to produce 5000 tires. If the
supply curve of tires is upward sloping, then to produce one additional tire, tire producers will
need to receive a price of
A) $50.
B) less than $50.
C) more than $50.
D) $0.
70) The marginal cost curve
A) shows the maximum price that a producer must receive to induce it to produce a unit of a
good or service.
B) shows the minimum price sellers must receive to produce a unit of a good or service.
C) is the same as the demand curve.
D) shows what buyers are willing to give up to get one more unit of a good or service.
71) Which of the following statements about supply curves is CORRECT?
I. A supply curve also can be a marginal cost curve.
II. A supply curve tells the quantity of other goods and services that sellers must give up to
produce another unit of the good.
A) I only
B) II only
C) both I and II
D) neither I nor II
72) The supply curve for CDs shows the
A) minimum price that consumers are willing to pay if a given quantity of CDs is available.
B) maximum price that consumers are willing to pay if a given quantity of CDs is available.
C) maximum price that producers must be offered to get them to produce a given quantity of
CDs.
D) minimum price that producers must be offered to get them to produce a given quantity of
CDs.
73) Marginal social cost
A) is the additional cost to the consumer of consuming another unit of a good.
B) is equal to price times quantity sold.
C) decreases as more of a good is produced and, hence, is depicted by a downward sloping
curve.
D) is the opportunity cost of producing one more unit of a good and, hence, is the same as the
supply curve.
74) The market supply curve is also the
A) marginal social cost curve.
B) marginal value curve.
C) marginal social benefit curve.
D) maximum-supply-price curve.
75) Suppose there are four firms that are each willing to sell one unit of a good. Each firm has a
different minimum price that they are willing to sell for: Firm A $6, Firm B $7, Firm C $10, and
Firm D $12. If the market price is $11 then the market supply for this good will be
A) 3 units.
B) 4 units.
C) 1 unit.
D) 2 units.
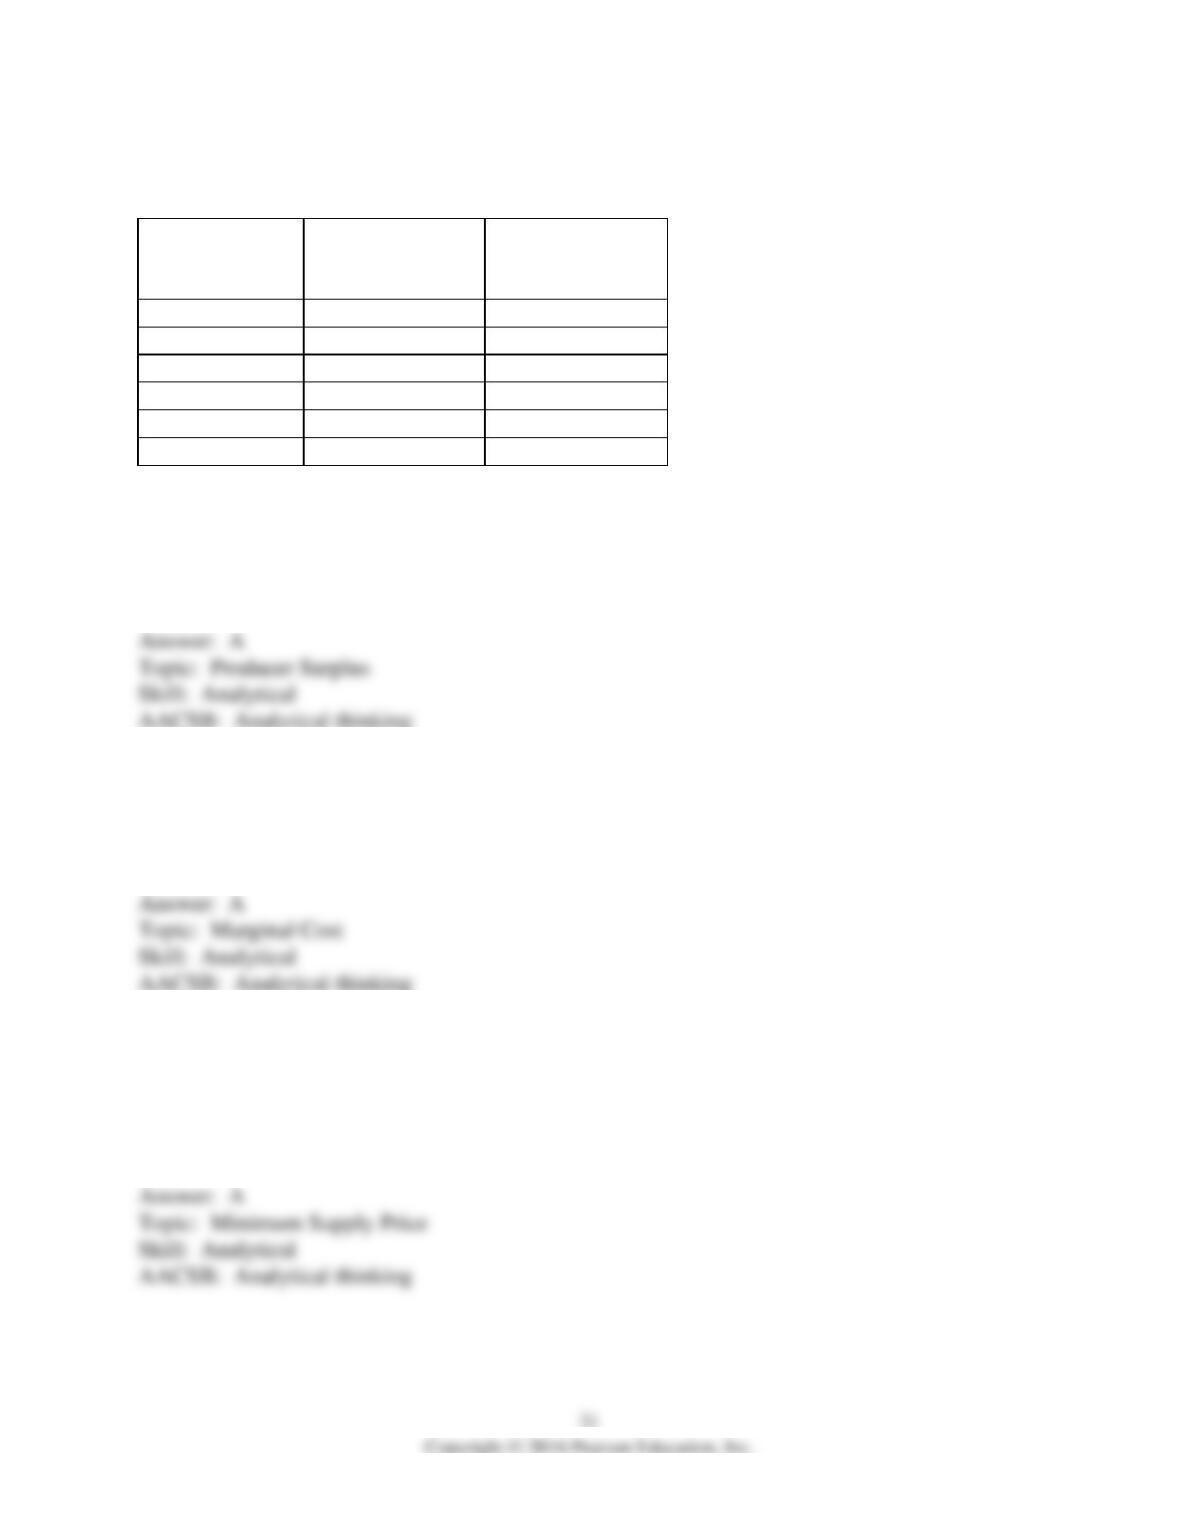
The table below shows the supply schedules for Fred’s Pizza and Johnny’s Pizza, the only sellers
of pizza in the market.
Price
(dollars per slice)
Fred’s quantity
supplied
(slices per month)
Johnny’s quantity
supplied
(slices per month)
1.50
0
0
2.00
100
150
2.50
200
300
3.00
300
450
3.50
400
600
4.00
500
750
76) Using the table, Fred’s marginal cost of the 200th slice of pizza is
A) $2.50.
B) $6.
C) $0.50.
D) $20.
77) Using the table, Johnny’s marginal cost of the 600th slice of pizza is
A) $3.50.
B) $12.50.
C) zero.
D) $1.50.
78) Using the table, what is the minimum price that Fred is willing to accept to supply 400 slices
of pizza per month?
A) $3.50
B) $2.50
C) $3
D) $4
79) Using the table, what is the marginal social cost when the market quantity supplied is 750
slices of pizza per month?
A) $3
B) $7
C) $9
D) $3.50
80) The producer surplus on a unit of a good is the
A) difference between the marginal social benefit and the marginal social cost.
B) number of dollars’ worth of other goods and services forgone to produce this unit of the good.
C) difference between the price of the good and the marginal cost of producing the good.
D) difference between the total cost of the good and the marginal cost.
81) Producer surplus is the ________ summed over the quantity sold.
A) value of a good minus the price received for it
B) price received for a good minus the value of the good
C) price received for a good minus its marginal cost
D) marginal cost of making a good minus the price received for it
82) Producer surplus is the price received ________ summed over the quantity sold.
A) plus the consumer surplus
B) multiplied by the quantity sold
C) minus its marginal cost of production
D) subtracted from the value of the good
83) Producer surplus is the
A) cost of the good summed over the quantity sold.
B) demand for a good minus the supply summed over the quantity sold.
C) price of a good minus the marginal cost of producing it summed over the quantity sold.
D) marginal cost of producing it summed over the quantity sold.
84) Producer surplus is the difference between the
A) price and the willingness to pay for the good.
B) price and the marginal cost of producing the good summed over the quantity sold.
C) willingness to pay for the good and the marginal cost of producing the good summed over the
quantity sold.
D) marginal benefit of consuming the good and the marginal cost of producing the good summed
over the quantity sold.
85) In the market for CDs, the producer surplus will decrease if ________.
A) the supply of CDs increases
B) the price of a CD decreases
C) the marginal cost of a CD decreases
D) the price of a CD increases
86) In 2012 a severe drought raised the price of corn. For a farmer in Canada who harvested a
normal crop because the farm was not affected directly by the drought, the increase in the price
of corn
A) increases the farmer’s producer surplus.
B) decreases the farmer’s producer surplus.
C) does not affect the producer surplus because this change is a movement along the farmer’s
supply curve and not a shift of the farmer’s supply curve.
D) increases producer surplus only if the farmer’s supply is completely inelastic.
87) When the Smiths were shopping for their present home, the asking price from the previous
owner was $250,000.00. The Smiths had decided they would pay no more than $245,000.00 for
the house. After negotiations, the Smiths actually purchased the house for $239,000.00.
Therefore, the previous owner earned a producer surplus of
A) $250,000.00.
B) $11,000.00.
C) $5,000.00.
D) an amount unknown given the information in the question.
88) Stefano has just completed an original oil painting. After considering the costs for brushes,
paint, canvas, and the value of Stefano’s labor time, the marginal cost of the painting is $1,000.
Lucky Stefano. One art lover paid him $1,500. How much producer surplus did Stefano obtain?
A) The amount of producer surplus cannot be determined from the information given.
B) $1,500
C) $1,000
D) $500
89) Farmer Jones knows that the marginal cost to produce a bushel of tomatoes is $5 per bushel.
He also knows that a consumer is willing to pay a maximum of $9 for the bushel. The price of
the bushel is $6 and Farmer Jones sells his bushel for $6. On this bushel, Farmer Jones earns a
producer surplus equal to
A) $1.
B) $3.
C) $5.
D) $6.
90) Considering all costs of production, the marginal cost of producing a hot dog is $1.00. The
price of a hot dog is $1.50. Thus, the producer surplus from this hot dog is
A) $1.50.
B) $1.00.
C) $.50.
D) Zero, because $1.50 is the most anyone would pay for a hot dog.
91) Suppose there are four firms that are each willing to sell one unit of a good. Each firm has a
different minimum price that they are willing to sell for: Firm A $6, Firm B $7, Firm C $10, and
Firm D $12. If the market price is $11, then the total producer surplus is
A) $10.
B) $11.
C) $33.
D) $9.
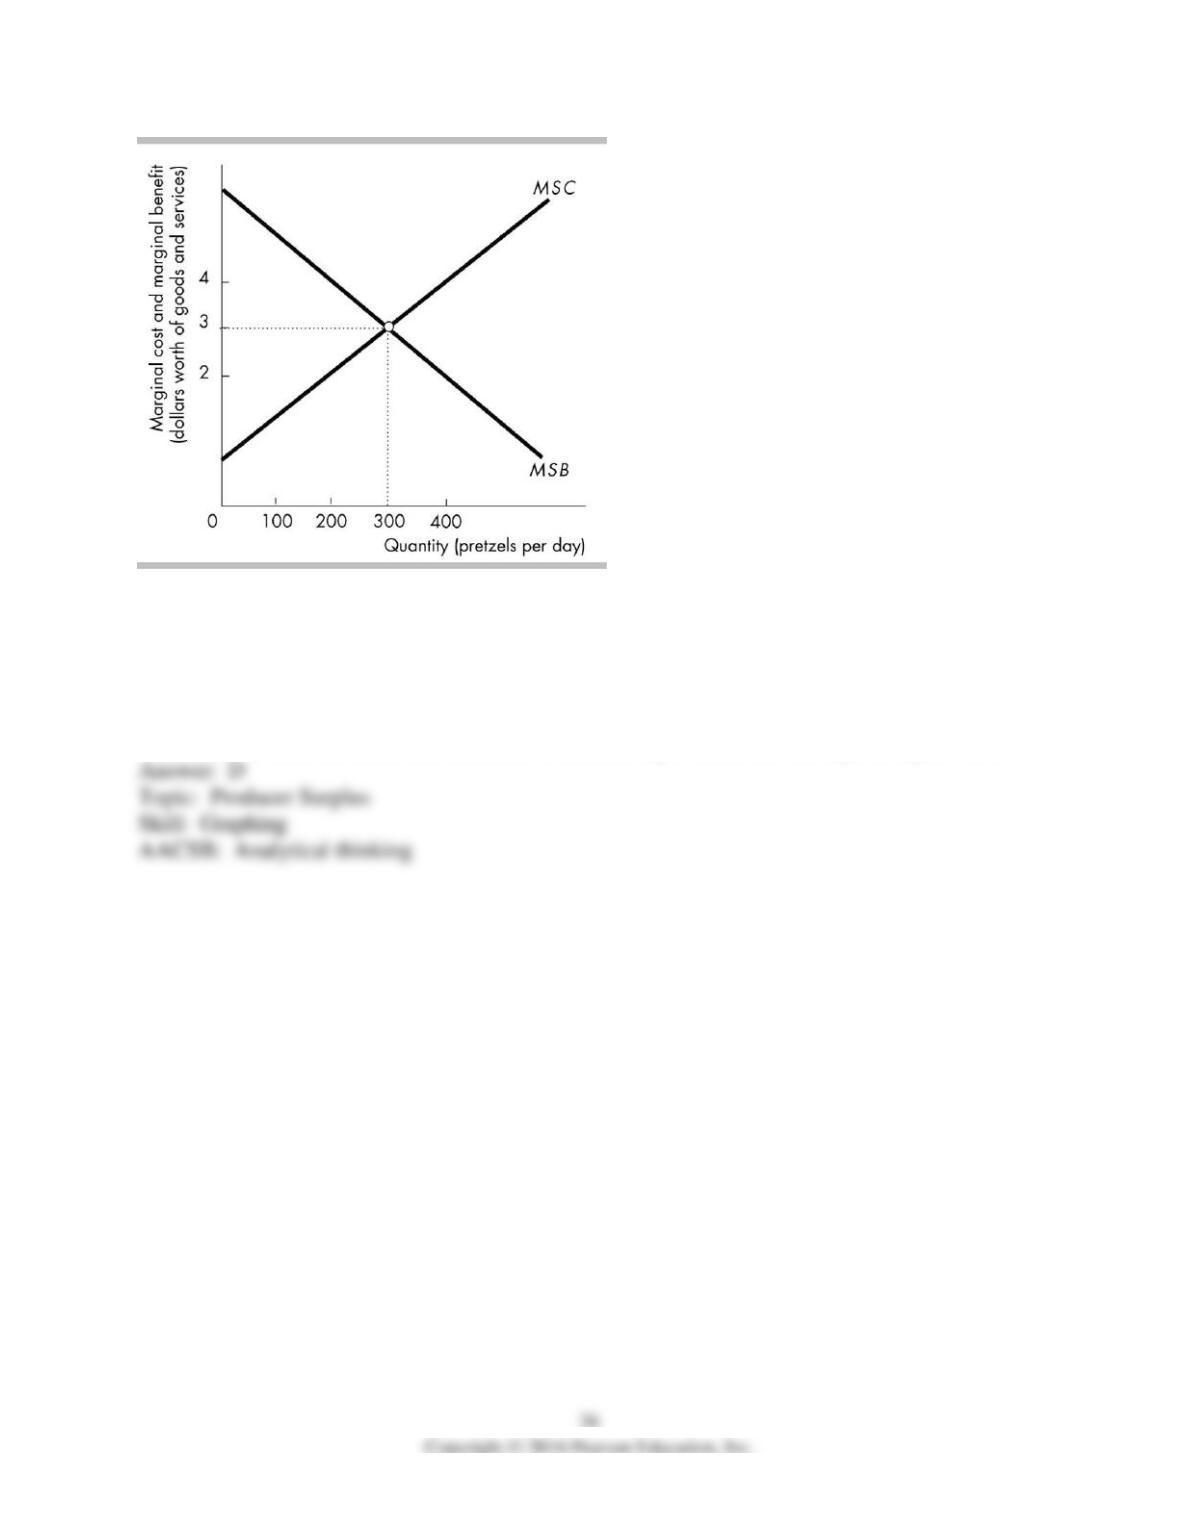
92) In the above figure, when the price of pretzels is $3.00 per pound, the total producer surplus
from all the pretzels will be
A) zero.
B) greater than at any other price.
C) less than at any other price.
D) the sum of the difference between $3.00 and the marginal cost of all the pounds produced.
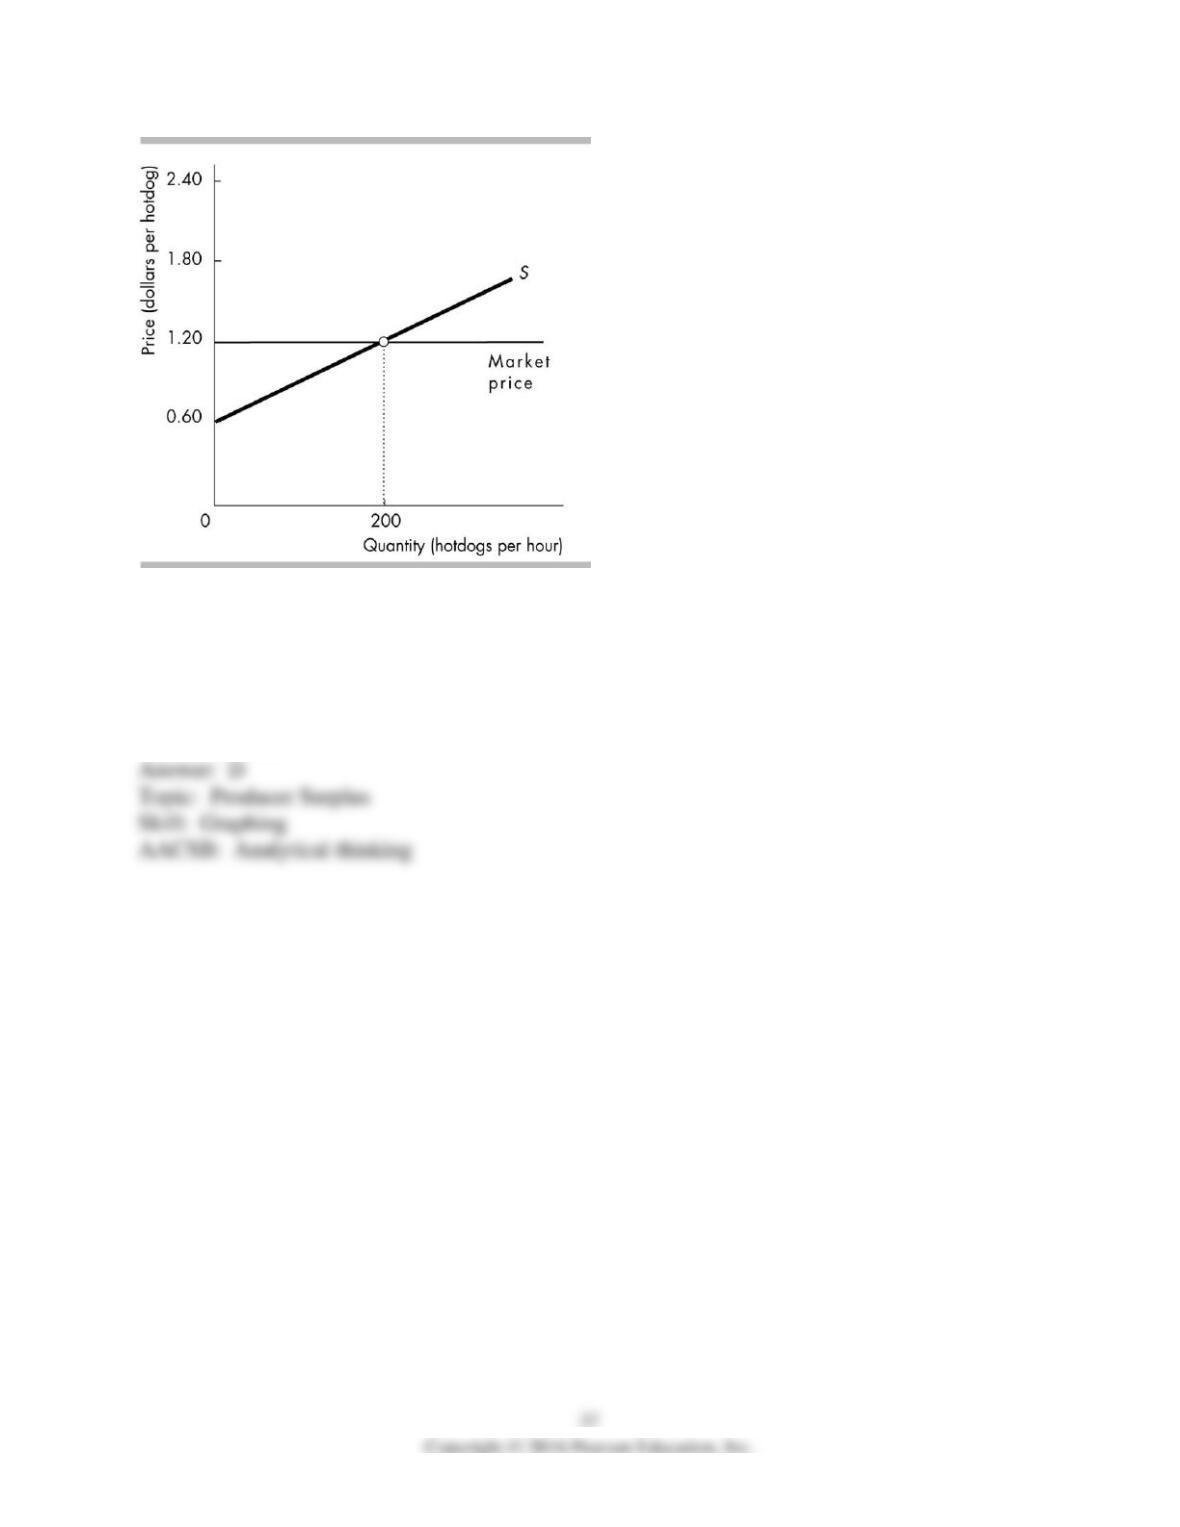
93) The figure illustrates the market for hot dogs on Big Foot Island. The producer surplus is
________.
A) $240 an hour
B) $180 an hour
C) $1.20 a hot dog
D) $60 an hour
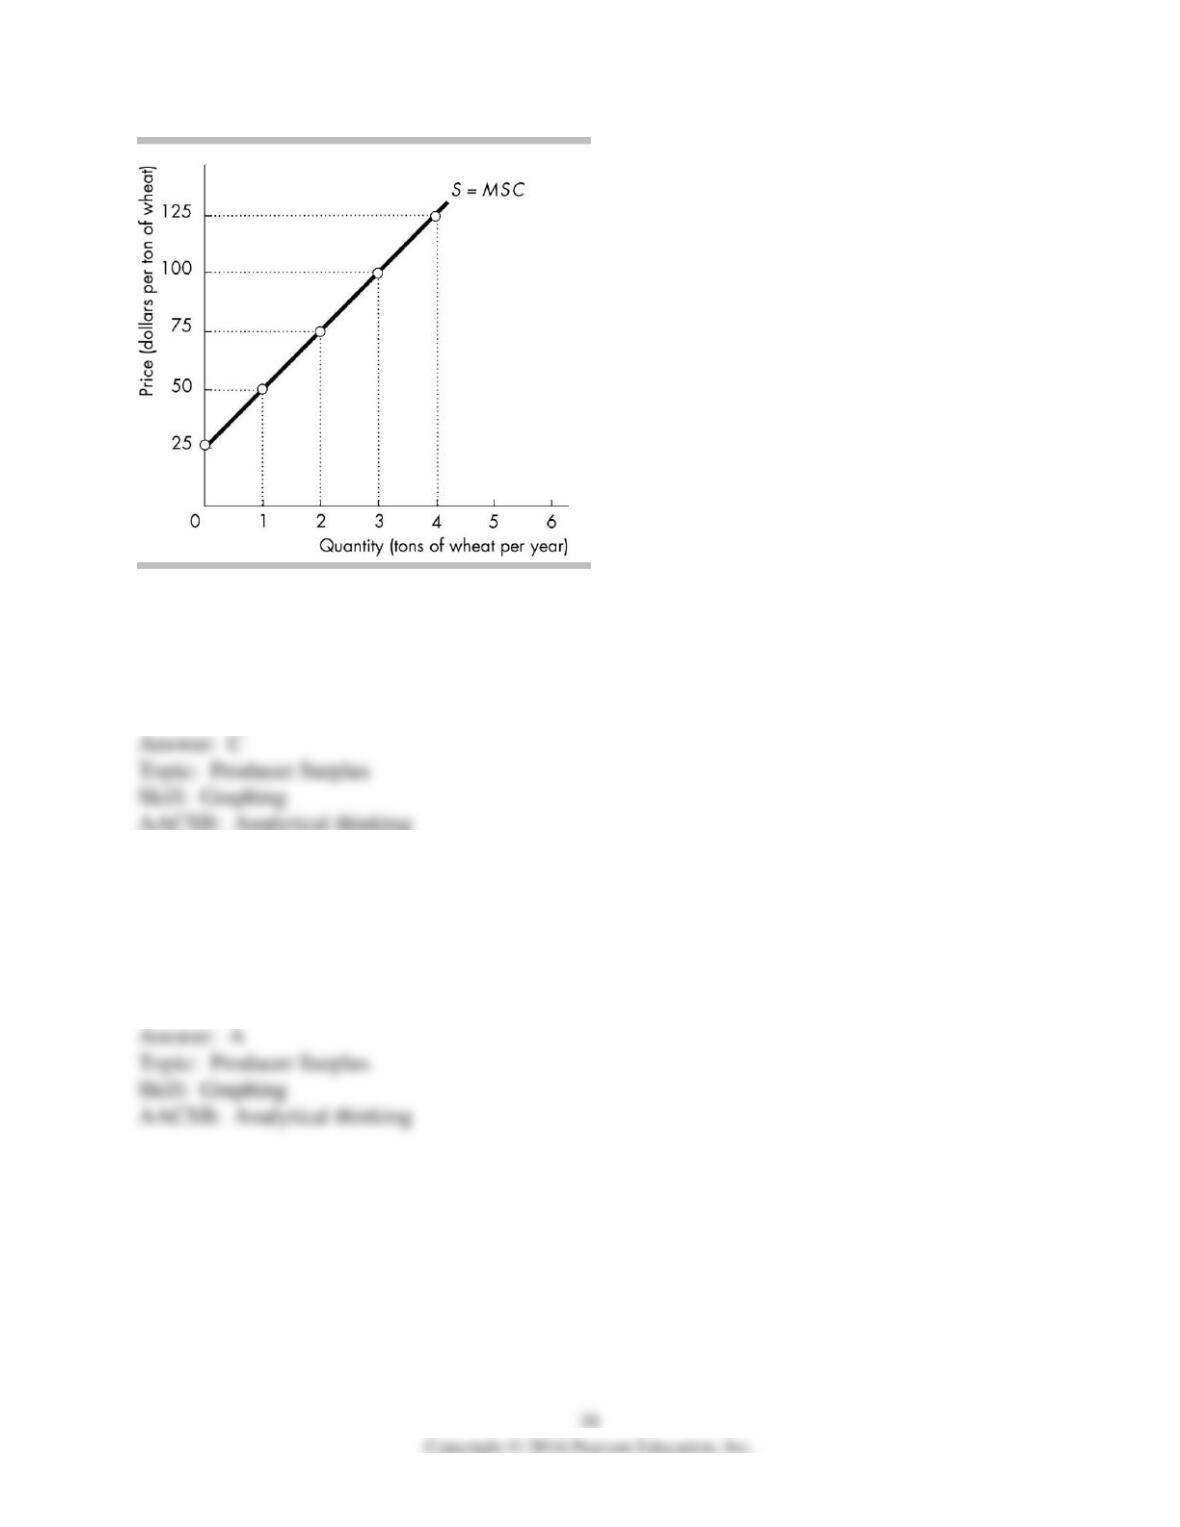
94) In the above figure, the lowest price for which the firm will sell its second ton of wheat is
A) $25.
B) $50.
C) $75.
D) $100.
95) In the above figure, if the market price is $100 per ton, then the firm’s producer surplus on
the second ton of wheat is
A) $25.
B) $50.
C) $75.
D) $100.
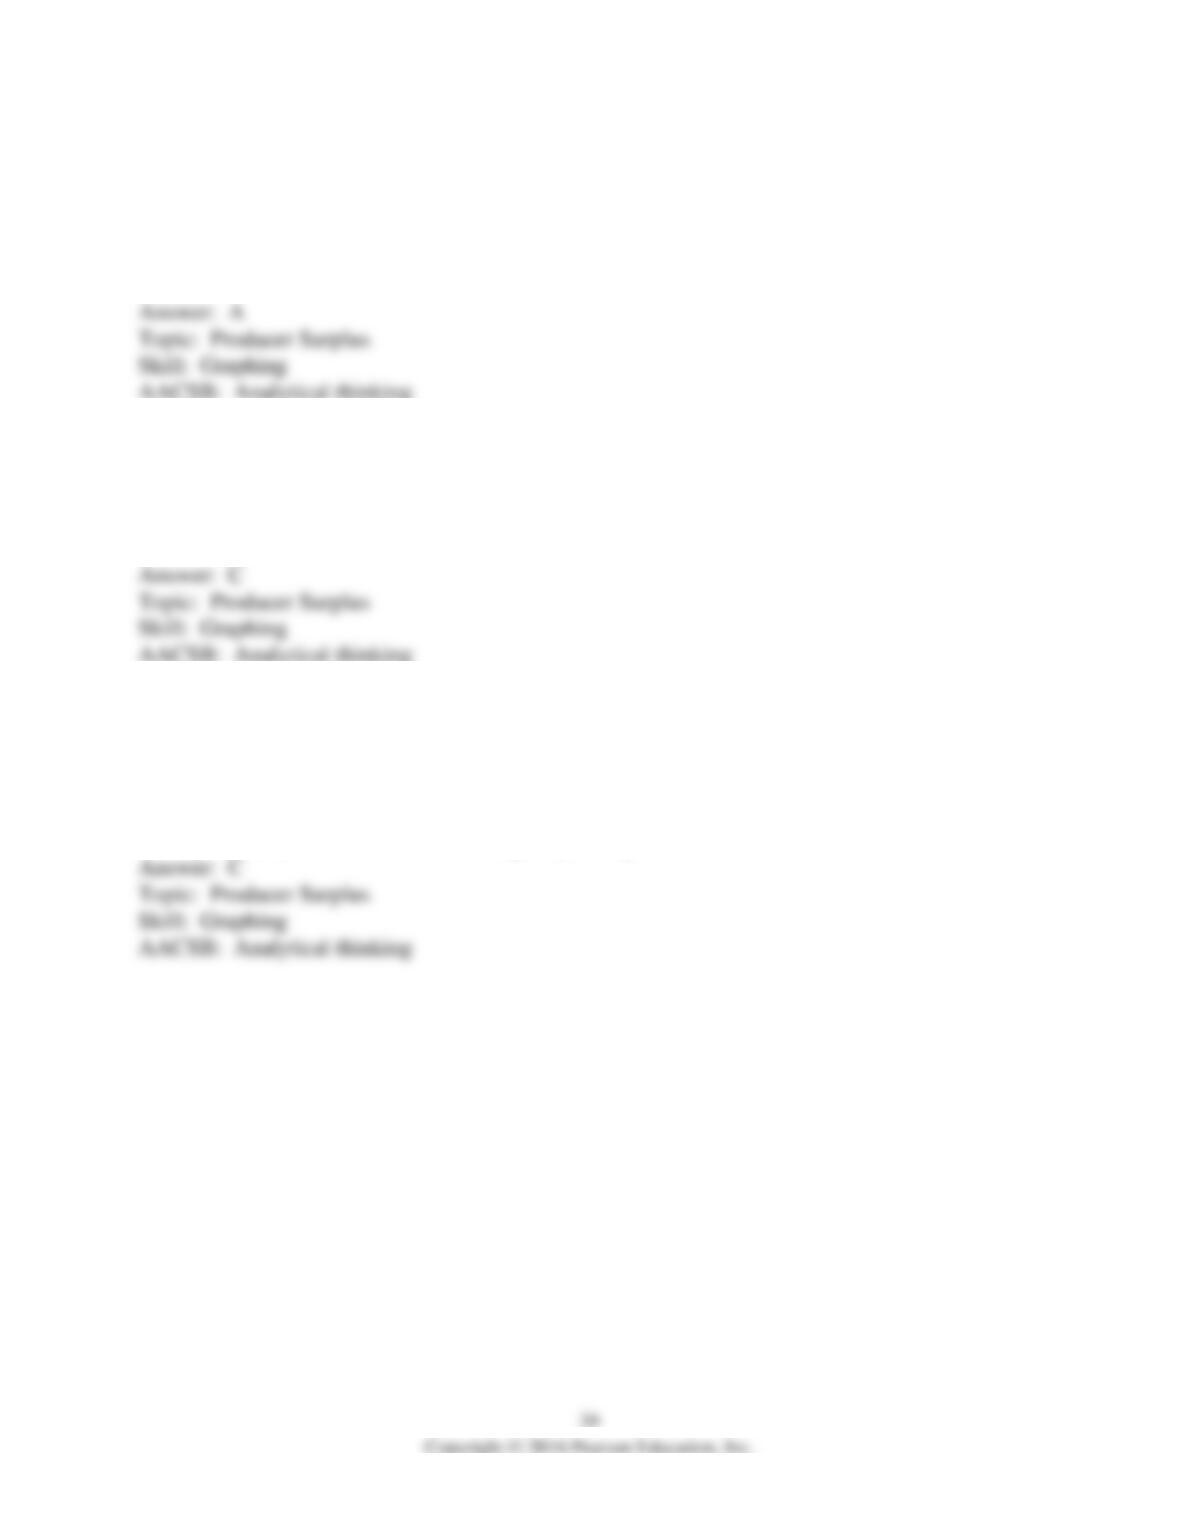
96) In the above figure, the second ton of wheat would be produced even though the producer
surplus on it is zero if the price per ton of wheat was
A) $25.
B) $50.
C) $75.
D) $100.
97) In the above figure, the marginal cost of the second ton of wheat is
A) $25.
B) $50.
C) $75.
D) none of the above
98) In the above figure, if the market price rises from $100 to $125 per ton of wheat, then
producer surplus
A) decreases.
B) does not change.
C) increases.
D) might increase, decrease, or not change depending on how the demand curve for wheat shifts.
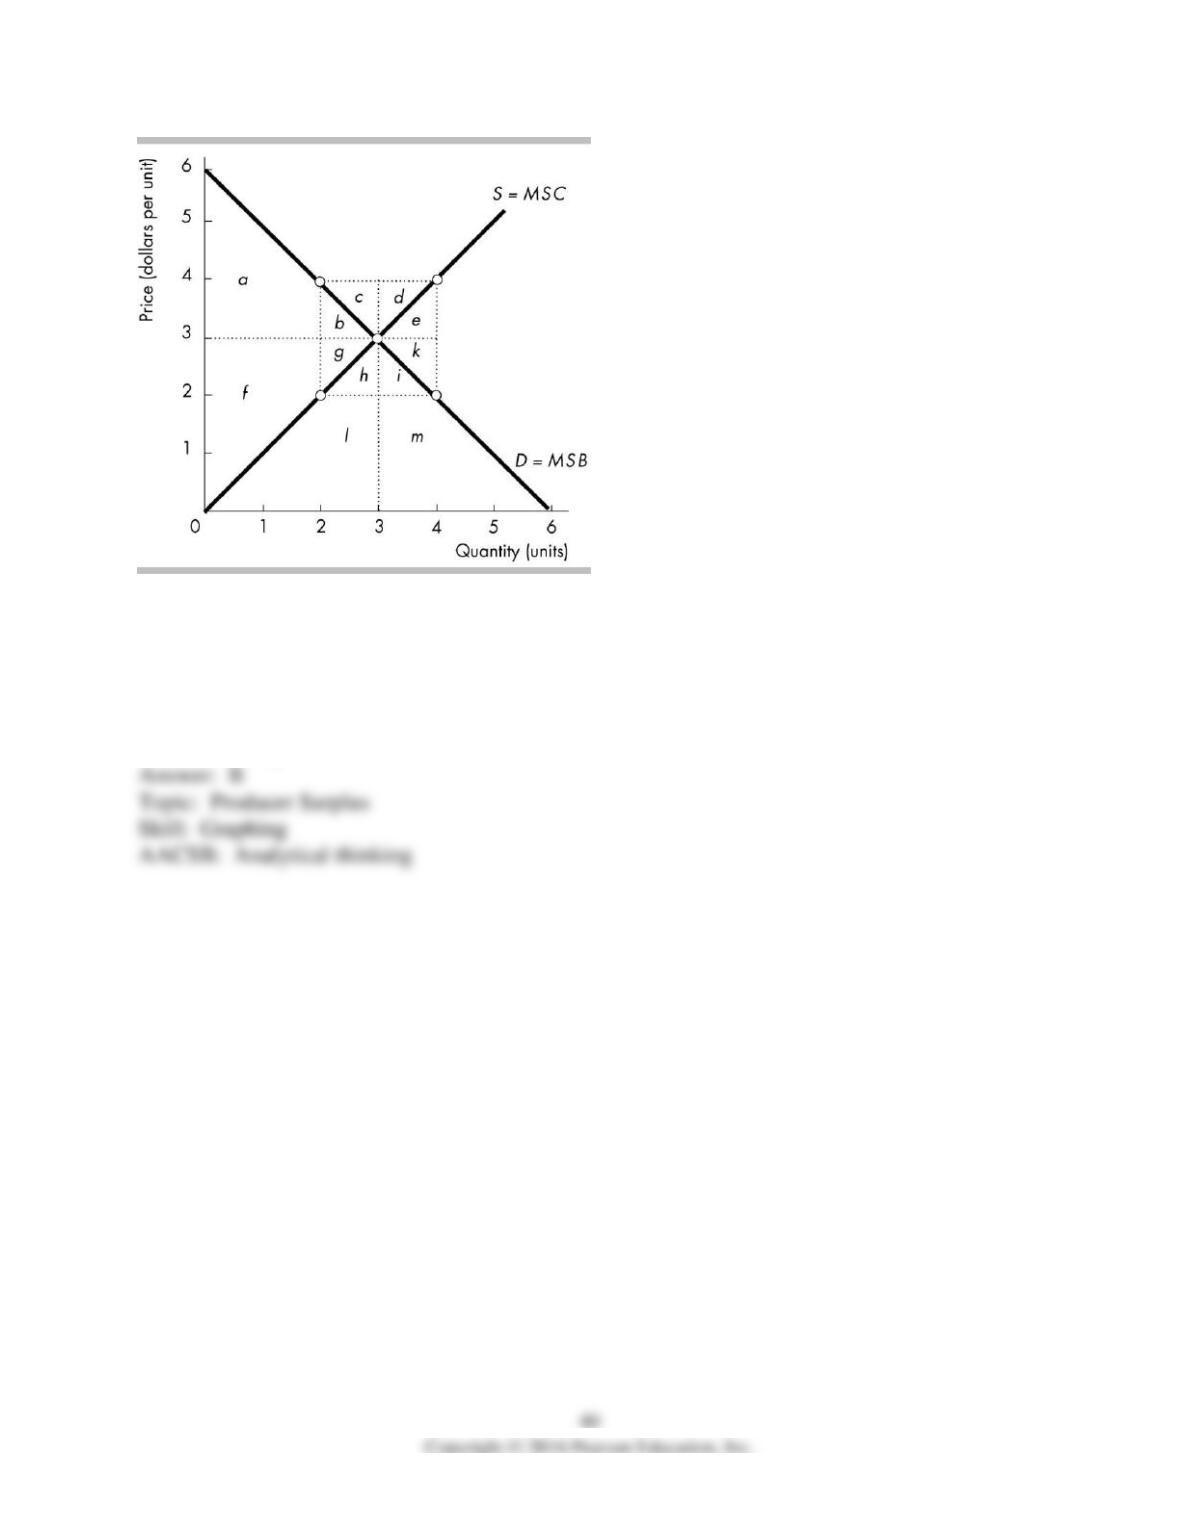
99) In the figure above, when production is 3 units with a price of $3, the producer surplus in this
market equals
A) b + g.
B) f + g.
C) a + b + f + g.
D) a + b + f + g + h + i.