Microeconomics, 12e (Parkin)
Chapter 6 Government Actions in Markets
1 A Housing Market with a Rent Ceiling
1) A price ceiling is a price
A) below which a seller cannot legally sell.
B) above which a seller cannot legally sell.
C) that creates a surplus of the good.
D) Both answers A and C are correct.
2) A price ceiling ________.
A) makes it illegal to charge a higher price than the specified price
B) is more effective when it is higher
C) is necessary to maintain market equilibrium
D) occurs in housing markets only
3) A price ________ is a regulated ________ that must be set below the equilibrium price to
have an effect.
A) floor; price
B) floor; quantity
C) ceiling; price
D) ceiling; quantity
4) In order to have an effect, a price ceiling must be set ________.
A) above the equilibrium price
B) equal to the equilibrium price
C) below the equilibrium price
D) by suppliers
5) A rent ceiling below the equilibrium rent will create
A) a more efficient allocation of housing.
B) a larger number of apartments rented.
C) no change in the number of apartments rented.
D) increased search time and black markets.
6) A rent ceiling
A) increases the quantity of rental units supplied.
B) cannot change the market price.
C) set above equilibrium price has no effect.
D) generally aims at insuring that landlords receive a higher rent than would otherwise be the
case.
7) A rent ceiling set above the equilibrium rent
A) decreases the quantity demanded but not the quantity supplied.
B) decreases the quantity supplied but not the quantity demanded.
C) decreases both the quantity demanded and the quantity supplied.
D) has no effect on the market outcome.
8) A price ceiling, such as a rent ceiling
A) always results in a surplus.
B) always results in a shortage.
C) results in a surplus if the ceiling price is less than the equilibrium price.
D) results in a shortage if the ceiling price is less than the equilibrium price.
9) Which of the following is an effect of a price ceiling set below the equilibrium price?
A) Less of the good is produced with the ceiling than would be produced without the ceiling.
B) The price ceiling has no effect on the market equilibrium.
C) Consumers can buy more than they can at the equilibrium price because the ceiling price is
lower.
D) None of the above answers is correct.
10) Suppose the government imposes a price ceiling on gasoline that is less than the equilibrium
price. As a result
A) the price of gasoline rises to the equilibrium price.
B) there is incentive for buyers to undertake search activity.
C) the supply of gasoline will increase and the supply curve will shift rightward.
D) the demand for gasoline will decrease and the demand curve will shift leftward.
11) Which of the following is NOT a potential impact of a rent ceiling set below the equilibrium
rent?
A) a surplus
B) an increase in search
C) a deadweight loss
D) None of the above because they are all impacts of a rent ceiling set below the equilibrium
rent.
12) A price ceiling can result in which of the following?
A) inefficiency
B) black markets
C) increased search activities
D) All of the above answers are correct.
13) Sherry wants to rent an apartment. Although rents are below what she is willing to pay, she
cannot find an apartment. Then after a month of searching, she finds an apartment but she has to
pay an additional $1,000 to have the locks changed. Sherry has just experienced the effects of
________.
A) a rent floor with a black market
B) inelastic demand
C) a market working efficiently
D) a rent ceiling
14) Price ceilings, such as rent ceilings, set below the equilibrium price
A) increase producer surplus.
B) decrease producer surplus.
C) do not affect producer surplus.
D) might increase or decrease producer surplus.
15) Which of the following is an economic policy that promotes the efficient quantity of
apartments?
A) a rent floor above the equilibrium rent
B) a rent ceiling below the equilibrium rent
C) a sales tax imposed on renting an apartment
D) none of the above
16) A rent ceiling results in a shortage. As a result, which of the following do you expect?
A) The shortage will persist as long as the ceiling is in effect.
B) Discrimination as landlords choose their tenants, possibly based on race, age, or gender.
C) A black market for apartments whereby higher rents are obtained through various other
charges.
D) All of the above would be expected.
17) A price ceiling set below the equilibrium price ________ search activity and ________ the
use of black markets.
A) increases; increases
B) increases; decreases
C) decreases; increases
D) decreases; decreases
18) The opportunity cost of buying a good includes
I. the price of the good.
II. the value of time spent searching for the good.
A) only I
B) only II
C) both I and II
D) neither I nor II
19) When a rent ceiling is imposed in a housing market, the opportunity cost of housing equals
the
A) rent.
B) market equilibrium rent that would prevail in the absence of a rent ceiling.
C) value of the time and resources spent searching plus the rent.
D) consumer surplus.
20) Search activity ________.
A) occurs when there is a surplus of the good
B) is unnecessary when a black market exists
C) increases when an effective price ceiling is set on a good
D) decreases when an effective price ceiling is set on a good
21) A rent ceiling set below the equilibrium rent will
A) increase search activity.
B) decrease search activity.
C) have no effect on search activity.
D) shift the housing supply curve rightward.
22) One consequence of rent ceilings set below the equilibrium rent is that
A) a surplus of housing units develops.
B) renters are no longer exploited by landlords.
C) it makes the long-run housing supply more elastic.
D) search costs for housing increase.
23) With rent controls, which of the following is most likely to occur?
A) decreased search activity
B) black market activity
C) a building boom
D) a housing surplus
24) ________ is an illegal activity between buyers and sellers sometimes used to evade a price
ceiling.
A) Increased search activity
B) A price floor
C) Creating a shortage
D) A black market
25) A rent ceiling results in a shortage. As a result, which of the following do you expect?
A) a shortage of applicants for the apartments available
B) discrimination as tenants choose their landlords, possibly based on race, age, or gender
C) a black market for apartments whereby higher rents are obtained through various other
charges
D) in the long-run, more and more people will want to become landlords
26) With rent controls set below the equilibrium rent, what mechanism might arise that moves
the market closer to the efficient equilibrium?
A) decreased search costs
B) black market activity
C) increased advertising by landlords
D) more favorable leases offered to tenants
27) One common effect of rent ceilings in big cities is
A) that landlords build more apartments.
B) that landlords charge “key money,” high payments charged to new tenants for new locks and
keys.
C) to equalize the quantity of apartments demanded and the quantity supplied in neighborhoods.
D) to reduce the search activity by those seeking shelter.
28) The stricter the enforcement of a price ceiling, the
A) smaller is the difference between the black market price and the legal market price of the
good.
B) larger is the difference between the black market price and the legal market price of the good.
C) greater is the amount of the good available in total, from either the legal market or the black
market.
D) Both answers B and C are correct.
29) Which of the following is a result of a rent ceiling set below the equilibrium rent?
I. equity in the housing market
II. efficient allocation of resources
III. a shortage of housing units.
A) I and II
B) I and III
C) II only
D) III only
30) A rent ceiling creates a shortage. As a result, which of the following occurs?
A) only a loss of consumer surplus for tenants
B) only a loss of producer surplus for landlords
C) a loss of both consumer and producer surplus
D) a gain of both consumer and producer surplus
31) A rent ceiling creates a shortage. As a result, there is
A) an efficient allocation of housing.
B) a surplus of housing.
C) an increase in the producer surplus in the housing market.
D) a decrease in the producer surplus in the housing market.
32) A rent ceiling results in a shortage of apartments. As a result, there is
A) only a loss of consumer surplus for tenants.
B) only a loss of producer surplus for landlords.
C) a loss of both consumer and producer surplus.
D) a gain of both consumer and producer surplus.
33) Assume that your state government has placed a price ceiling of $.20 per kilowatt hour on
electricity. The equilibrium price per kilowatt hour for electricity is $.25. The government’s
action will result in
A) a surplus of electricity in the electricity market.
B) an increase in the price of electricity to $.25 per kilowatt hour.
C) an increase in producer surplus.
D) a deadweight loss.
In the recent years, prices of basic food commodities such as corn, rice, and wheat have
increased sharply. An article in the Wall Street Journal stated that Chinese authorities were
concerned that escalating prices would cause inflation and be followed by civil unrest. (Source:
Wall Street Journal, February 20, 2011)
34) Suppose the Chinese government regulates the price of food and forbids firms from setting a
higher price. In this case the government is setting a
A) price floor.
B) price ceiling.
C) quota.
D) tax.
35) If the Chinese government sets a price ceiling below the equilibrium price, the result will be
I. an increase in the quantity demanded.
II. a decrease in the quantity supplied.
III. a shortage.
A) I only
B) I and II only
C) III only
D) I, II, and III
36) If the Chinese government sets a price ceiling below the equilibrium price, the result will be
to
A) increase total surplus.
B) create deadweight loss.
C) increase surplus and create deadweight loss.
D) eliminate deadweight loss.
Rent
(dollars per
month)
Quantity of
apartments
supplied
(per month)
Quantity of
apartments
demanded
(per month)
200
20
100
300
40
80
400
60
60
500
80
40
600
100
20
37) The above table gives the demand schedule and the supply schedule for housing in Anytown,
U.S.A. If a rent ceiling of $300 is imposed in the housing market, then
A) there would be a surplus of apartments.
B) there would be a shortage of apartments.
C) the market would reach equilibrium at the quantity of 60 housing units.
D) the supply of housing would increase.
38) The above table gives the demand schedule and the supply schedule for housing in Anytown,
U.S.A. If a rent ceiling of $600 was imposed in the housing market, then
A) there would be a surplus of apartments.
B) there would be a shortage of apartments.
C) the market would reach equilibrium at the quantity of 60 housing units.
D) the supply of housing would increase.
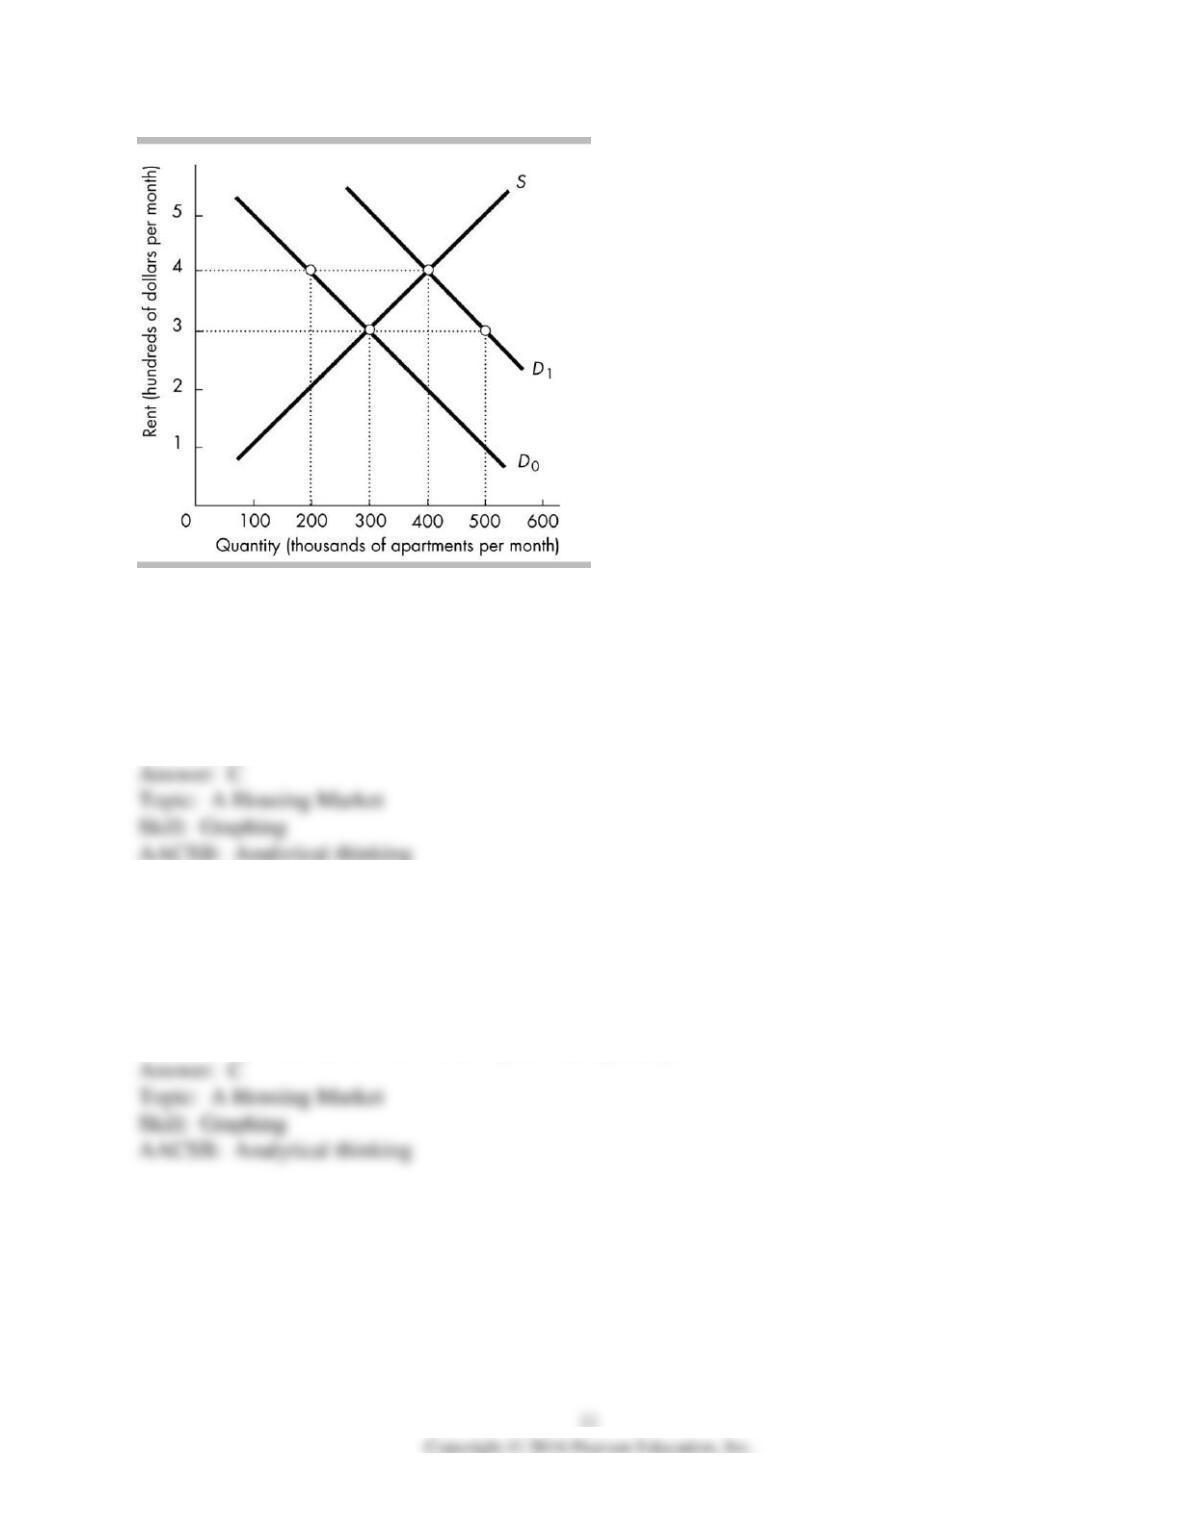
39) In the figure above, the initial demand curve is D0. There are no rent ceilings nor rent floors.
The equilibrium monthly rent is
A) $100 per month.
B) $200 per month.
C) $300 per month.
D) $400 per month.
40) In the figure above, the demand curve shifts rightward from D0 to D1. There are no rent
controls. In the short run, the increase in demand results in
A) higher rents and a decrease in the equilibrium quantity.
B) lower rents and a decrease in the equilibrium quantity.
C) higher rents and an increase in the equilibrium quantity.
D) lower rents and an increase in the equilibrium quantity.
41) In the figure above, the demand curve shifts rightward from D0 to D1 so that D1 is the
relevant demand curve. Suppose the government imposes a rent ceiling of $300 per month. In the
short run there will be
A) a shortage of 500,000 apartments.
B) a shortage of 400,000 apartments.
C) a shortage of 200,000 apartments.
D) no shortage nor a surplus of apartments.
42) In the figure above, the demand curve shifts rightward from D0 to D1 so that D1 is the
relevant demand curve. Suppose the government imposes a rent ceiling of $300 per month. In the
short run there will be
A) a deadweight loss created.
B) a reduction in renters’ search activities.
C) an elimination of a black market.
D) an increased number apartments rented.
43) In the figure above, the demand curve shifts rightward from D0 to D1 so that D1 is the
relevant demand curve. Suppose the government imposes a rent ceiling of $300 per month. In the
short run there will be
A) a shortage and an increase in search costs.
B) a shortage and a decrease in search costs.
C) a surplus and an increase in search costs.
D) a surplus and a decrease in search costs.
44) In the figure above, the demand curve shifts rightward from D0 to D1 so that D1 is the
relevant demand curve. Suppose the government imposes a rent ceiling of $500 per month. In the
short run there will be
A) a surplus of apartments.
B) a shortage of 200,000 apartments.
C) a shortage of 300,000 apartments.
D) neither a shortage nor a surplus of apartments.
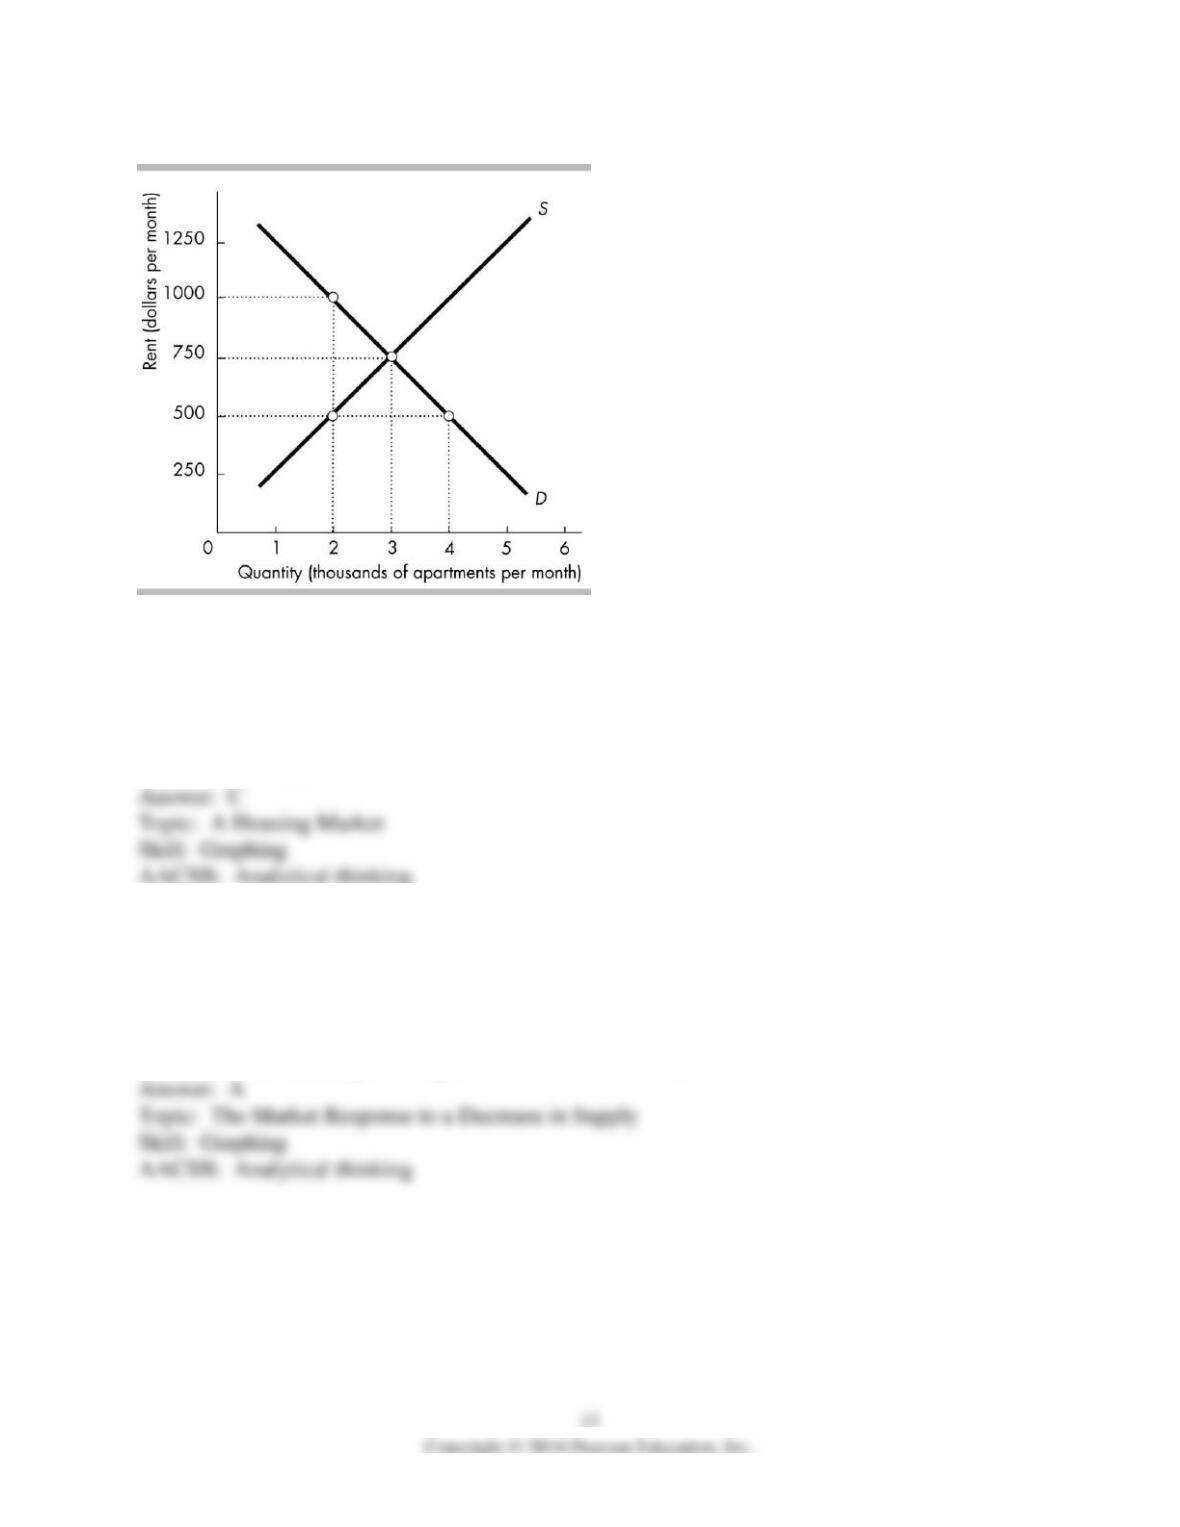
45) The above figure shows the apartment rental market in Bigtown. At what rent will there be
neither a shortage nor a surplus of apartments?
A) $1250 per month
B) $1000 per month
C) $750 per month
D) $500 per month
46) The above figure shows the apartment rental market in Bigtown. If severe flooding resulted
in the destruction of many of the city’s apartment buildings, then the
A) supply curve of apartments would shift leftward and rent would rise above $750.00.
B) demand curve for apartments would shift rightward and rent would rise above $750.00.
C) equilibrium quantity of apartments rented would increase beyond 3,000.
D) equilibrium market price of apartments rented would fall below $750.00.
47) The above figure shows the apartment rental market in Bigtown. If the Bigtown Housing
Authority imposes a rent ceiling of $500 per month, the rent ceiling will help
A) all renters.
B) some renters and hurt other renters.
C) all landlords.
D) some landlords and hurt other landlords.
48) The above figure shows the apartment rental market in Bigtown. If the Bigtown Housing
Authority imposes a rent ceiling of $1,000 per month, the ceiling will
A) help all renters.
B) help some renters and hurt other renters.
C) help all landlords.
D) have no effect at all on the Bigtown rental market.
49) The above figure shows the apartment rental market in Bigtown. If there is a shortage of
200,000 apartments in the Bigtown rental market, it might be because the Bigtown Housing
Authority has imposed a rent
A) ceiling of $750.00 monthly.
B) ceiling of $500.00 monthly.
C) floor of $750.00 monthly.
D) floor of $500.00 monthly.
50) The above figure shows the apartment rental market in Bigtown. If the market is in
equilibrium and then the Bigtown Housing Authority imposes a rent ceiling of $500 per
apartment, which of the following would occur?
A) a decrease in the search time and expense of finding an apartment
B) an increase in the search time and expense of finding an apartment
C) an increase in producer surplus but a decrease in consumer surplus
D) an increase in efficiency
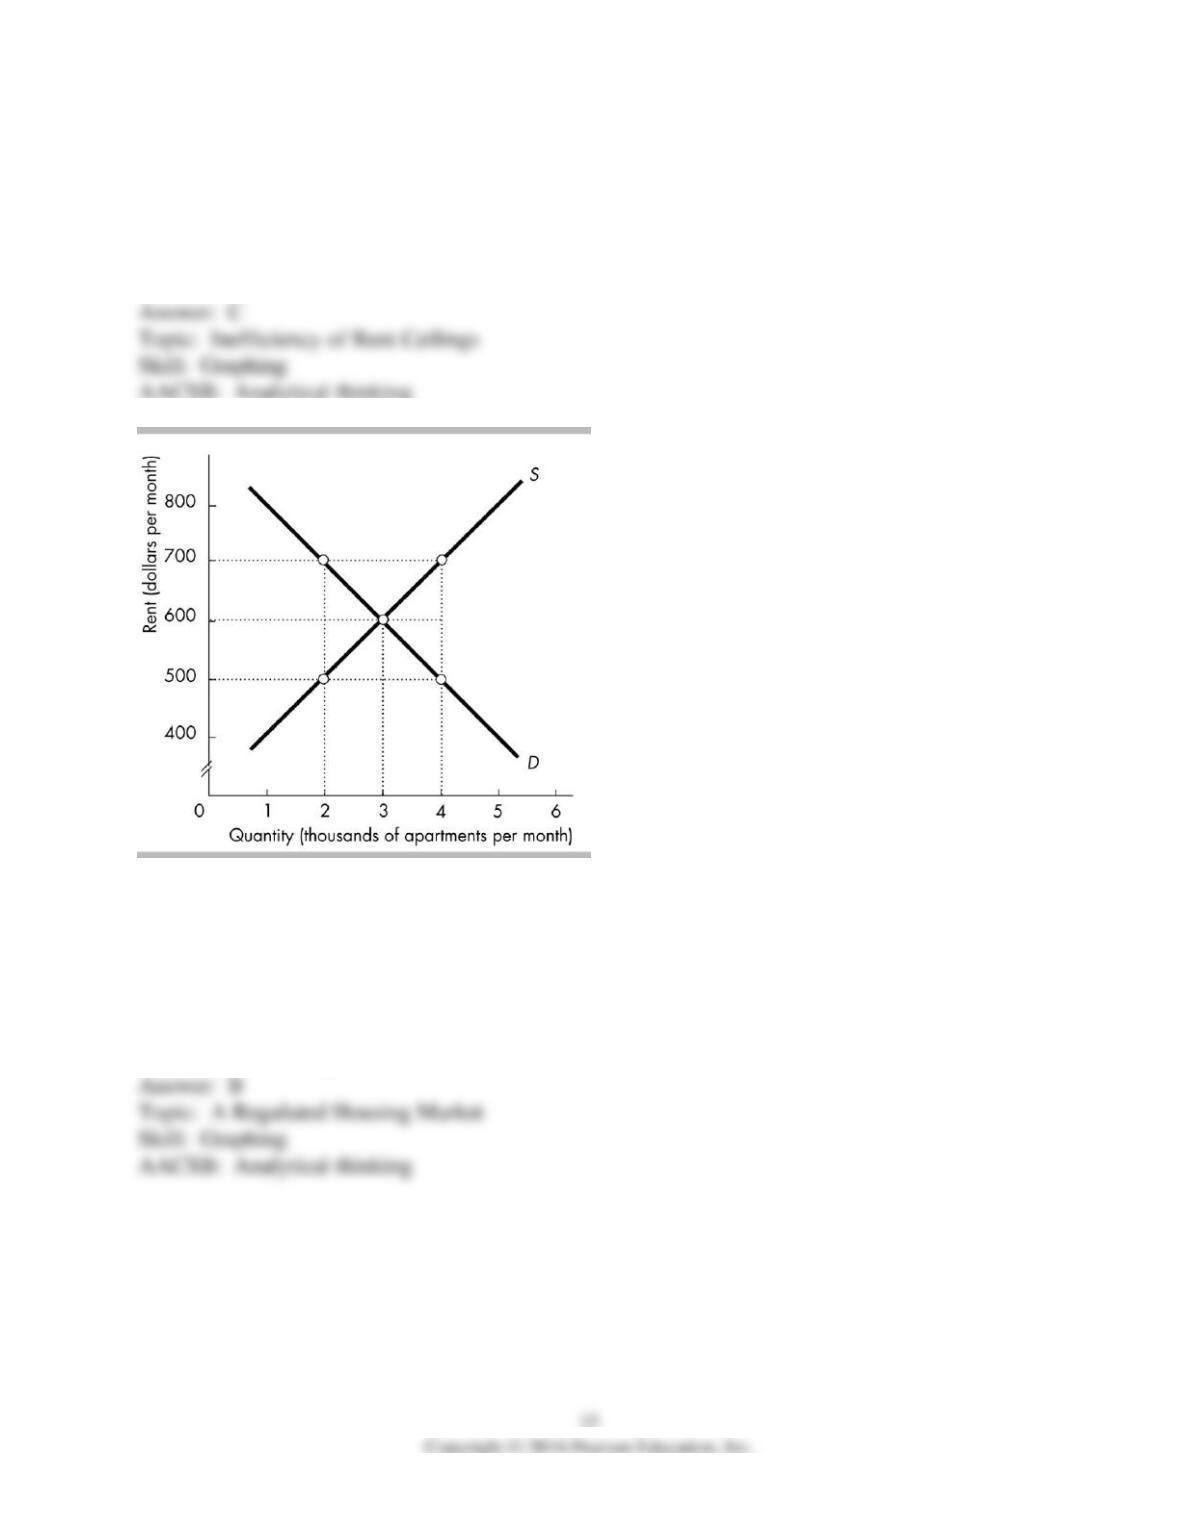
51) The above figure shows the apartment rental market in Bigtown. If the Bigtown Housing
Authority imposes a rent ceiling of $500 per apartment, the deadweight loss will be
A) $1,000,000.
B) $500,000.
C) $250,000.
D) $125,000.
52) In the figure above, originally the apartment rental market is in short-run and long-run
equilibrium with a rent of $600 per month. Then the government imposes a rent ceiling of $500
per month. The rent ceiling leads to a
A) shortage of 1000 apartments.
B) shortage of 2000 apartments.
C) surplus of 1000 apartments.
D) surplus of 2000 apartments.
53) In the figure above, originally the apartment rental market is in short-run and long-run
equilibrium with a rent of $600 per month. Then the government imposes a rent ceiling of $500
per month, which causes a shortage. Suppose that apartments are a normal good and incomes
rise. The increase in income
A) decreases the shortage.
B) has no effect on the shortage.
C) increases the shortage.
D) raises the rent.
54) In the figure above, originally the apartment rental market is in short-run and long-run
equilibrium with a rent of $600 per month. Then the government imposes a rent ceiling of $500
per month, which causes a shortage. Suppose that apartments are an inferior good and incomes
rise. The increase in income
A) decreases the shortage.
B) has no effect on the shortage.
C) increases the shortage.
D) raises the rent.
55) In the figure above, originally the apartment rental market is in short-run and long-run
equilibrium with a rent of $600 per month. Then the government imposes a rent ceiling of $500
per month. Now suppose that demand increases. The increase in demand results in the quantity
supplied
A) increasing.
B) staying the same.
C) decreasing.
D) increasing, staying the same, or decreasing depending on how much demand increases.
56) In the figure above, originally the apartment rental market is in short-run and long-run
equilibrium with a rent of $600 per month. Then the government imposes a rent ceiling of $500
per month. If the law is strictly enforced, the maximum for which an apartment will rent on the
black market is
A) less than $600 per month.
B) $600 per month.
C) $700 per month.
D) more than $700 per month.
57) In the figure above, originally the apartment rental market is in short-run and long-run
equilibrium with a rent of $600 per month. Then the government imposes a rent ceiling of $500
per month. The loss of producer surplus as a result of the price ceiling is
A) $50,000 per month.
B) $250,000 per month.
C) $500,000 per month.
D) more than $500,000 per month.
58) In the figure above, originally the apartment rental market is in short-run and long-run
equilibrium with a rent of $600 per month. Then the government imposes a rent ceiling of $500
per month. The loss of producer surplus
A) is smaller than the gain in consumer surplus.
B) is larger than the gain in consumer surplus.
C) is the same size as the gain in consumer surplus.
D) could be smaller than, larger than, or the same size as the gain in consumer surplus.
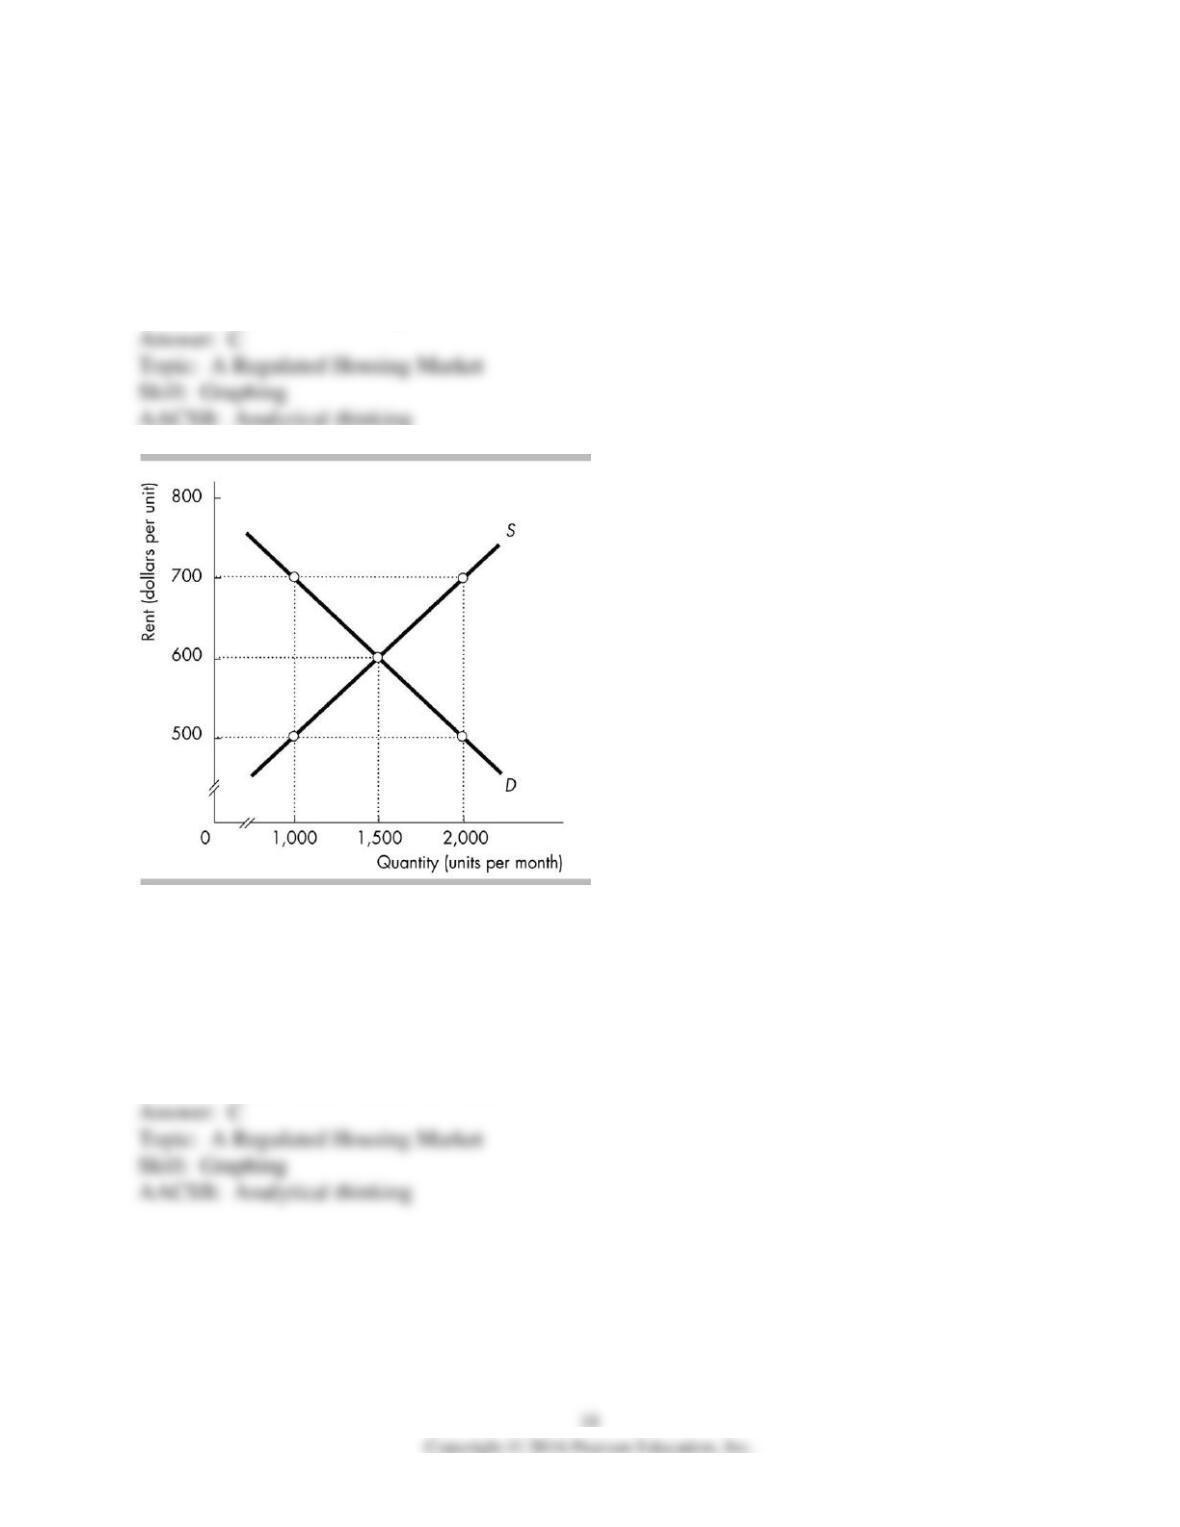
59) In the figure above, originally the apartment rental market is in short-run and long-run
equilibrium with a rent of $600 per month. Then the government imposes a rent ceiling of $500
per month. The deadweight loss is borne by
A) the producers only.
B) the consumers only.
C) all producers and some consumers.
D) all consumers and some producers.
60) The figure shows the market for rental units in Gladstone. The market is in equilibrium. The
government now introduces a rent ceiling of $500 a month. The price of a rental unit ________
and the number of units rented ________.
A) increases by $500 per month; decreases
B) increases by $100 per month; increases
C) decreases by $100 per month; decreases
D) remains the same; remains the same
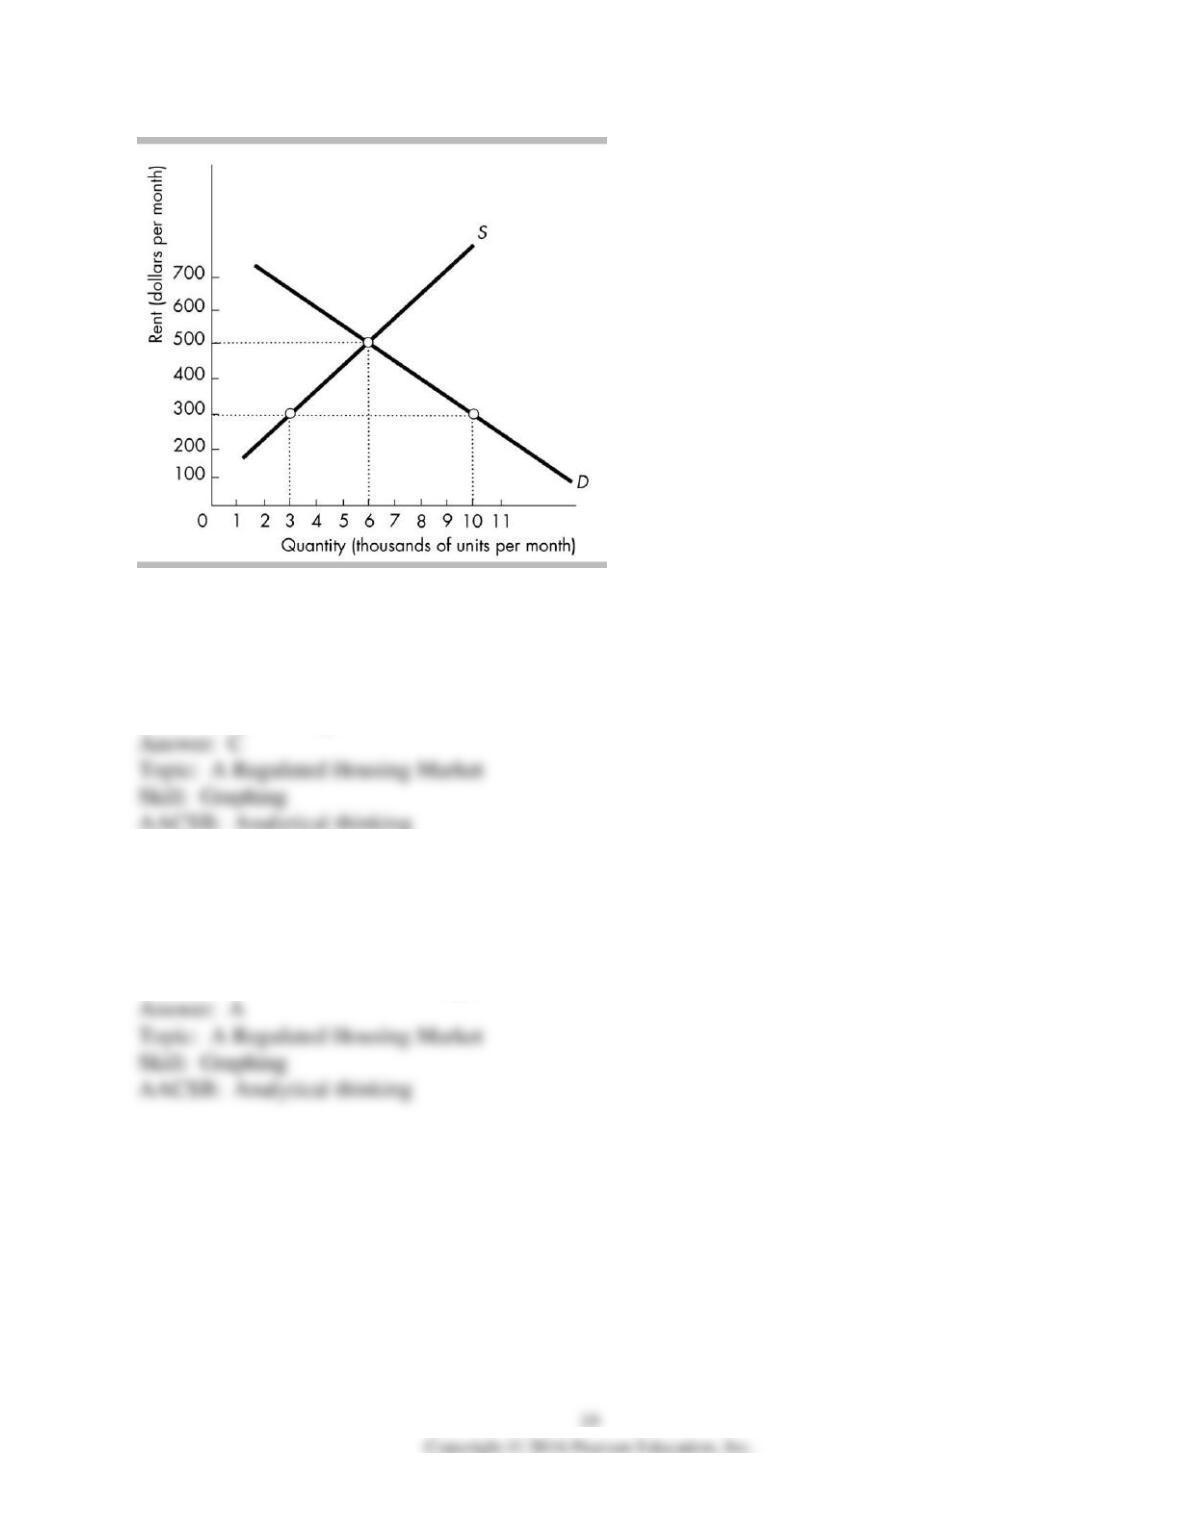
61) In the above figure, a rent ceiling of $300 per month would
A) not affect the equilibrium quantity.
B) result in a surplus of 7000 units.
C) result in a shortage of 7000 units.
D) result in a shortage of 2000 units.
62) In the above figure, a rent ceiling of $500 per month would
A) not affect the equilibrium quantity.
B) create a shortage.
C) raise the rent and cause a surplus.
D) reduce the rent and create a surplus.
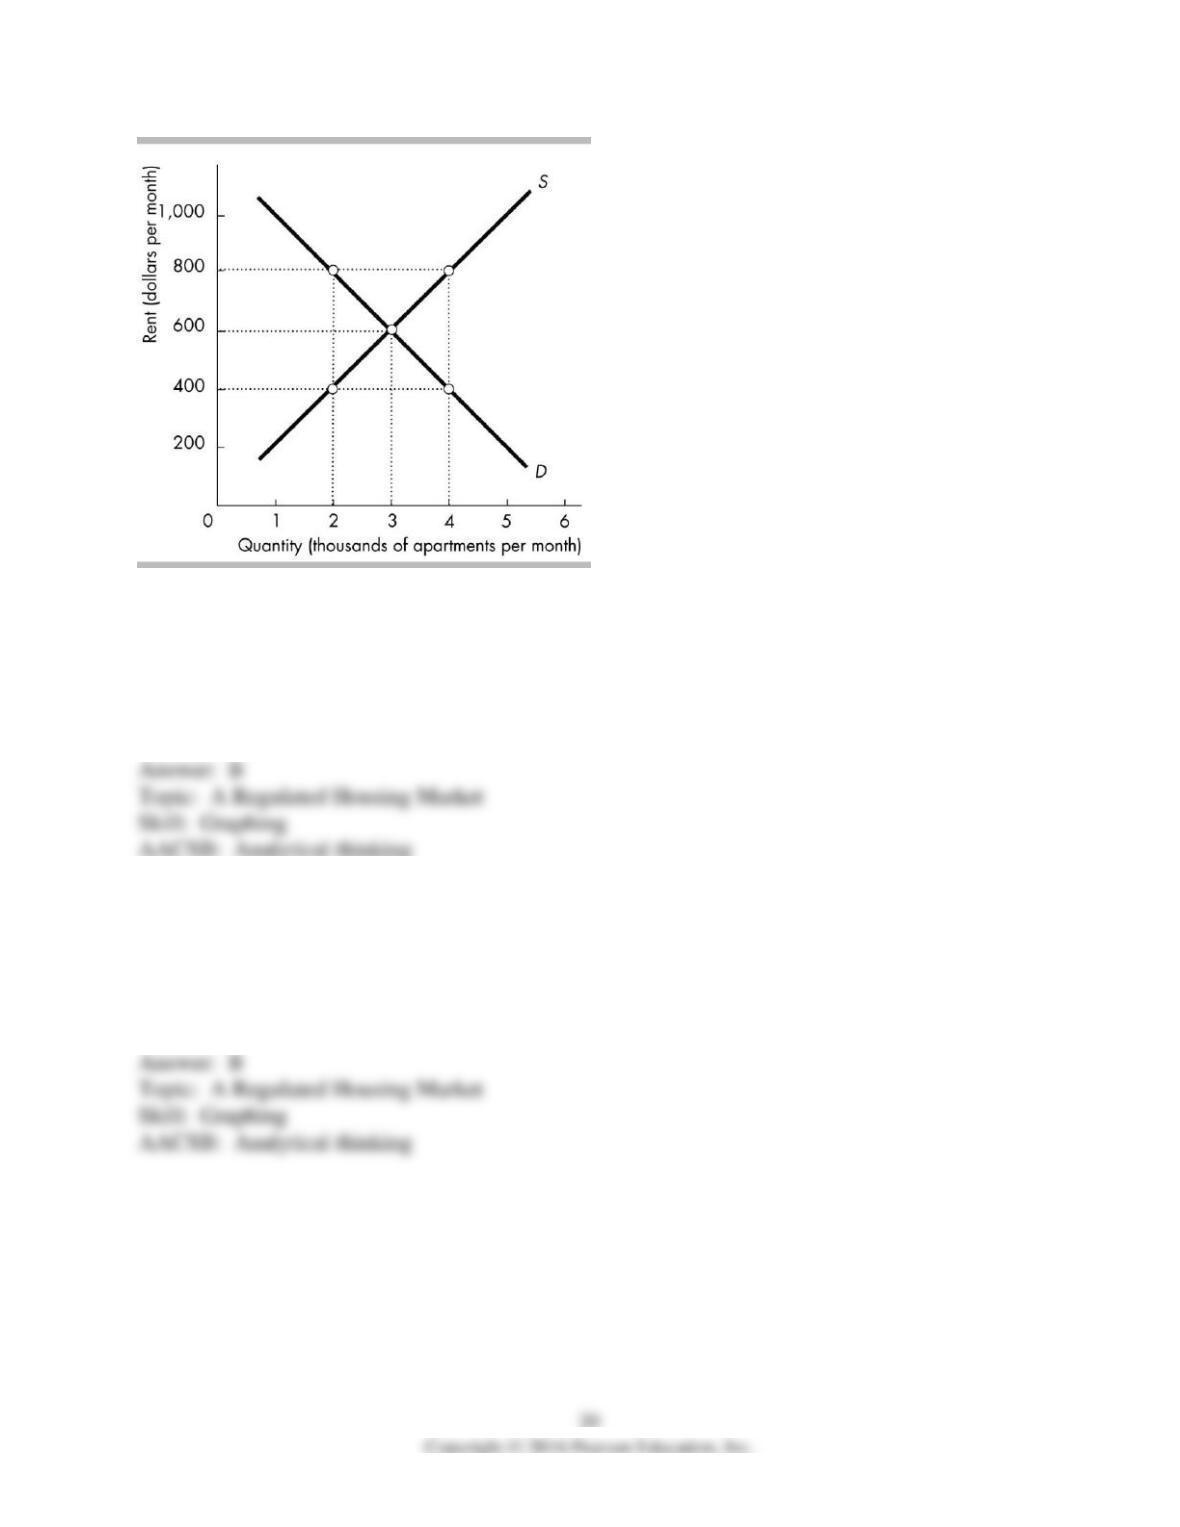
63) The figure above shows the demand for and supply of rental housing in Smallton. If a rent
ceiling is set at $800, how many apartment units are rented?
A) 2,000
B) 3,000
C) 4,000
D) None of the above answers is correct.
64) The figure above shows the demand for and supply of rental housing in Smallton. If a rent
ceiling is set at $800, what is the rent?
A) $800
B) $600
C) $400
D) None of the above answers is correct.