Archives
Economics Chapter 1 One The Primary Advantages Using Econometrics Over
Answer: B Answer: B Answer: A Copyright © 2015 Pearson Education, Inc. 1 Answer: D Introduction to Econometrics, 3e (Stock) Chapter 1 Economic Questions and Data 1.1 Multiple Choice 1) Analyzing the behavior of unemployment rates across U.S. states in […]
Economics Chapter 10 A researcher investigating the determinants of crime
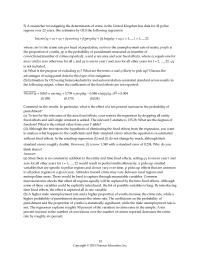
Copyright © 2015 Pearson Education, Inc. 5) A researcher investigating the determinants of crime in the United Kingdom has data for 42 police regions over 22 years. She estimates by OLS the following regression ln(cmrt)it = αi + φt + […]
Economics Chapter 10 if you use the heteroskedasticity-robust option
Copyright © 2015 Pearson Education, Inc. Introduction to Econometrics, 3e (Stock) Chapter 10 Regression with Panel Data 10.1 Multiple Choice 1) The notation for panel data is (Xit, Yit), i = 1, …, n and t = 1, …, T […]
Economics Chapter 11 In that case you would have to hold the other
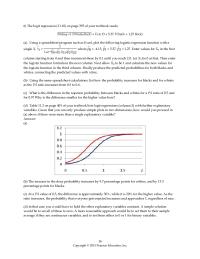
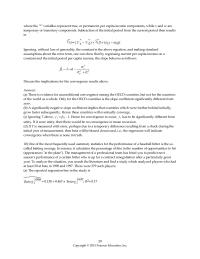
Copyright © 2015 Pearson Education, Inc. 6) The logit regression (11.10) on page 393 of your textbook reads: = F(–4.13 + 5.37 P/Iratio + 1.27 black) (a) Using a spreadsheet program such as Excel, plot the following logistic regression function […]
Economics Chapter 11 What is Your Prediction For Some Oring Thermal
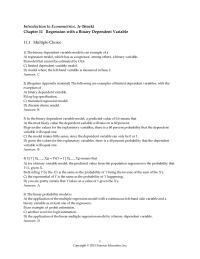
Copyright © 2015 Pearson Education, Inc. Introduction to Econometrics, 3e (Stock) Chapter 11 Regression with a Binary Dependent Variable 11.1 Multiple Choice 1) The binary dependent variable model is an example of a A) regression model, which has as a […]
Economics Chapter 12 If the minimum wage does not change between the two
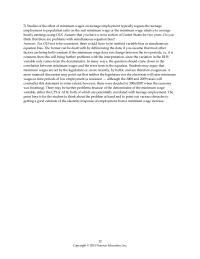
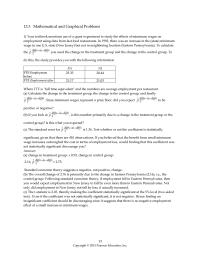
Copyright © 2015 Pearson Education, Inc. 7) Studies of the effect of minimum wages on teenage employment typically regress the teenage employment to population ratio on the real minimum wage or the minimum wage relative to average hourly earnings using […]
Economics Chapter 12 The IV regression assumptions include all of the
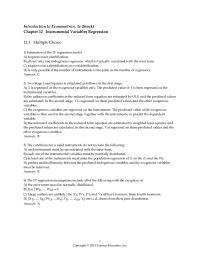
Copyright © 2015 Pearson Education, Inc. Introduction to Econometrics, 3e (Stock) Chapter 12 Instrumental Variables Regression 12.1 Multiple Choice 1) Estimation of the IV regression model A) requires exact identification. B) allows only one endogenous regressor, which is typically correlated […]
Economics Chapter 13 The Answer Should Emphasize The Initial Random
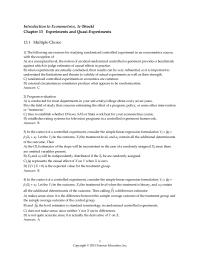
1 Introduction to Econometrics, 3e (Stock) Chapter 13 Experiments and Quasi–Experiments 13.1 Multiple Choice 1) The following are reasons for studying randomized controlled experiment in an econometrics course, with the exception of A) at a conceptual level, the notion of […]
Economics Chapter 13 Your textbook mentions use of a quasi
Copyright © 2015 Pearson Education, Inc. 13.3 Mathematical and Graphical Problems 1) Your textbook mentions use of a quasi–experiment to study the effects of minimum wages on employment using data from fast food restaurants. In 1992, there was an increase […]
Economics Chapter 14 Pseudo out of sample forecasting can be used
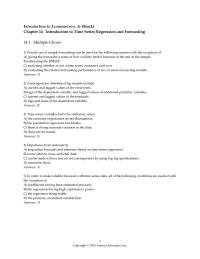
Copyright © 2015 Pearson Education, Inc. Introduction to Econometrics, 3e (Stock) Chapter 14 Introduction to Time Series Regression and Forecasting 14.1 Multiple Choice 1) Pseudo out of sample forecasting can be used for the following reasons with the exception of […]
Economics Chapter 14 There Additional Information The Second Regression
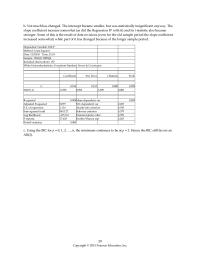
20 b. Not much has changed. The intercept became smaller, but was statistically insignificant anyway. The slope coefficient increase somewhat (as did the Regression R2 with it) and its t–statistic also became stronger. Some of this is the result of […]
Economics Chapter 15 Coefficients The Above Equation Are Then
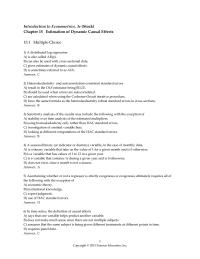
Copyright © 2015 Pearson Education, Inc. Introduction to Econometrics, 3e (Stock) Chapter 15 Estimation of Dynamic Causal Effects 15.1 Multiple Choice 1) A distributed lag regression A) is also called AR(p). B) can also be used with cross–sectional data. C) […]
Economics Chapter 15 Your textbook has pointed out that the iterated
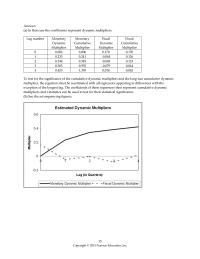
Copyright © 2015 Pearson Education, Inc. 15 Answer: (a) In that case the coefficients represent dynamic multipliers. Lag number Monetary Dynamic Multiplier Monetary Cumulative Multiplier Fiscal Dynamic Multiplier Fiscal Cumulative Multiplier 0 0.006 0.006 0.170 0.170 1 0.235 0.241 –0.044 […]
Economics Chapter 16 Canadian Data Letting the AIC Choose The Lag
Copyright © 2015 Pearson Education, Inc. 3) Purchasing power parity (PPP), postulates that the exchange rate between two countries equals the ratio of the respective price indexes or ExchRate = (where ExchRate is the foreign exchange rate between the two […]
Economics Chapter 16 you can no longer use the information criteria
Copyright © 2015 Pearson Education, Inc. Introduction to Econometrics, 3e (Stock) Chapter 16 Additional Topics in Time Series Regression 16.1 Multiple Choice 1) A vector autoregression A) is the ADL model with an AR process in the error term. B) […]
Economics Chapter 17 the numbers used to compute the estimator get
Answer: B Answer: B Copyright © 2015 Pearson Education, Inc. 1 Answer: A Introduction to Econometrics, 3e (Stock) Chapter 17 The Theory of Linear Regression with One Regressor 17.1 Multiple Choice 1) All of the following are good reasons for […]
Economics Chapter 18 Panel data estimation was introduced
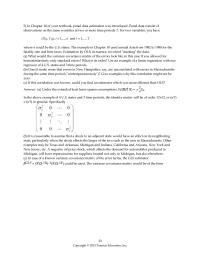
Copyright © 2015 Pearson Education, Inc. 5) In Chapter 10 of your textbook, panel data estimation was introduced. Panel data consist of observations on the same n entities at two or more time periods T. For two variables, you have […]
Economics Chapter 18 The difference between the central limit theorems
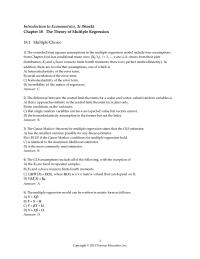
Copyright © 2015 Pearson Education, Inc. Introduction to Econometrics, 3e (Stock) Chapter 18 The Theory of Multiple Regression 18.1 Multiple Choice 1) The extended least squares assumptions in the multiple regression model include four assumptions from Chapter 6 (ui has […]
Economics Chapter 2 The expectations augmented Phillips curve
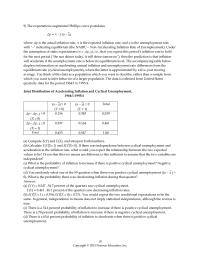
Copyright © 2015 Pearson Education, Inc. 9) The expectations augmented Phillips curve postulates △ p = π – f (u – ), where △ p is the actual inflation rate, π is the expected inflation rate, and u is the […]
Economics Chapter 2 The expected value of a discrete random
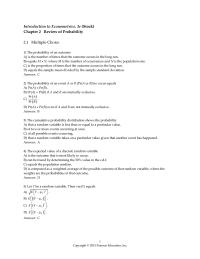
Copyright © 2015 Pearson Education, Inc. Introduction to Econometrics, 3e (Stock) Chapter 2 Review of Probability 2.1 Multiple Choice 1) The probability of an outcome A) is the number of times that the outcome occurs in the long run. B) […]
Economics Chapter 3 During The Last Few Days Before
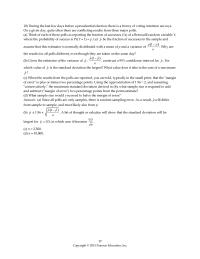
10) During the last few days before a presidential election, there is a frenzy of voting intention surveys. On a given day, quite often there are conflicting results from three major polls. (a) Think of each of these polls as […]
Economics Chapter 3 To derive the least squares estimator MY
Copyright © 2015 Pearson Education, Inc. Introduction to Econometrics, 3e (Stock) Chapter 3 Review of Statistics 3.1 Multiple Choice 1) An estimator is A) an estimate. B) a formula that gives an efficient guess of the true population value. C) […]
Economics Chapter 4 you would expect an intercept of zero and a slope
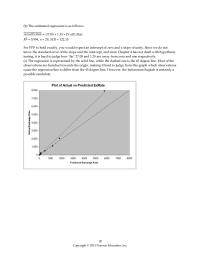
18 (b) The estimated regression is as follows: = –27.05 + 1.35 × Pr edExRate R2 = 0.994, n = 29, SER = 122.15 For PPP to hold exactly, you would expect an intercept of zero and a slope of […]
Economics Chapter 4 The reason why estimators have a sampling distribution
Copyright © 2015 Pearson Education, Inc. Introduction to Econometrics, 3e (Stock) Chapter 4 Linear Regression with One Regressor 4.1 Multiple Choice 1) When the estimated slope coefficient in the simple regression model, 1, is zero, then A) R2 = . […]
Economics Chapter 5 Explain Carefully The Relationship Between Confidence Interval
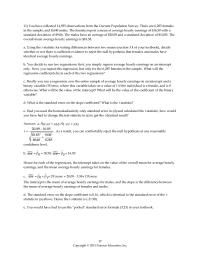
Copyright © 2015 Pearson Education, Inc. 11) You have collected 14,925 observations from the Current Population Survey. There are 6,285 females in the sample, and 8,640 males. The females report a mean of average hourly earnings of $16.50 with a […]
Economics Chapter 5 Introduction Econometrics Stock Regression With Single
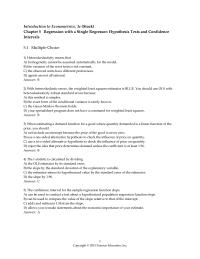
Copyright © 2015 Pearson Education, Inc. Introduction to Econometrics, 3e (Stock) Chapter 5 Regression with a Single Regressor: Hypothesis Tests and Confidence Intervals 5.1 Multiple Choice 1) Heteroskedasticity means that A) homogeneity cannot be assumed automatically for the model. B) […]
Economics Chapter 6 Subtracting The Second Equation From The First
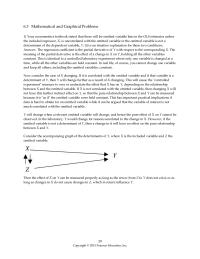
Copyright © 2015 Pearson Education, Inc. 6.3 Mathematical and Graphical Problems 1) Your econometrics textbook stated that there will be omitted variable bias in the OLS estimator unless the included regressor, X, is uncorrelated with the omitted variable or the […]
Economics Chapter 6 which takes on the value 1for females and is 0
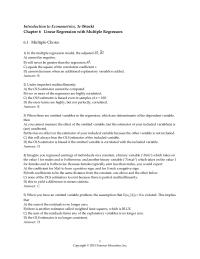
Copyright © 2015 Pearson Education, Inc. Introduction to Econometrics, 3e (Stock) Chapter 6 Linear Regression with Multiple Regressors 6.1 Multiple Choice 1) In the multiple regression model, the adjusted R2, 2 A) cannot be negative. B) will never be greater […]
Economics Chapter 7 The confidence interval for a single coefficient
Copyright © 2015 Pearson Education, Inc. Introduction to Econometrics, 3e (Stock) Chapter 7 Hypothesis Tests and Confidence Intervals in Multiple Regression 7.1 Multiple Choice 1) The confidence interval for a single coefficient in a multiple regression A) makes little sense […]
Economics Chapter 7 The First Fraction Now Represents The Percentage
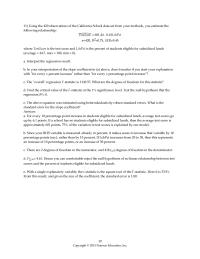
Copyright © 2015 Pearson Education, Inc. 11) Using the 420 observations of the California School data set from your textbook, you estimate the following relationship: = 681.44 – 0.61LchPct n=420, R2=0.75, SER=9.45 where TestScore is the test score and LchPct […]
Economics Chapter 8 Are They economically Important Percentage Terms How Much
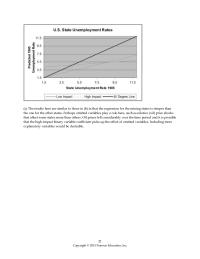
21 (c) The results here are similar to those in (b) in that the regression for the mining states is steeper than the one for the other states. Perhaps omitted variables play a role here, such as relative (oil) price […]
Economics Chapter 8 Each Coefficient Can Then Expressed Either Expected
1 Introduction to Econometrics, 3e (Stock) Chapter 8 Nonlinear Regression Functions 8.1 Multiple Choice 1) In nonlinear models, the expected change in the dependent variable for a change in one of the explanatory variables is given by A) △ Y […]
Economics Chapter 8 In the case of perfect multicollinearity
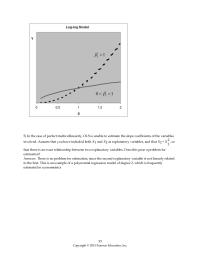
Copyright © 2015 Pearson Education, Inc. 5) In the case of perfect multicollinearity, OLS is unable to estimate the slope coefficients of the variables involved. Assume that you have included both X1 and X2 as explanatory variables, and that X2 […]
Economics Chapter 9 A significantly negative slope coefficient implies
20 where the “*” variables represent true, or permanent, per capita income components, while v and w are temporary or transitory components. Subtraction of the initial period from the current period then results in Ignoring, without loss of generality, the […]
Economics Chapter 9 arises when an independent variable is measured
Copyright © 2015 Pearson Education, Inc. Introduction to Econometrics, 3e (Stock) Chapter 9 Assessing Studies Based on Multiple Regression 9.1 Multiple Choice 1) The analysis is externally valid if A) the statistical inferences about causal effects are valid for the […]