6) The logit regression (11.10) on page 393 of your textbook reads:
= F(–4.13 + 5.37 P/Iratio + 1.27 black)
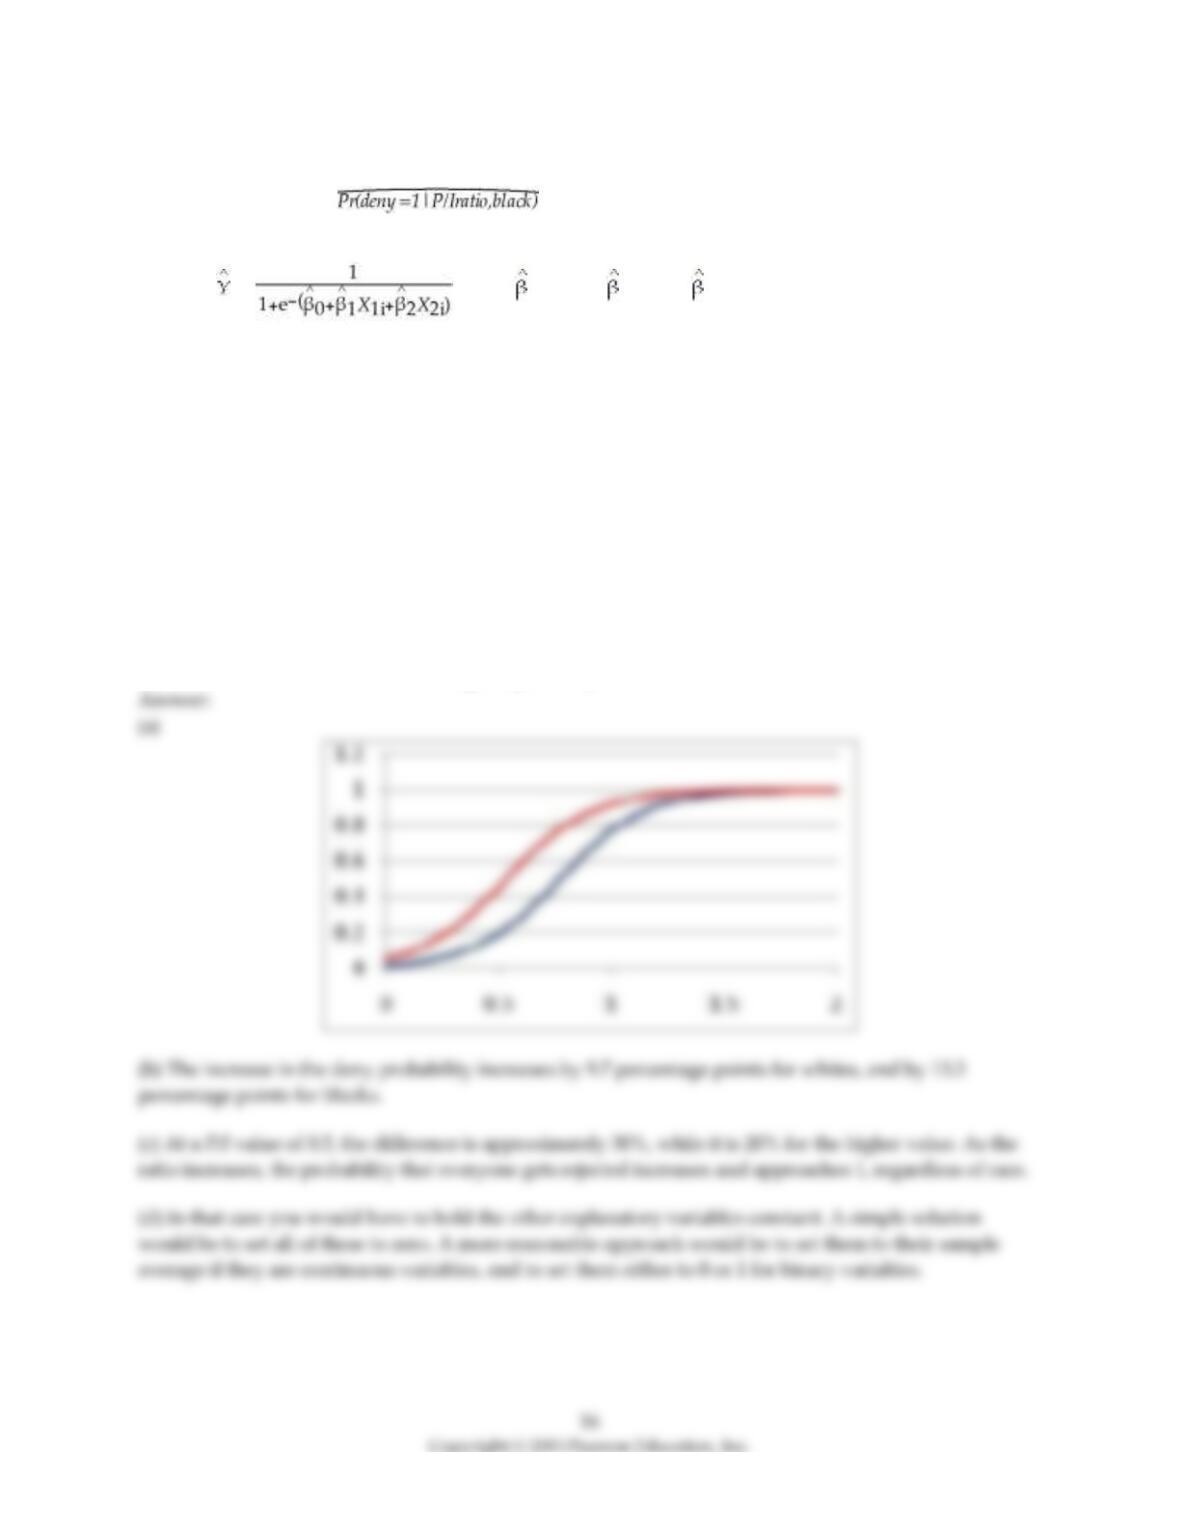
(a) Using a spreadsheet program such as Excel, plot the following logistic regression function with a
single X, i = where 0 = –4.13, 1 = 5.37, 2 = 1.27. Enter values for X1 in the first
column starting from 0 and then increment these by 0.1 until you reach 2.0. Let X2 be 0 at first. Then enter
the logistic function formula in the next column. Next allow X2 to be 1 and calculate the new values for
the logistic function in the third column. Finally produce the predicted probabilities for both blacks and
whites, connecting the predicted values with a line.
(b) Using the same spreadsheet calculations, list how the probability increases for blacks and for whites
as the P/I ratio increases from 0.5 to 0.6.
(c) What is the difference in the rejection probability between blacks and whites for a P/I ratio of 0.5 and
for 0.9? Why is the difference smaller for the higher value here?
(d) Table 11.2 on page 401 of your textbook lists logit regressions (column 2) with further explanatory
variables. Given that you can only produce simple plots in two dimensions, how would you proceed in
(a) above if there were more than a single explanatory variable?
17
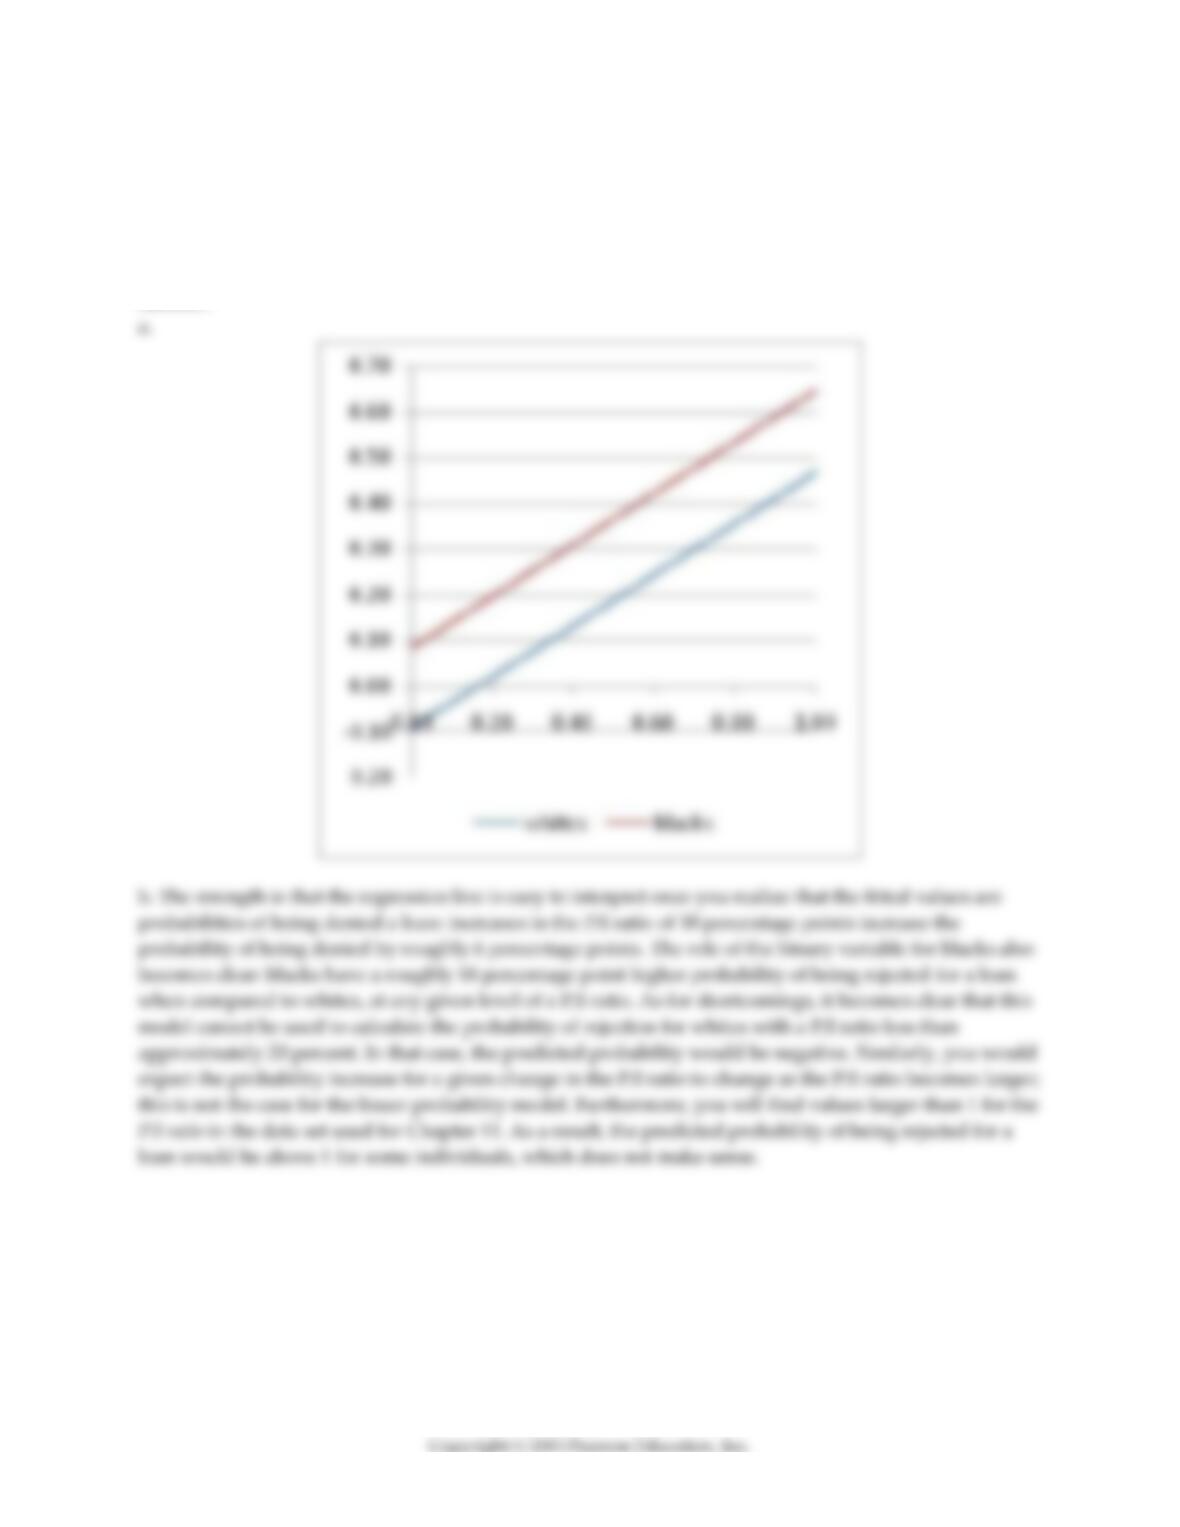
7) Equation (11.3) in your textbook presents the regression results for the linear probability model.
a. Using a spreadsheet program such as Excel, plot the fitted values for whites and blacks in the same
graph, for P/I ratios ranging from 0 to 1 (use 0.05 increments).
b. Explain some of the strengths and shortcomings of the linear probability model using this graph.
Answer:
18
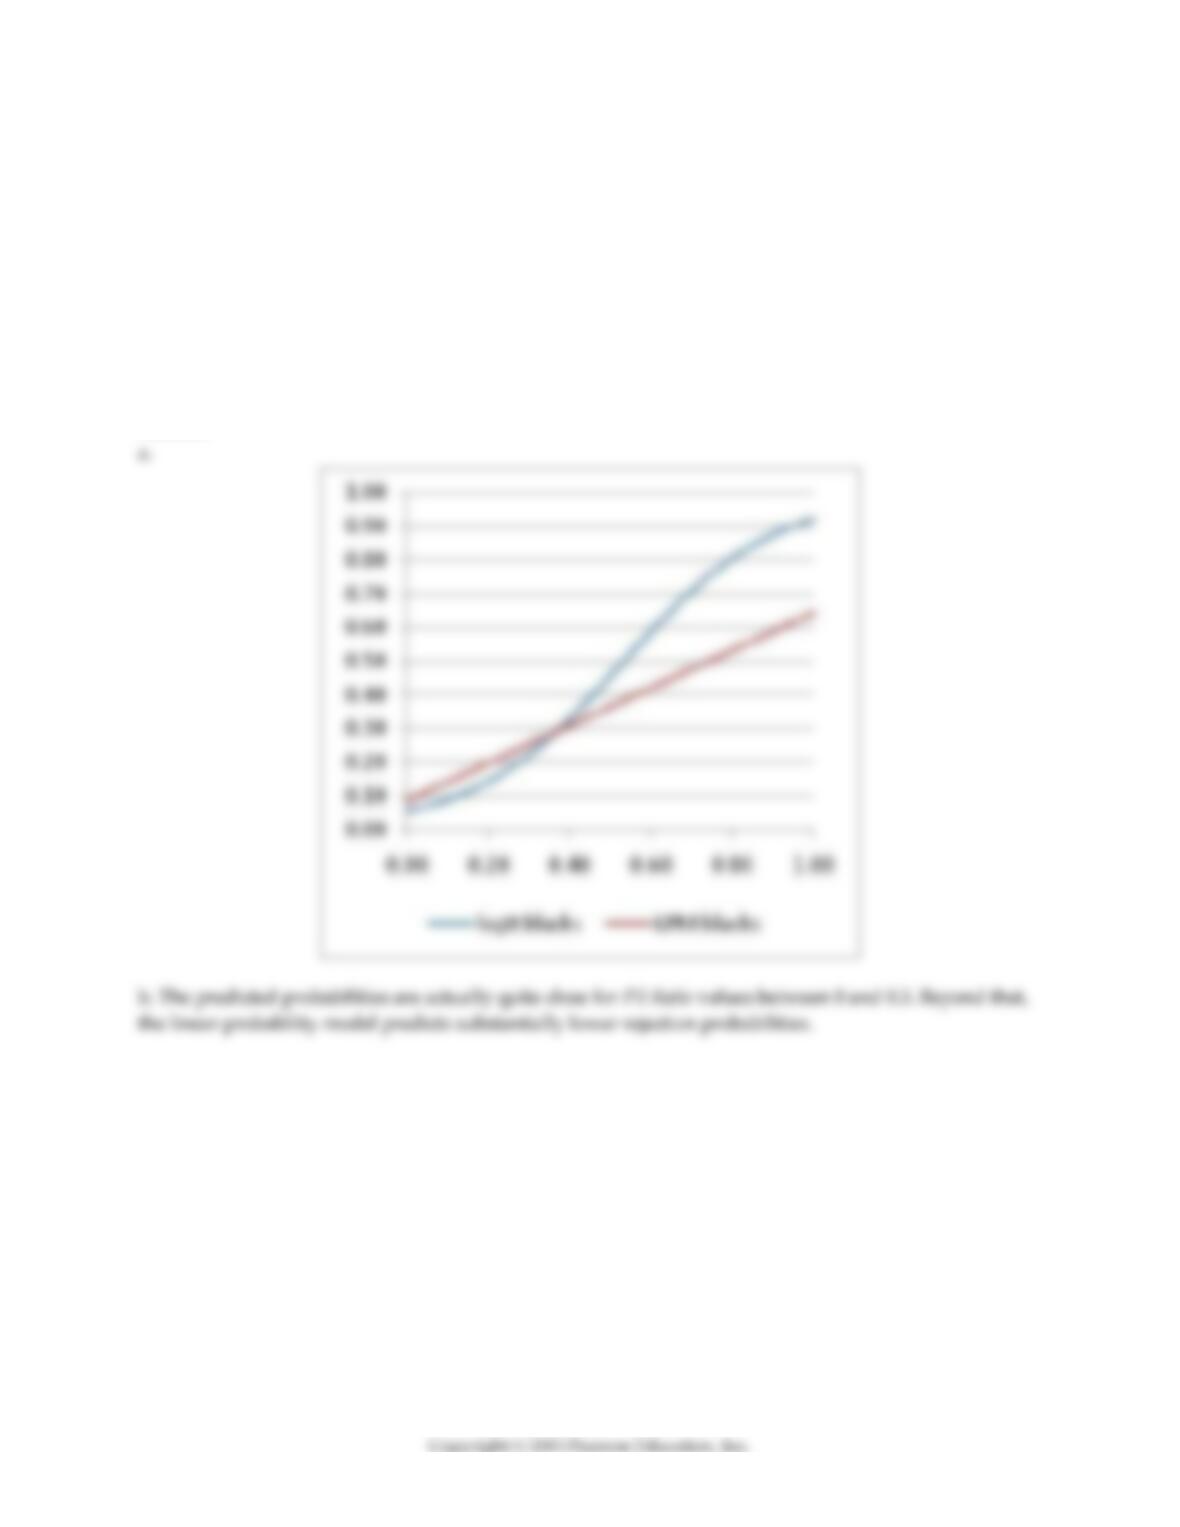
8) Equation (11.3) in your textbook presents the regression results for the linear probability model, and
equation (11.10) the results for the logit model.
a. Using a spreadsheet program such as Excel, plot the predicted probabilities for being denied a loan
for both the linear probability model and the logit model if you are black. (Use a range from 0 to 1 for the
P/I Ratio and allow for it to increase by increments of 0.05.)
b. Given the shortcomings of the linear probability model, do you think that it is a reasonable
approximation to the logit model?
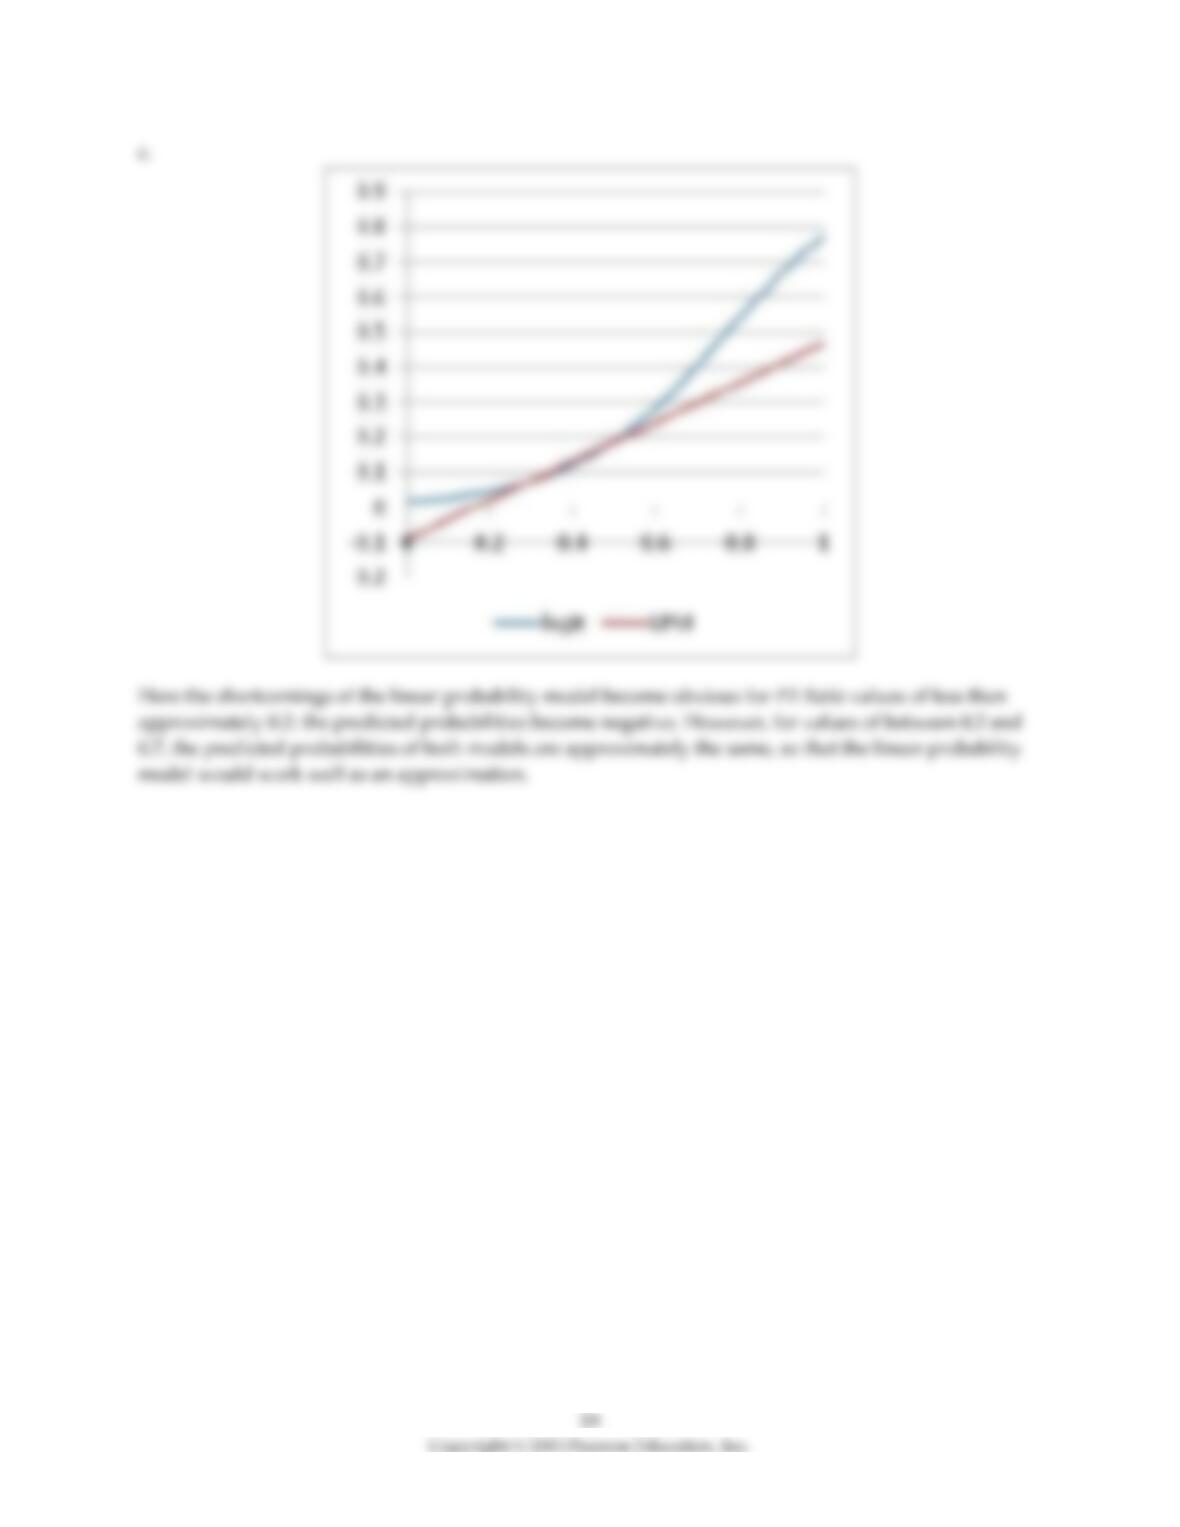
c. Repeat the exercise using predicted probabilities for whites.
Answer:
11.3 Mathematical and Graphical Problems
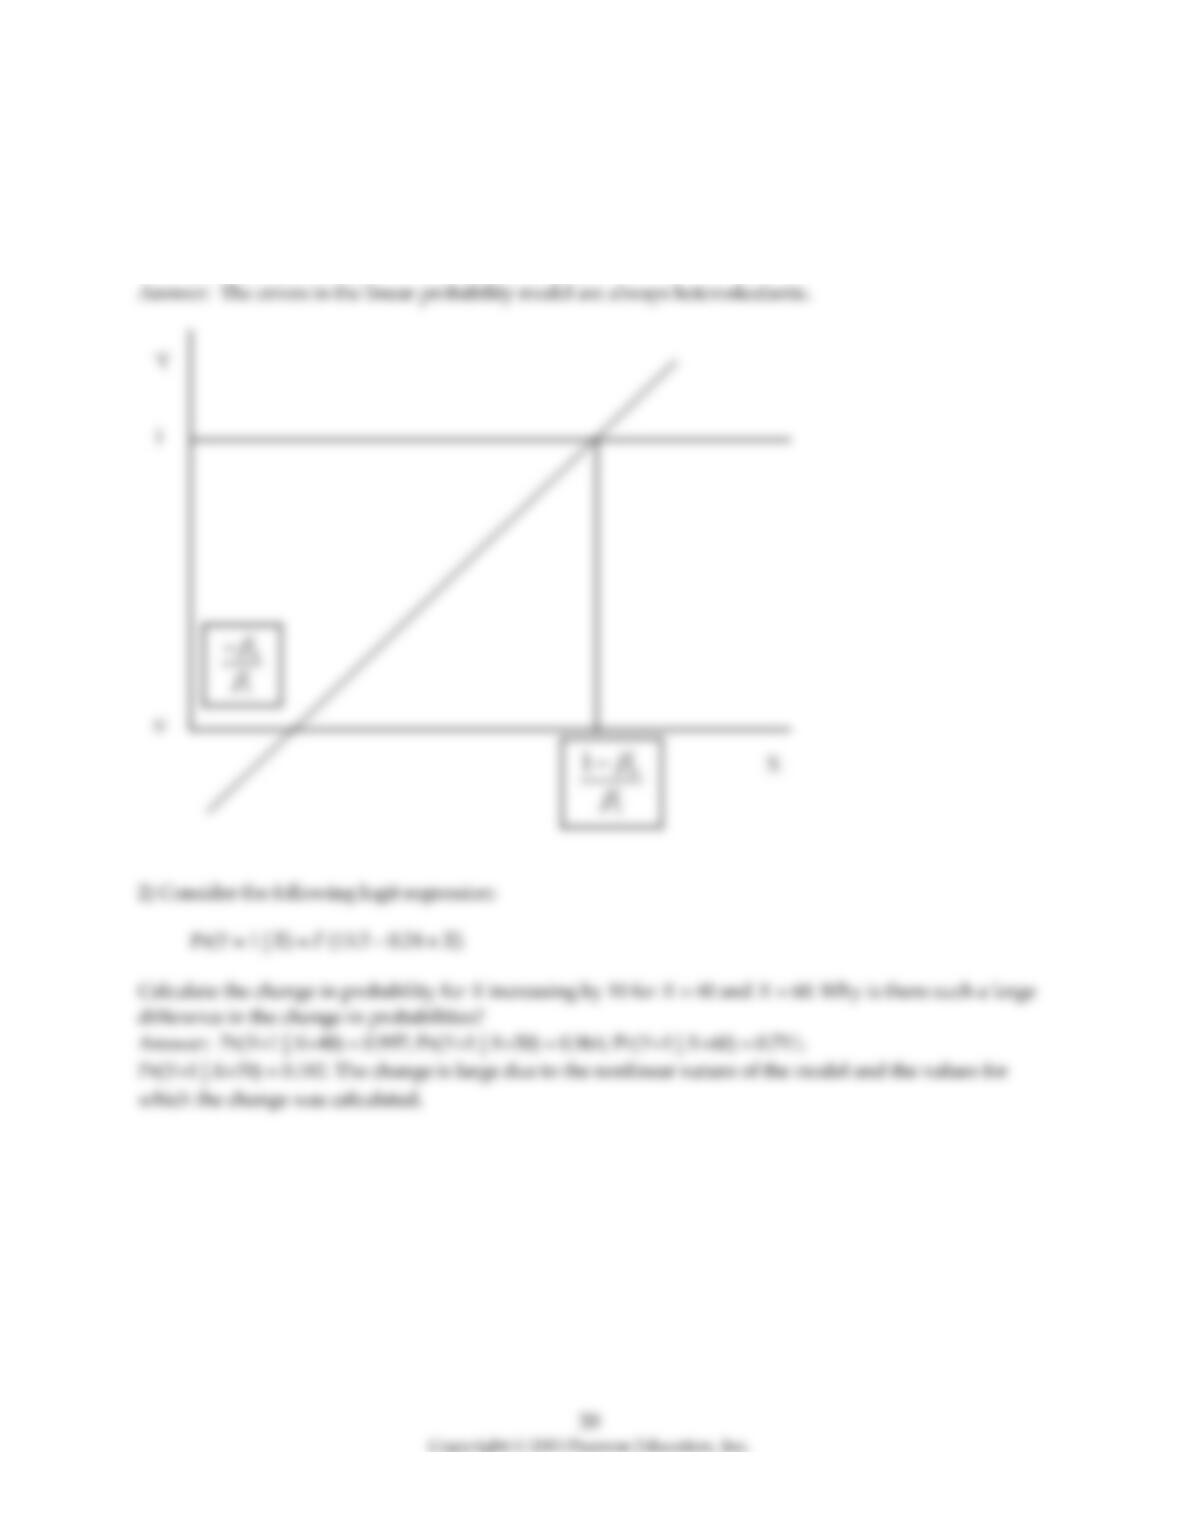
1) Sketch the regression line for the linear probability model with a single regressor. Indicate for which
values of the slope and intercept the predictions will be above one and below zero. Can you rule out
homoskedasticity in the error terms with certainty here?
21
3) You have a limited dependent variable (Y) and a single explanatory variable (X). You estimate the
relationship using the linear probability model, a probit regression, and a logit regression. The results are
as follows:
= 2.858 – 0.037 × X
(0.007)
Pr(Y = 1 X) = F (15.297 – 0.236 × X)
Pr(Y = 1 X) = Φ (8.900 – 0.137 × X)
(0.058)
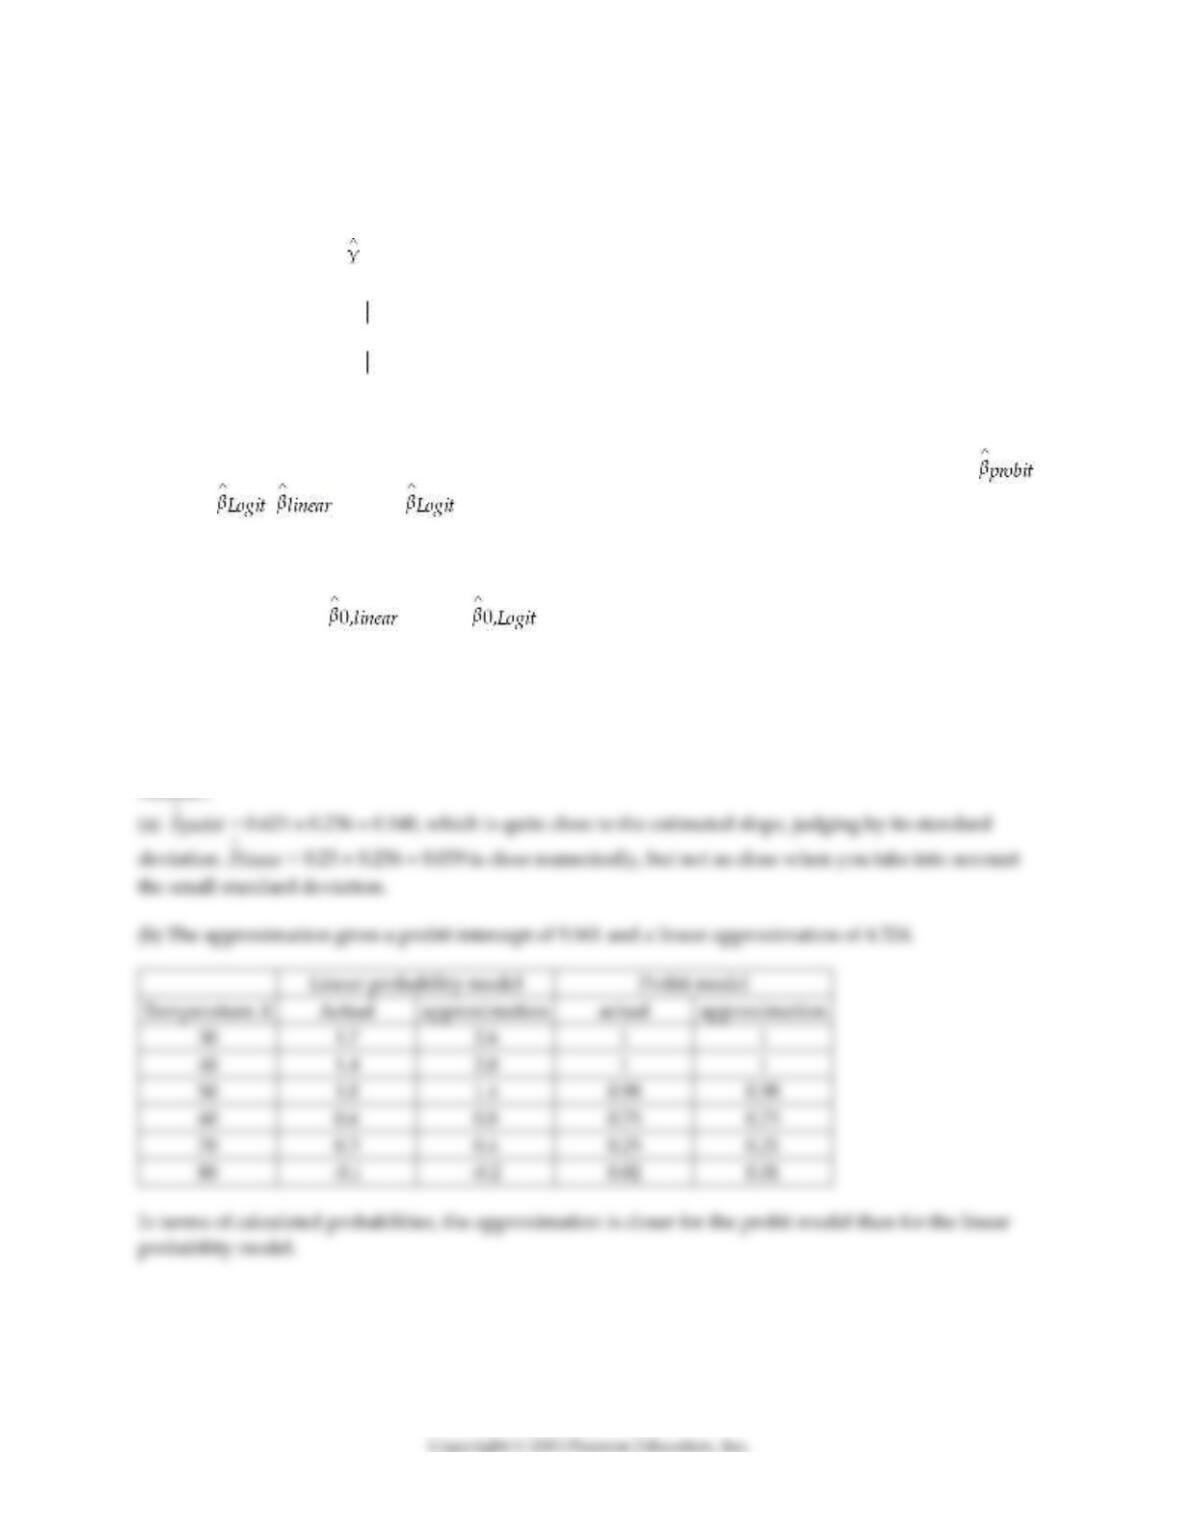
(a) Although you cannot compare the coefficients directly, you are told that “it can be shown” that certain
relationships between the coefficients of these models hold approximately. These are for the slope:
≈ 0.625 × , ≈ 0.25 × . Take the logit result above as a base and calculate the slope
coefficients for the linear probability model and the probit regression. Are these values close?
(b) For the intercept, the same conversion holds for the logit–to–probit transformation. However, for the
linear probability model, there is a different conversion:
≈ 0.25 × + 0.5
Using the logit regression as the base, calculate a few changes in X (temperature in degrees of Fahrenheit)
to see how good the approximations are.
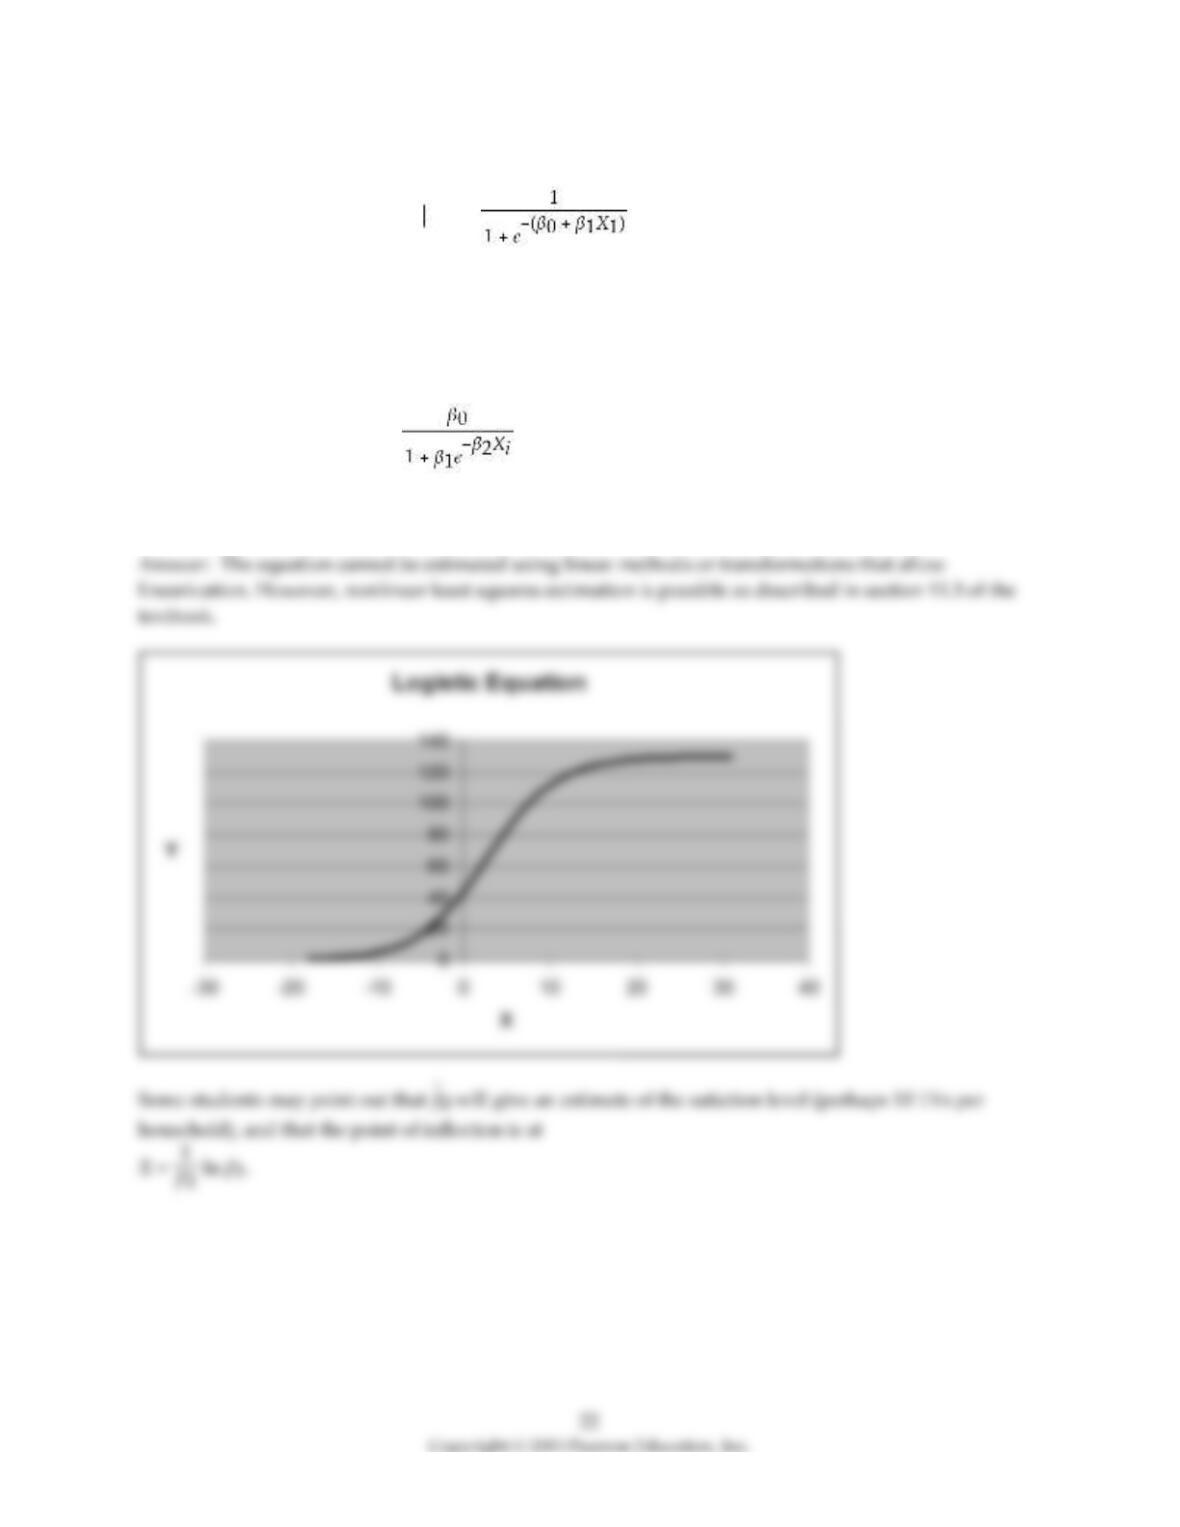
4) The population logit model of the binary dependent variable Y with a single regressor is
Pr(Y=1X1) = .
Logistic functions also play a role in econometrics when the dependent variable is not a binary variable.
For example, the demand for televisions sets per household may be a function of income, but there is a
saturation or satiation level per household, so that a linear specification may not be appropriate. Given
the regression model
Yi = + ui,
sketch the regression line. How would you go about estimating the coefficients?
23
5) (Requires Appendix material) Briefly describe the difference between the following models: censored
and truncated regression model, count data, ordered responses, and discrete choice data. Try to be
specific in terms of describing the data involved.
24
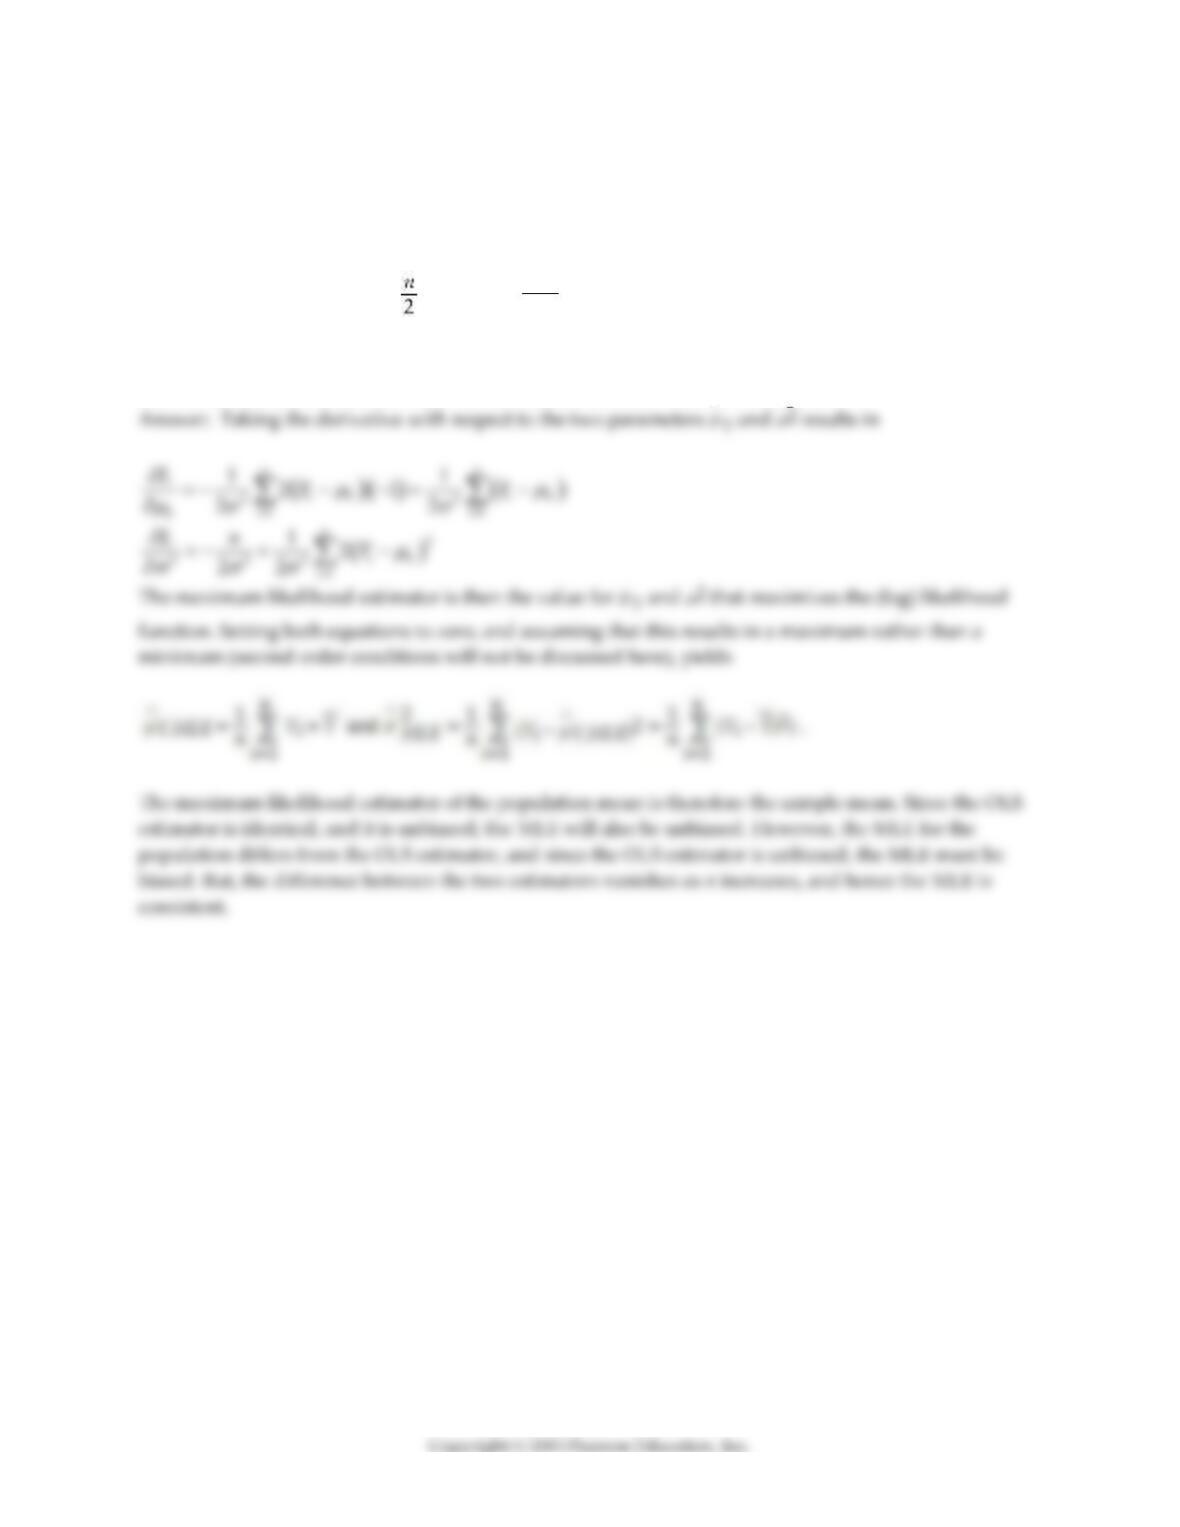
6) (Requires Appendix material and Calculus) The logarithm of the likelihood function (L) for estimating
the population mean and variance for an i.i.d. normal sample is as follows (note that taking the logarithm
of the likelihood function simplifies maximization. It is a monotonic transformation of the likelihood
function, meaning that this transformation does not affect the choice of maximum):
L = –log(2πσ2) –
( )
2
2
1
1
2
n
iY
i
Y
=
−
Derive the maximum likelihood estimator for the mean and the variance. How do they differ, if at all,
from the OLS estimator? Given that the OLS estimators are unbiased, what can you say about the
maximum likelihood estimators here? Is the estimator for the variance consistent?
25
7) Besides maximum likelihood estimation of the logit and probit model, your textbook mentions that the
model can also be estimated by nonlinear least squares. Construct the sum of squared prediction mistakes
and suggest how computer algorithms go about finding the coefficient values that minimize the function.
You may want to use an analogy where you place yourself into a mountain range at night with a
flashlight shining at your feet. Your task is to find the lowest point in the valley. You have two choices to
make: the direction you are walking in and the step length. Describe how you will proceed to find the
bottom of the valley. Once you find the lowest point, is there any guarantee that this is the lowest point of
all valleys? What should you do to assure this?
8) Consider the following probit regression
Pr(Y = 1 X) = Φ(8.9 – 0.14 × X)
Calculate the change in probability for X increasing by 10 for X = 40 and X = 60. Why is there such a large
difference in the change in probabilities?
9) Earnings equations establish a relationship between an individual’s earnings and its determinants such
as years of education, tenure with an employer, IQ of the individual, professional choice, region within
the country the individual is living in, etc. In addition, binary variables are often added to test for
“discrimination” against certain sub–groups of the labor force such as blacks, females, etc. Compare this
approach to the study in the textbook, which also investigates evidence on discrimination. Explain the
fundamental differences in both approaches using equations and mathematical specifications whenever
possible.
27
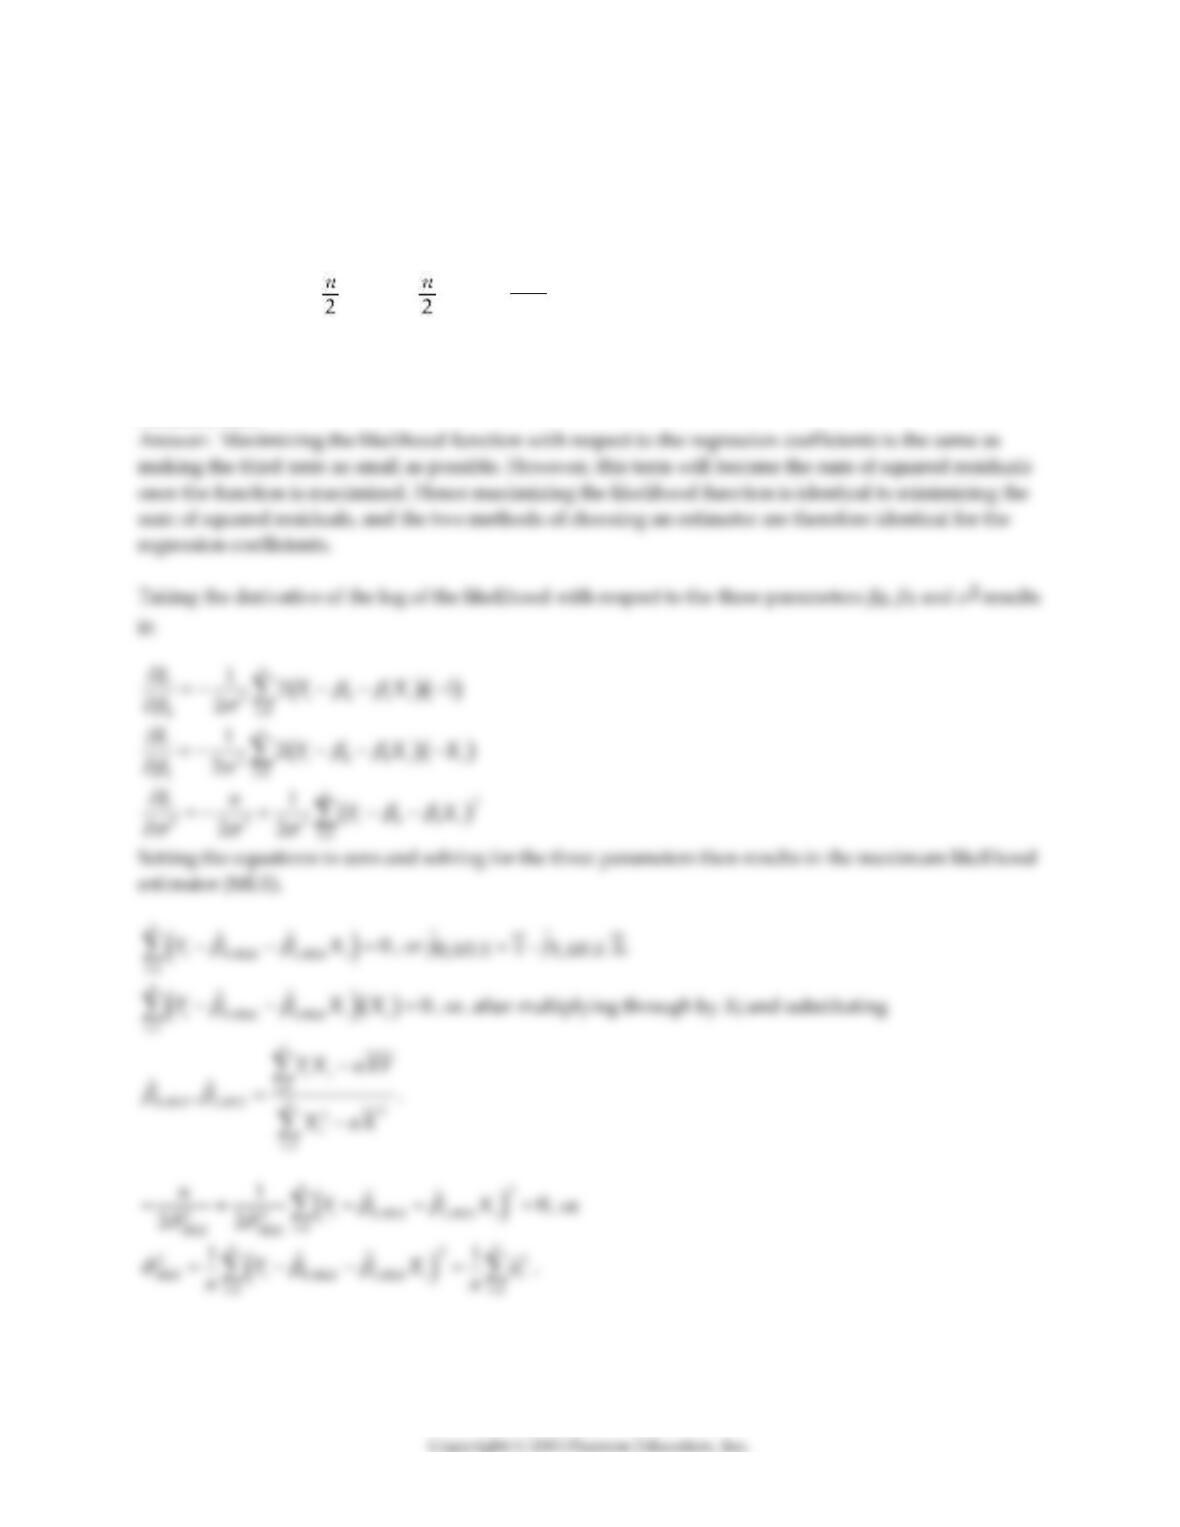
10) (Requires Appendix material and Calculus) The log of the likelihood function (L) for the simple
regression model with i.i.d. normal errors is as follows (note that taking the logarithm of the likelihood
function simplifies maximization. It is a monotonic transformation of the likelihood function, meaning
that this transformation does not affect the choice of maximum):
L = – log(2π) – log σ2 –
( )
2
01
2
1
1
2
n
ii
i
YX
=
−−
Derive the maximum likelihood estimator for the slope and intercept. What general properties do these
estimators have? Explain intuitively why the OLS estimator is identical to the maximum likelihood
estimator here.

28
11) The estimated logit regression in your textbook is
= F(–4.13 + 5.37 P/Iratio + 1.27 black)
Using a spreadsheet program, such as Excel, generate a table with predicted probabilities for both whites
and blacks using P/I Ratio values between 0 and 1 and increments of 0.05.
Answer:
12) The estimated logit regression in your textbook is
= F(–4.13 + 5.37 P/Iratio + 1.27 black)
Is there a meaningful interpretation to the slope for the P/I Ratio? Calculate the increase of a rejection
probability for both blacks and whites as the P/I Ratio increases from 0.1 to 0.2. Repeat the exercise for an
increase from 0.65 to 0.75. Why is the increase in the probability higher for blacks at the smaller value of
the P/I Ratio but higher for whites at the larger P/I Ratio?