Archives
978-0132479431 Chapter 1 Part 1
1 Copyright © 2011 Pearson Education, Inc. Foundations of Microeconomics, 5e (Bade/Parkin) Chapter 1 Getting Started 1.1 Definition and Questions 1) Scarcity exists because A) human wants exceed the resources available to satisfy them. B) some individuals have low income. […]
978-0132479431 Chapter 10 Part 1
1 Copyright © 2011 Pearson Education, Inc. Foundations of Microeconomics, 5e (Bade/Parkin) Chapter 10 Public Goods and Public Choices 10.1 Classifying Goods and Resources 1) A good is nonexcludable if A) only the government can produce it. B) nobody can […]

978-0132479431 Chapter 10 Part 10
91 Copyright © 2011 Pearson Education, Inc. 5) National defense is a ________ because ________. A) public good; it can be an overused resource B) public good; it is nonrival and nonexcludable C) common resource; no one has the incentive […]

978-0132479431 Chapter 10 Part 11
101 Copyright © 2011 Pearson Education, Inc. 12) Ten homeowners live around Lake Alice. Unfortunately, the lake is contaminated with various chemicals and the level of contamination is currently 20 parts per million. All the homeowners benefit equally if the […]

978-0132479431 Chapter 10 Part 2
11 Copyright © 2011 Pearson Education, Inc. 31) To hunters, deer in the woods are an example of a A) public good. B) private good. C) common resource. D) public resource. E) natural monopoly. Answer: C Topic: Common resource Skill: […]

978-0132479431 Chapter 10 Part 3
21 Copyright © 2011 Pearson Education, Inc. 4) A good that can be consumed even if the consumer does not pay for it A) is necessarily rival in consumption. B) completely avoids the free rider problem. C) does not exist […]

978-0132479431 Chapter 10 Part 4
31 Copyright © 2011 Pearson Education, Inc. 30) The figure above shows the marginal cost and marginal benefit of police protection in the city of Hugo, Oklahoma. Police protection is a public good. If the city of Hugo hires 25 […]

978-0132479431 Chapter 10 Part 5
41 Copyright © 2011 Pearson Education, Inc. 58) The marginal benefit of a public good is the A) sum of the marginal benefits of all the individuals at each quantity. B) marginal benefit of the individual person who places the […]

978-0132479431 Chapter 10 Part 6
51 Copyright © 2011 Pearson Education, Inc. 23) The existence of marginal external benefits for a product like higher education creates a deadweight loss for society because, without government intervention, ________ would be consumed and ________ would be produced. A) […]

978-0132479431 Chapter 10 Part 7
61 Copyright © 2011 Pearson Education, Inc. 49) The figure above shows the market for a good with an external benefit. If the market is competitive and the government takes no action, the equilibrium quantity is ________ units and the […]

978-0132479431 Chapter 10 Part 8
71 Copyright © 2011 Pearson Education, Inc. 74) The figure above shows an education market in which the government is providing households with vouchers. What is the efficient quantity of students? A) 2 million B) 4 million C) 6 million […]

978-0132479431 Chapter 10 Part 9
81 Copyright © 2011 Pearson Education, Inc. 95) An external benefit is a benefit from a good or service that someone other than the ________ receives. A) seller of the good or service B) government C) foreign sector D) consumer […]
978-0132479431 Chapter 11 Part 1
1 Copyright © 2011 Pearson Education, Inc. Foundations of Microeconomics, 5e (Bade/Parkin) Chapter 11 Externalities and the Environment 11.1 Negative Externalities: Pollution 1) When studying pollution and the environment, economists A) have no role to play. B) concentrate on the […]
978-0132479431 Chapter 12 Part 1
1 Copyright © 2011 Pearson Education, Inc. Foundations of Microeconomics, 5e (Bade/Parkin) Chapter 12 Consumer Choice and Demand 12.1 Consumption Possibilities 1) A budget line shows the A) quantities of goods a buyer can purchase with given income and prices. […]
978-0132479431 Chapter 13 Part 1
1 Copyright © 2011 Pearson Education, Inc. Foundations of Microeconomics, 5e (Bade/Parkin) Chapter 13 Production and Cost 13.1 Economic Cost and Profit 1) The primary goal of a business firm is to A) promote fairness. B) make a quality product. […]

978-0132479431 Chapter 14 Part 1
1 Copyright © 2011 Pearson Education, Inc. Foundations of Microeconomics, 5e (Bade/Parkin) Chapter 14 Perfect Competition 14.1 A Firm’s Profit-Maximizing Choices 1) A market with a large number of sellers A) can only be a perfectly competitive market. B) might […]
978-0132479431 Chapter 15 Part 1
Foundations of Microeconomics, 5e (Bade/Parkin) Chapter 15 Monopoly 15.1 Monopoly and How it Arises 1) A major characteristic of monopoly is A) a single seller of a product. B) multiple sellers of a product. C) two sellers of a product. […]
978-0132479431 Chapter 16 Part 1
1 Copyright © 2011 Pearson Education, Inc. Foundations of Microeconomics, 5e (Bade/Parkin) Chapter 16 Monopolistic Competition 16.1 What Is Monopolistic Competition? 1) An industry with a large number of firms, differentiated products, and free entry and exit is called A) […]
978-0132479431 Chapter 17 Part 1
1 Copyright © 2011 Pearson Education, Inc. Foundations of Microeconomics, 5e (Bade/Parkin) Chapter 17 Oligopoly 17.1 What Is Oligopoly? 1) A firm faces a small number of competitors. This firm is competing in A) a monopoly. B) monopolistic competition. C) […]

978-0132479431 Chapter 18 Part 1
1 Copyright © 2011 Pearson Education, Inc. Foundations of Microeconomics, 5e (Bade/Parkin) Chapter 18 Markets for Factors of Production 18.1 The Demand for a Factor of Production 1) The four factors of production that produce goods and services are A) […]

978-0132479431 Chapter 19 Part 1
1 Copyright © 2011 Pearson Education, Inc. Foundations of Microeconomics, 5e (Bade/Parkin) Chapter 19 Inequality and Poverty 19.1 Economic Inequality in the United States 1) In the United States, the poorest 20 percent of the household receive approximately ________ percent […]

978-0132479431 Chapter 2 Part 1
1 Copyright © 2011 Pearson Education, Inc. Foundations of Microeconomics, 5e (Bade/Parkin) Chapter 2 The U.S. and Global Economies 2.1 What, How, and For Whom? 1) Items that are purchased by individuals for their own enjoyment are called A) consumption […]
978-0132479431 Chapter 3 Part 1
1 Copyright © 2011 Pearson Education, Inc. Foundations of Microeconomics, 5e (Bade/Parkin) Chapter 3 The Economic Problem 3.1 Production Possibilities 1) The United States produced approximately ________ worth of goods and services in 2007. A) $14 trillion B) $14 billion […]
978-0132479431 Chapter 4 Part 11
1 Copyright © 2011 Pearson Education, Inc. Foundations of Microeconomics, 5e (Bade/Parkin) Chapter 4 Demand and Supply 4.1 Demand 1) A market is defined as A) a physical place where people buy only goods. B) a physical place where people […]
978-0132479431 Chapter 5 Part 1
1 Copyright © 2011 Pearson Education, Inc. Foundations of Microeconomics, 5e (Bade/Parkin) Chapter 5 Elasticities of Demand and Supply 5.1 The Price Elasticity of Demand 1) The price elasticity of demand is a measure of A) the equilibrium price of […]
978-0132479431 Chapter 6 Part 1
1 Copyright © 2011 Pearson Education, Inc. Foundations of Microeconomics, 5e (Bade/Parkin) Chapter 6 Efficiency and Fairness of Markets 6.1 Allocation Methods and Efficiency 1) Walmart has a limited number of day-after Thanksgiving Day special items on sale at prices […]

978-0132479431 Chapter 7 Part 1
1 Copyright © 2011 Pearson Education, Inc. Foundations of Microeconomics, 5e (Bade/Parkin) Chapter 7 Government Actions in Markets 7.1 Price Ceilings 1) A price ceiling A) is an illegal price. B) is the price that exists in a black market. […]

978-0132479431 Chapter 7 Part 10
90 Copyright © 2011 Pearson Education, Inc. 8) The figure above illustrates the current market for apartments in Washington, D.C. a. If the local government imposes a price ceiling of $1,500 per month, is there a shortage? If so, how […]

978-0132479431 Chapter 7 Part 2
11 Copyright © 2011 Pearson Education, Inc. 28) One of the consequences of a rent ceiling set below the equilibrium rent is A) decreased search activity. B) increased search activity. C) the establishment of landlord unions. D) surpluses of apartments. […]

978-0132479431 Chapter 7 Part 3
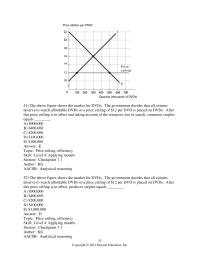
21 Copyright © 2011 Pearson Education, Inc. 51) The above figure shows the market for DVDs. The government decides that all citizens deserve to watch affordable DVDs so a price ceiling of $12 per DVD is placed on DVDs. After […]

978-0132479431 Chapter 7 Part 4
31 Copyright © 2011 Pearson Education, Inc. 73) The graph shows the market for rental housing in Little Rock. The market for apartments is efficient when ________. A) the quantity of apartments demanded is 12,000 a month B) the rent […]
978-0132479431 Chapter 7 Part 5
41 Copyright © 2011 Pearson Education, Inc. 25) An increase in the minimum wage to $15 per hour would lead to A) an increase in search activity for many workers. B) a decrease in search activity for many workers. C) […]

978-0132479431 Chapter 7 Part 6
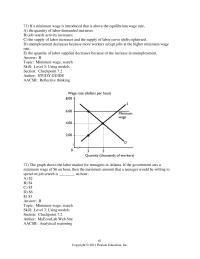
51 Copyright © 2011 Pearson Education, Inc. 49) The above figure shows a labor market with minimum wage equal to $16. In this figure, what area equals the deadweight loss? A) area A B) area B C) area C D) […]

978-0132479431 Chapter 7 Part 7
61 Copyright © 2011 Pearson Education, Inc. 71) If a minimum wage is introduced that is above the equilibrium wage rate, A) the quantity of labor demanded increases. B) job search activity increases. C) the supply of labor increases and […]

978-0132479431 Chapter 7 Part 8
71 Copyright © 2011 Pearson Education, Inc. 21) The above figure shows the domestic market for tomatoes. Suppose this market is isolated from global competition and there is a support price set at $16. In this figure, what area equals […]

978-0132479431 Chapter 7 Part 9
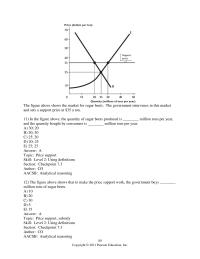
81 Copyright © 2011 Pearson Education, Inc. 13) The figure above shows that the government provides a subsidy to the farmers of ________ million. A) $350 B) $1,050 C) $50 D) $100 E) $700 Answer: A Topic: Price support, subsidy […]

978-0132479431 Chapter 8 Part 1
1 Copyright © 2011 Pearson Education, Inc. Foundations of Microeconomics, 5e (Bade/Parkin) Chapter 8 Taxes 8.1 Taxes on Buyers and Sellers 1) Tax incidence is the A) burden buyers have to absorb from a tax on goods and services. B) […]
978-0132479431 Chapter 8 Part 10
91 Copyright © 2011 Pearson Education, Inc. 9) The figure above shows the impact of an income tax. The revenue collected by the government equals area A) bce. B) feba. C) fed. D) acf. E) None of the above answers […]

978-0132479431 Chapter 8 Part 11
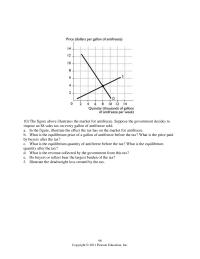
96 Copyright © 2011 Pearson Education, Inc. 10) The figure above illustrates the market for antifreeze. Suppose the government decides to impose an $8 sales tax on every gallon of antifreeze sold. a. In the figure, illustrate the effect the […]

978-0132479431 Chapter 8 Part 2
11 Copyright © 2011 Pearson Education, Inc. 24) The above figure shows the market for buckets of golf balls at the driving range. A new leisure time tax is placed on suppliers in this market, shifting the supply curve from […]

978-0132479431 Chapter 8 Part 3
21 Copyright © 2011 Pearson Education, Inc. 53) The loss to society resulting from a tax includes the A) deadweight loss. B) consumer surplus paid to the government in the form of tax revenue. C) producer surplus paid to the […]

978-0132479431 Chapter 8 Part 4
31 Copyright © 2011 Pearson Education, Inc. 74) Neither the supply of nor demand for a good is perfectly elastic or perfectly inelastic. So, imposing a tax on the good results in a ________ in the price received and kept […]

978-0132479431 Chapter 8 Part 5
41 Copyright © 2011 Pearson Education, Inc. 13) Ann pays $3,850 in taxes on an income of $38,500. Therefore her A) marginal tax rate must be ten percent. B) taxes must be progressive in nature. C) average tax rate must […]

978-0132479431 Chapter 8 Part 6
51 Copyright © 2011 Pearson Education, Inc. 41) The above figure shows the labor market for land surveyors. Dave is a land surveyor. What is the tax incidence for this income tax? A) Though the employer pays some of the […]

978-0132479431 Chapter 8 Part 7
61 Copyright © 2011 Pearson Education, Inc. 67) Suppose the supply of labor is more inelastic than the demand for labor. Then, a social security tax imposed on employers A) shifts the demand curve for labor leftward. B) lowers the […]

978-0132479431 Chapter 8 Part 8
71 Copyright © 2011 Pearson Education, Inc. 16) Which of the following taxes best illustrate the ability-to-pay principle of tax fairness? A) Tuition at public universities is lower for in-state residents than for out-of-state residents. B) The library is funded […]

978-0132479431 Chapter 8 Part 9
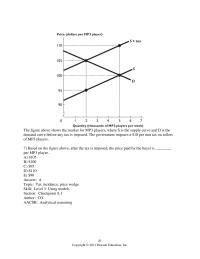
81 Copyright © 2011 Pearson Education, Inc. The figure above shows the market for MP3 players, where S is the supply curve and D is the demand curve before any tax is imposed. The government imposes a $10 per unit […]

978-0132479431 Chapter 9 Part 1
1 Copyright © 2011 Pearson Education, Inc. Foundations of Microeconomics, 5e (Bade/Parkin) Chapter 9 Global Markets in Action 9.1 How Global Markets Work 1) Goods and services that the United States buys from other nations are called A) exports. B) […]

978-0132479431 Chapter 9 Part 10
86 Copyright © 2011 Pearson Education, Inc. 7) Which of the following is true? i. When the world price of a good is lower than the price that balances domestic supply and demand, a country gains from exporting the good. […]

978-0132479431 Chapter 9 Part 2
11 Copyright © 2011 Pearson Education, Inc. 30) The above figure shows the U.S. market for flip-flops. With international trade, the United States imports ________ flip-flops. A) 300,000 B) 500,000 C) 700,000 D) 0 because the United States exports flip-flops […]

978-0132479431 Chapter 9 Part 3
21 Copyright © 2011 Pearson Education, Inc. 56) The United States exports a good if its no-trade U.S. price is ________ its world price. With international trade, U.S. production of the good ________ compared to the level of no-trade production. […]

978-0132479431 Chapter 9 Part 4
31 Copyright © 2011 Pearson Education, Inc. 28) The above figure shows the U.S. market for wheat. With international trade, consumer surplus is equal to ________. A) area A + area B + area C B) area E + area […]

978-0132479431 Chapter 9 Part 5
41 Copyright © 2011 Pearson Education, Inc. 16) Imposing a tariff on a good leads to a ________ in the price of the product and ________ in imports. A) rise; an increase B) rise; a decrease C) fall; an increase […]

978-0132479431 Chapter 9 Part 6
51 Copyright © 2011 Pearson Education, Inc. 45) If the U.S. government imposes a tariff on imported steel, who else besides U.S. steel producers gains from the tariff? A) U.S. steel consumers B) the U.S. government C) U.S. importers of […]

978-0132479431 Chapter 9 Part 7
61 Copyright © 2011 Pearson Education, Inc. 72) A tax on a good that is imposed when it is imported is called A) an import quota. B) a VER. C) a tariff. D) a sanction. E) a border tax. Answer: […]
978-0132479431 Chapter 9 Part 8
71 Copyright © 2011 Pearson Education, Inc. 25) A major reason why it is difficult to lower the barriers to free trade is A) that total benefits are less than total costs from free trade. B) the uneven distribution of […]

978-0132479431 Chapter 9 Part 9
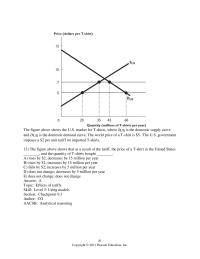
81 Copyright © 2011 Pearson Education, Inc. The figure above shows the U.S. market for T-shirts, where SUS is the domestic supply curve and DUS is the domestic demand curve. The world price of a T-shirt is $5. The U.S. […]
Chapter 1 1 Which of the following statements best describes the study of economics
Copyright © 2011 Pearson Education, Inc. Foundations of Microeconomics, 5e (Bade/Parkin) Chapter 1 Getting Started 1.1 Definition and Questions 1) Scarcity exists because A) human wants exceed the resources available to satisfy them. B) some individuals have low income. C) […]
Chapter 1 2 Suppose you have tickets to a hockey game. The tickets cannot
Copyright © 2011 Pearson Education, Inc. 16) Suppose you have tickets to a hockey game. The tickets cannot be refunded or resold. In deciding whether or not to attend the game, the cost of the tickets is A) a marginal […]
Chapter 1 3 Given Their Negative Impact Productivity The Government
Copyright © 2011 Pearson Education, Inc. 76) The Latin phrase ceteris paribus is best defined as A) the rational choice is made. B) benefits are greater than the costs. C) other things remaining the same. D) the tendency for the […]
Chapter 1 4 A graph showing the values of an economic variable for different
Copyright © 2011 Pearson Education, Inc. 24) A graph showing the values of an economic variable for different groups in a population at a point in time is called a A) cross-section graph. B) time-series graph. C) scatter diagram. D) […]
Chapter 1 5 A curve with a positive but decreasing slope represents
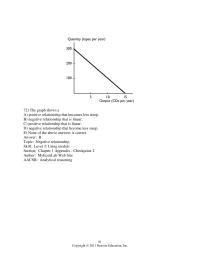
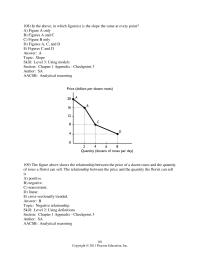
Copyright © 2011 Pearson Education, Inc. 72) The graph shows a A) positive relationship that becomes less steep. B) negative relationship that is linear. C) positive relationship that is linear. D) negative relationship that become less steep. E) None of […]
Chapter 1 6 To graph a relationship among several variables, we hold all but
Copyright © 2011 Pearson Education, Inc. 108) In the above, in which figure(s) is the slope the same at every point? A) Figure A only B) Figures A and C C) Figure B only D) Figures A, C, and D […]
Chapter 1 7 When The Test Reveals That the Student Actually
Copyright © 2011 Pearson Education, Inc. 2) Why do economists say that even very rich people face scarcity? Answer: A person faces scarcity whenever his or her wants exceed what he or she can obtain using his or her resources. […]
Chapter 1 8 What is the difference between a positive and a negative
Copyright © 2011 Pearson Education, Inc. 7) What is the difference between a positive and a negative relationship? Answer: Two variables are positively related when an increase (decrease) in one is associated with an increase (decrease) in the other. In […]
Chapter 10 1 Which of the following goods is best described as nonexcludable
Copyright © 2011 Pearson Education, Inc. Foundations of Microeconomics, 5e (Bade/Parkin) Chapter 10 Public Goods and Public Choices 10.1 Classifying Goods and Resources 1) A good is nonexcludable if A) only the government can produce it. B) nobody can be […]
Chapter 10 2 A good that can be consumed even if the consumer
Copyright © 2011 Pearson Education, Inc. 4) A good that can be consumed even if the consumer does not pay for it A) is necessarily rival in consumption. B) completely avoids the free rider problem. C) does not exist because […]
Chapter 10 3 The marginal benefit of a public good is the
Copyright © 2011 Pearson Education, Inc. 58) The marginal benefit of a public good is the A) sum of the marginal benefits of all the individuals at each quantity. B) marginal benefit of the individual person who places the lowest […]
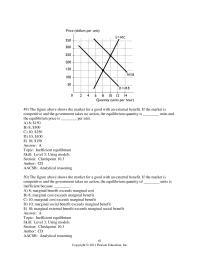
Chapter 10 4 The figure above shows the market for a good with an external
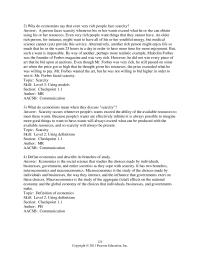
Copyright © 2011 Pearson Education, Inc. 49) The figure above shows the market for a good with an external benefit. If the market is competitive and the government takes no action, the equilibrium quantity is ________ units and the equilibrium […]
Chapter 10 5 When The Market Equilibrium Marginal Social Benefit
Copyright © 2011 Pearson Education, Inc. 95) An external benefit is a benefit from a good or service that someone other than the ________ receives. A) seller of the good or service B) government C) foreign sector D) consumer E) […]
Chapter 10 6 The company Would Provide Zero Because Everyone Would
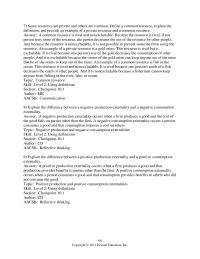
Copyright © 2011 Pearson Education, Inc. 7) Some resources are private and others are common. Define a common resource, explain the definition, and provide an example of a private resource and a common resource. Answer: A common resource is rival […]
Chapter 11 1 The production of electricity creates pollution
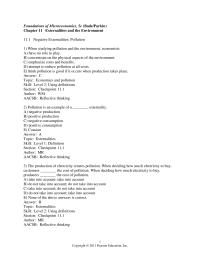
Copyright © 2011 Pearson Education, Inc. Foundations of Microeconomics, 5e (Bade/Parkin) Chapter 11 Externalities and the Environment 11.1 Negative Externalities: Pollution 1) When studying pollution and the environment, economists A) have no role to play. B) concentrate on the physical […]
Chapter 11 2 The Figure Above illustrates The Market For Leather
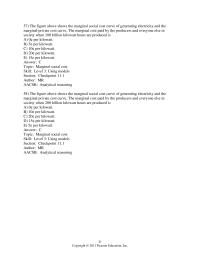
Copyright © 2011 Pearson Education, Inc. 57) The figure above shows the marginal social cost curve of generating electricity and the marginal private cost curve. The marginal cost paid by the producers and everyone else in society when 100 billion […]

Chapter 11 3 A problem with pollution charges or taxes as a solution to pollution
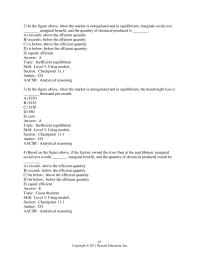
Copyright © 2011 Pearson Education, Inc. 100) The figure above shows the marginal social cost curve of generating electricity, the marginal private cost curve, and the demand curve. If the market is competitive and unregulated, the equilibrium quantity is ________ […]
Chapter 11 4 When There Are External Costs Unregulated Market
Copyright © 2011 Pearson Education, Inc. 2) In the figure above, when the market is unregulated and in equilibrium, marginal social cost ________ marginal benefit, and the quantity of chemical produced is ________. A) exceeds; above the efficient quantity B) […]
Chapter 11 5 Burning coal to generate electricity can create pollution
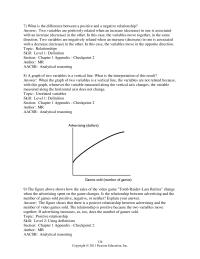
Copyright © 2011 Pearson Education, Inc. 10) “According to the Coase theorem, if Gabriel wants the local television station to cease having helicopters fly over his house at night, he will be more likely to be able to reach an […]
Chapter 12 1 Where the budget line intersects the y-axis represents a combination
Copyright © 2011 Pearson Education, Inc. Foundations of Microeconomics, 5e (Bade/Parkin) Chapter 12 Consumer Choice and Demand 12.1 Consumption Possibilities 1) A budget line shows the A) quantities of goods a buyer can purchase with given income and prices. B) […]
Chapter 12 2 When the price of one good changes while another good’s price
Copyright © 2011 Pearson Education, Inc. 51) When the price of one good changes while another good’s price does not change, then there has been a change in the A) relative price. B) marginal utility price. C) absolute price. D) […]
Chapter 12 3 Reflective Thinking Marginal Utility Per Dollar Calculated
Copyright © 2011 Pearson Education, Inc. 46) The price of coffee increases because of low crop yields. If the consumer’s utility schedule for coffee remains constant, we can predict that coffee consumption A) will increase. B) will decrease. C) will […]
Chapter 12 4 French fries Measured The Vertical Axis And Carols
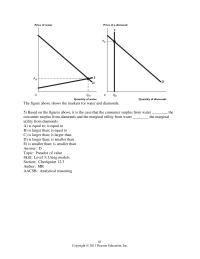
Copyright © 2011 Pearson Education, Inc. The figure above shows the markets for water and diamonds. 5) Based on the figures above, it is the case that the consumer surplus from water ________ the consumer surplus from diamonds and the […]
Chapter 12 5 What Are The Prices Egg Rolland Sushi
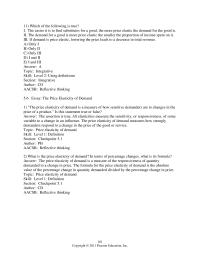
Copyright © 2011 Pearson Education, Inc. 56) Suppose you have one point on a demand curve. To plot another point for this demand curve using a group of indifference curves, A) transfer all points from the indifference curve to the […]
Chapter 12 6 Because diamonds Are Not Essential Their Total Utility
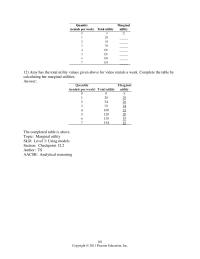
Copyright © 2011 Pearson Education, Inc. 12) Amy has the total utility values given above for video rentals a week. Complete the table by calculating her marginal utilities. 101 Answer: The completed table is above. Topic: Marginal utility Skill: Level […]
Chapter 13 1 John fishes for a living. Last year, he sold $100,000 of fish
Copyright © 2011 Pearson Education, Inc. Foundations of Microeconomics, 5e (Bade/Parkin) Chapter 13 Production and Cost 13.1 Economic Cost and Profit 1) The primary goal of a business firm is to A) promote fairness. B) make a quality product. C) […]
Chapter 13 2 Total Product Increases More Labor Hired b The
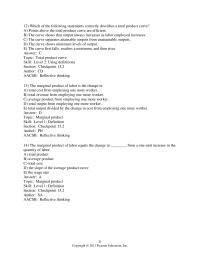
Copyright © 2011 Pearson Education, Inc. 12) Which of the following statements correctly describes a total product curve? A) Points above the total produce curve are efficient. B) The curve shows that output always increases as labor employed increases. C) […]
Chapter 13 3 What is the total variable cost of producing 60 bikes
Copyright © 2011 Pearson Education, Inc. 15) When marginal cost is positive, total cost is ________ as output increases. A) increasing B) decreasing C) constant D) negative E) undefined Answer: A Topic: Marginal cost Skill: Level 3: Using models Section: […]
Chapter 13 4 When the marginal product is increasing as the quantity increases
Copyright © 2011 Pearson Education, Inc. 65) When the marginal product is increasing as the quantity increases, then as the quantity increases the A) average product is decreasing. B) marginal cost is decreasing. C) total cost is decreasing. D) total […]
Chapter 13 5 Her Total Revenue From Her New Practice
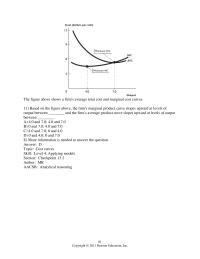
Copyright © 2011 Pearson Education, Inc. The figure above shows a firm’s average total cost and marginal cost curves. 11) Based on the figure above, the firm’s marginal product curve slopes upward at levels of output between ________ and the […]
Chapter 13 6 The average total cost curve is U-shaped
Copyright © 2011 Pearson Education, Inc. 6) The average total cost curve is U-shaped. At the quantity of output where average total cost is at its minimum, is the marginal cost curve above the average total cost curve, below the […]
Chapter 14 1 In which market structure do firms exist in very large numbers
Copyright © 2011 Pearson Education, Inc. Foundations of Microeconomics, 5e (Bade/Parkin) Chapter 14 Perfect Competition 14.1 A Firm’s Profit-Maximizing Choices 1) A market with a large number of sellers A) can only be a perfectly competitive market. B) might be […]
Chapter 14 2 As a perfectly competitive firm produces more and more
Copyright © 2011 Pearson Education, Inc. 58) As a perfectly competitive firm produces more and more of a good, its economic profit A) constantly increases. B) constantly decreases. C) first decreases, then increases. D) first increases, then decreases. E) does […]
Chapter 14 3 a perfectly competitive firm can experience which of the following
Copyright © 2011 Pearson Education, Inc. 5) In the short run, a perfectly competitive firm can experience which of the following? i. an economic profit ii. an economic loss but it continues to stay open iii. an economic loss equal […]
Chapter 14 4 A perfectly competitive market is in equilibrium and then
Copyright © 2011 Pearson Education, Inc. 15) A perfectly competitive market is in equilibrium and then demand decreases. The decrease in demand means the market price will ________ and eventually there will be ________. A) rise; entry by new firms […]
Chapter 14 5 The above figure shows three possible average total cost curves
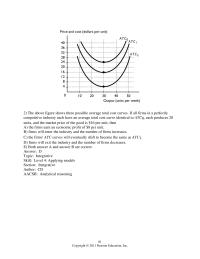
Copyright © 2011 Pearson Education, Inc. 2) The above figure shows three possible average total cost curves. If all firms in a perfectly competitive industry each have an average total cost curve identical to ATC0, each produces 20 units, and […]
Chapter 14 6 When Supply Decreases the Price Rises The Price
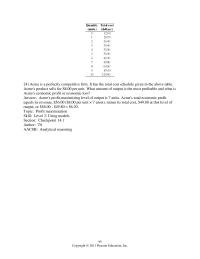
Copyright © 2011 Pearson Education, Inc. 24) Acme is a perfectly competitive firm. It has the total cost schedule given in the above table. Acme’s product sells for $8.00 per unit. What amount of output is the most profitable and […]
Chapter 15 1 Which of the following is a characteristic of monopoly
Foundations of Microeconomics, 5e (Bade/Parkin) Chapter 15 Monopoly 15.1 Monopoly and How it Arises 1) A major characteristic of monopoly is A) a single seller of a product. B) multiple sellers of a product. C) two sellers of a product. […]
Chapter 15 2 Which of the following is always true for a single-price monopolist
61) A monopoly market has A) a few firms. B) a single firm. C) two dominating firms in the market. D) only two firms in it. E) some unspecified number of firms in it. Answer: B Topic: Monopoly Skill: Level […]
Chapter 15 3 A single-price monopoly has marginal cost of $23 and marginal revenue
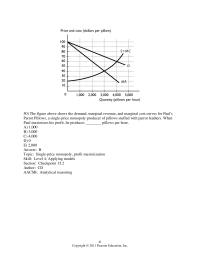
Copyright © 2011 Pearson Education, Inc. 50) The figure above shows the demand, marginal revenue, and marginal cost curves for Paul’s Parrot Pillows, a single-price monopoly producer of pillows stuffed with parrot feathers. When Paul maximizes his profit, he produces […]
Chapter 15 4 for a single-price monopoly the deadweight loss is equal to the area
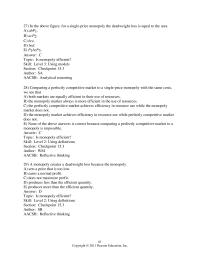
Copyright © 2011 Pearson Education, Inc. 27) In the above figure, for a single-price monopoly the deadweight loss is equal to the area A) abP1. B) acP2. C) bce. D) bed. E) P1beP3. Answer: C Topic: Is monopoly efficient? Skill: […]
Chapter 15 5 Regulated natural monopolies can obey a marginal cost pricing rule
Copyright © 2011 Pearson Education, Inc. 7) Under the social interest theory of regulation, the goal of regulating natural monopolies is A) to provide a larger, though not maximum, profit for the firms. B) to use average cost pricing. C) […]
Chapter 15 6 The situation in the figure above creates a barrier to entry for
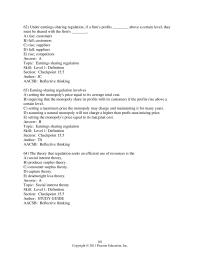
Copyright © 2011 Pearson Education, Inc. 62) Under earnings-sharing regulation, if a firm’s profits ________ above a certain level, they must be shared with the firm’s ________. A) rise; customers B) fall; customers C) rise; suppliers D) fall; suppliers E) […]
Chapter 15 7 “A single-price monopoly charges a higher price and produces
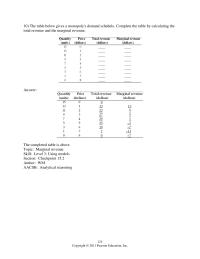
Copyright © 2011 Pearson Education, Inc. 10) The table below gives a monopoly’s demand schedule. Complete the table by calculating the total revenue and the marginal revenue. 121 Answer: The completed table is above. Topic: Marginal revenue Skill: Level 3: […]
Chapter 15 8 What Are The disadvantages And Advantages Each answer Natural
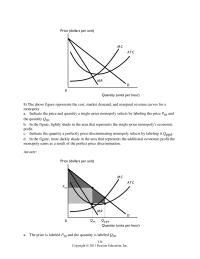
Copyright © 2011 Pearson Education, Inc. 8) The above figure represents the cost, market demand, and marginal revenue curves for a monopoly. a. Indicate the price and quantity a single-price monopoly selects by labeling the price Pm and the quantity […]
Chapter 16 1 differentiated products, and free entry and exit is called
Copyright © 2011 Pearson Education, Inc. Foundations of Microeconomics, 5e (Bade/Parkin) Chapter 16 Monopolistic Competition 16.1 What Is Monopolistic Competition? 1) An industry with a large number of firms, differentiated products, and free entry and exit is called A) perfect […]
Chapter 16 2 If the four-firm concentration ratio for the market for pizza
Copyright © 2011 Pearson Education, Inc. 58) The U.S. Justice Department A) scrutinizes any merger of firms in a market in which the four-firm concentration exceeds 25 percent. B) uses only the Herfindahl-Hirschman Index when considering whether to challenge a […]
Chapter 16 3 Advertising Cost That Incurred A Variable
Copyright © 2011 Pearson Education, Inc. 45) For a firm in monopolistic competition, the efficient scale is the amount of output at which ________ is a minimum. A) fixed cost B) average total cost C) average variable cost D) average […]
Chapter 16 4 If a firm in the long run produces less than its efficient scale
Copyright © 2011 Pearson Education, Inc. 5) Advertising costs A) make the marginal revenue more elastic. B) shift the ATC curve upward. C) shift the marginal cost curve rightward. D) indirectly shift the marginal cost curve upward. E) affect the […]

Chapter 17 1 Which of the following is found ONLY in oligopoly
Copyright © 2011 Pearson Education, Inc. Foundations of Microeconomics, 5e (Bade/Parkin) Chapter 17 Oligopoly 17.1 What Is Oligopoly? 1) A firm faces a small number of competitors. This firm is competing in A) a monopoly. B) monopolistic competition. C) an […]
Chapter 17 2 Bonnie And Clyde Confess The Crimed Both
Copyright © 2011 Pearson Education, Inc. 15) Imagine a duopoly in which two firms, A and B, produce the monopoly profit-maximizing output and equally share the economic profit. If firm A increases its output, the market price ________ and total […]
Chapter 17 3 Firms in oligopoly can achieve an economic profit
Copyright © 2011 Pearson Education, Inc. 39) Firms in oligopoly can achieve an economic profit A) always in the long run. B) if they cooperate. C) only if the demand for their products is inelastic. D) only if the demand […]
Chapter 17 4 The range of output for a duopoly ranges between the
Copyright © 2011 Pearson Education, Inc. 17.6 Integrative Questions 1) A characteristic common in both oligopoly and monopolistic competition is: A) a small number of firms compete in the market. B) natural or legal barriers prevent the entry of new […]
Chapter 17 5 The Organization Petroleum Exporting Countries Was
Copyright © 2011 Pearson Education, Inc. 4) OPEC, the Organization of Petroleum Exporting Countries, was formed in Baghdad in 1960. Since its formation, this cartel has suffered from a major problem with respect to the quota (limit) of output it […]
Chapter 18 1 The four factors of production that produce goods and services are
Copyright © 2011 Pearson Education, Inc. Foundations of Microeconomics, 5e (Bade/Parkin) Chapter 18 Markets for Factors of Production 18.1 The Demand for a Factor of Production 1) The four factors of production that produce goods and services are A) labor, […]
Chapter 18 2 Robotic technology is a substitute for labor in many manufacturing
Copyright © 2011 Pearson Education, Inc. 57) The price of capital falls. Assuming that the firm does not increase the quantity it produces, in the long run the firm’s demand for labor curve A) does not shift and there is […]
Chapter 18 3 Which of the following is true about the market for capital
Copyright © 2011 Pearson Education, Inc. 5) Which of the following is true about the market for capital? A) The demand for capital curve is upward sloping and the supply of capital curve is downward sloping. B) The supply of […]
Chapter 18 4 The Table Below Gives Their Marginal Product
Copyright © 2011 Pearson Education, Inc. 4) “The decision to employ an additional unit of labor depends on whether the value of the marginal product of labor is greater than or less than the wage rate.” Is the previous statement […]

Chapter 19 1 Income Inequality The United States Greater Than
Copyright © 2011 Pearson Education, Inc. Foundations of Microeconomics, 5e (Bade/Parkin) Chapter 19 Inequality and Poverty 19.1 Economic Inequality in the United States 1) In the United States, the poorest 20 percent of the household receive approximately ________ percent of […]
Chapter 19 2 A topic Eye The Us Economy Sex And
Copyright © 2011 Pearson Education, Inc. 6) Which of the following is true? At a given quantity of employment, if the i. value of the marginal product of a high-skill worker is $35 and the value of the marginal product […]
Chapter 19 3 Wealth Stock Assets That Is Wealth What
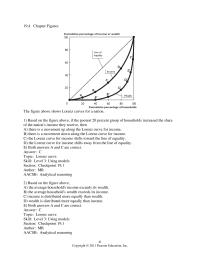
Copyright © 2011 Pearson Education, Inc. 19.4 Chapter Figures The figure above shows Lorenz curves for a nation. 1) Based on the figure above, if the poorest 20 percent group of households increased the share of the nation’s income they […]
Chapter 19 4 Income Maintenance Programs Are Programs Such Social
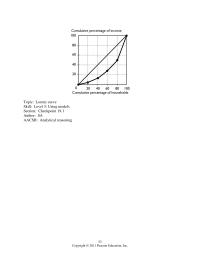
52 Topic: Lorenz curve Skill: Level 3: Using models Section: Checkpoint 19.1 Author: SA AACSB: Analytical reasoning Copyright © 2011 Pearson Education, Inc. Copyright © 2011 Pearson Education, Inc. 14) The table above gives cumulative percent of income received by […]
Chapter 2 1 Items that are purchased by individuals for their own enjoyment
Copyright © 2011 Pearson Education, Inc. Foundations of Microeconomics, 5e (Bade/Parkin) Chapter 2 The U.S. and Global Economies 2.1 What, How, and For Whom? 1) Items that are purchased by individuals for their own enjoyment are called A) consumption goods […]
Chapter 2 2 When Ethan continues his education beyond high school
Copyright © 2011 Pearson Education, Inc. 61) When Ethan continues his education beyond high school he is increasing his A) capital. B) wage rate. C) human capital. D) quantity of labor. E) rent. Answer: C Topic: Human capital Skill: Level […]
Chapter 2 3 Us Economy Interact With Those The Rest
Copyright © 2011 Pearson Education, Inc. 25) In the circular flow model with the government sector, taxes A) flow in the opposite direction as do transfers. B) flow in the same direction as do transfers. C) on households flow in […]
Chapter 2 4 The International Monetary Fund Divides Nations Into
Copyright © 2011 Pearson Education, Inc. 5) Margo orders a MacBook Pro computer from The Apple Store online to use it in her graphic design business. How will this be reflected in the figure above? A) As a flow of […]
Chapter 3 1 None The Above Answers Are Correct answer A topic
Copyright © 2011 Pearson Education, Inc. Foundations of Microeconomics, 5e (Bade/Parkin) Chapter 3 The Economic Problem 3.1 Production Possibilities 1) The United States produced approximately ________ worth of goods and services in 2007. A) $14 trillion B) $14 billion C) […]
Chapter 3 2 Nothing Free Lunch d Thousand Bottles Wine e Tons
Copyright © 2011 Pearson Education, Inc. 50) The production possibilities frontier is a graph showing the A) exact point of greatest efficiency for producing goods and services. B) tradeoff between free lunches. C) maximum combinations of goods and services that […]
Chapter 3 3 The table above presents the production possibilities frontier
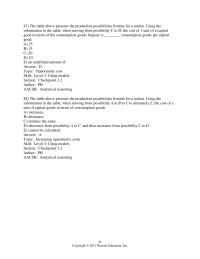
Copyright © 2011 Pearson Education, Inc. 47) The table above presents the production possibilities frontier for a nation. Using the information in the table, when moving from possibility C to D, the cost of 1 unit of a capital good […]
Chapter 3 4 A topic Achieving The Gains From Trade skill Level
Copyright © 2011 Pearson Education, Inc. 11) John can make pizza at a lower opportunity cost than Allen, but Allen can make more pizzas per day than John. Therefore, A) John cannot benefit from trade with Allen. B) Allen cannot […]
Chapter 3 5 In one hour John can produce 20 loaves of bread or 8 cakes
Copyright © 2011 Pearson Education, Inc. 61) In one hour John can produce 20 loaves of bread or 8 cakes. In one hour Phyllis can produce 30 loaves of bread or 15 cakes. Which of the following statements is true? […]
Chapter 3 6 Capital Accumulation The Growth The Nations Capital resources topic
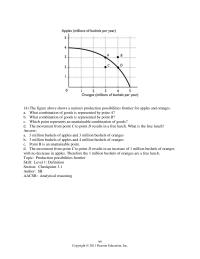
Copyright © 2011 Pearson Education, Inc. 14) The figure above shows a nation’s production possibilities frontier for apples and oranges. a. What combination of goods is represented by point A? b. What combination of goods is represented by point B? […]
Chapter 4 1 Which of the following statements is true about a competitive market
Copyright © 2011 Pearson Education, Inc. Foundations of Microeconomics, 5e (Bade/Parkin) Chapter 4 Demand and Supply 4.1 Demand 1) A market is defined as A) a physical place where people buy only goods. B) a physical place where people buy […]
Chapter 4 2 Scooters are a normal good and buyers’ incomes decrease
Copyright © 2011 Pearson Education, Inc. 59) Scooters are a normal good and buyers’ incomes decrease. Which of the figures above best illustrates how this change affects the demand curve for scooters? A) Figure A B) Figure B C) Figure […]
Chapter 4 3 A topic Shifts The Supply Curve Number Sellers skill
Copyright © 2011 Pearson Education, Inc. 21) It is expected that the price of a bushel of wheat will increase in one month. This belief will result in A) an increase in the current supply of wheat. B) a decrease […]
Chapter 4 4 Market Equilibrium Occurs When a The Quantity Demanded
Copyright © 2011 Pearson Education, Inc. 2) Market equilibrium occurs when A) the quantity demanded equals the quantity supplied. B) the market is changing rapidly. C) other things remain the same. D) buyers get the lowest possible price. E) everyone […]
Chapter 4 5 More Information Needed Determine The Effect The
Copyright © 2011 Pearson Education, Inc. 54) Contractors can use plywood or brick to construct walls. Suppose the price of bricks increases. Which of the figures above best illustrates the effect of this change on the market for plywood? A) […]
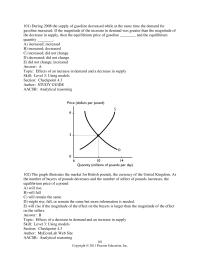
Chapter 4 6 During 2008 the supply of gasoline decreased while at
Copyright © 2011 Pearson Education, Inc. 101) During 2008 the supply of gasoline decreased while at the same time the demand for gasoline increased. If the magnitude of the increase in demand was greater than the magnitude of the decrease […]
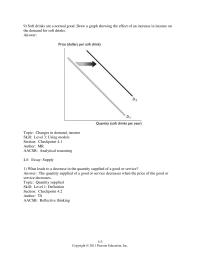
Chapter 4 7 The Demand Curve Does Not Shift rather The
Copyright © 2011 Pearson Education, Inc. 9) Soft drinks are a normal good. Draw a graph showing the effect of an increase in income on the demand for soft drinks. Answer: Topic: Changes in demand, income Skill: Level 3: Using […]
Chapter 5 1 The price elasticity of demand is a measure of
Copyright © 2011 Pearson Education, Inc. Foundations of Microeconomics, 5e (Bade/Parkin) Chapter 5 Elasticities of Demand and Supply 5.1 The Price Elasticity of Demand 1) The price elasticity of demand is a measure of A) the equilibrium price of a […]
Chapter 5 2 Percent Change The Price Good Leads
Copyright © 2011 Pearson Education, Inc. 61) If a 4 percent change in the price of a good leads to a 3 percent change in quantity demanded, the price elasticity of demand equals A) 1.33. B) 0.75. C) 4.00. D) […]
Chapter 5 3 Using The Midpoint Method The Elasticity Supply
Copyright © 2011 Pearson Education, Inc. 116) If a 20 percent increase in the price of a movie ticket leads to a 16 percent decrease in the quantity of tickets demanded, which of the following is correct? A) total expenditures […]
Chapter 5 4 What is the formula for the cross elasticity of demand
Copyright © 2011 Pearson Education, Inc. 45) Many manufactured goods have an ________ supply if production plans have only a short period to change and as time passes and all production adjustments are made, the supply of the good ________ […]
Chapter 5 5 Atopic Midpoint Formula skill Level Using Models section Checkpoint
Copyright © 2011 Pearson Education, Inc. 56) If a 5 percent decrease in income leads to a 15 percent decrease in the demand for a good, the income elasticity of demand equals A) -1/3 and the good is an inferior […]
Chapter 5 6 Finally The demand Unit Elastic Then The Higher
Copyright © 2011 Pearson Education, Inc. 11) Which of the following is true? I. The easier it is to find substitutes for a good, the more price elastic the demand for the good is. II. The demand for a good […]
Chapter 5 7 Cross Elasticity Demand skill Level Using Definitions section Checkpoint
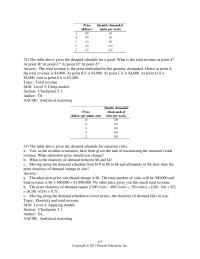
Copyright © 2011 Pearson Education, Inc. 32) The table above gives the demand schedule for a good. What is the total revenue at point A? At point B? At point C? At point D? At point E? Answer: The total […]
Chapter 6 1 Walmart has a limited number of day-after Thanksgiving Day
Copyright © 2011 Pearson Education, Inc. Foundations of Microeconomics, 5e (Bade/Parkin) Chapter 6 Efficiency and Fairness of Markets 6.1 Allocation Methods and Efficiency 1) Walmart has a limited number of day-after Thanksgiving Day special items on sale at prices well […]
Chapter 6 2 None The Above Answers Correct answer Atopic Demand
Copyright © 2011 Pearson Education, Inc. 60) Allocative efficiency is achieved when the marginal benefit of a good A) exceeds the marginal cost regardless of how much the difference is. B) is less than its marginal cost. C) is equal […]
Chapter 6 3 C topic Supply Curve And Marginal Cost Curve skill
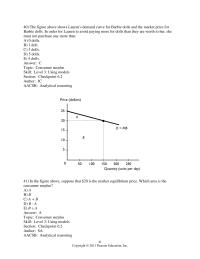
Copyright © 2011 Pearson Education, Inc. 40) The figure above shows Lauren’s demand curve for Barbie dolls and the market price for Barbie dolls. In order for Lauren to avoid paying more for dolls than they are worth to her, […]
Chapter 6 4 In a figure that shows a supply curve and a demand curve
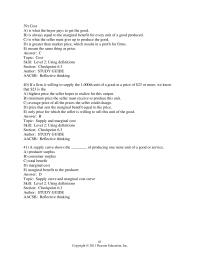
Copyright © 2011 Pearson Education, Inc. 39) Cost A) is what the buyer pays to get the good. B) is always equal to the marginal benefit for every unit of a good produced. C) is what the seller must give […]
Chapter 6 5 The Government Must Allocate Resources Using Command
Copyright © 2011 Pearson Education, Inc. 45) Obstacles in achieving efficiency in a market include A) public goods. B) the presence of an external cost or benefit. C) competition. D) Both answers A and C are correct. E) Both answers […]
Chapter 6 6 The Fact That The Marginal Benefit Exceeds
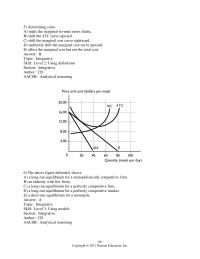
Copyright © 2011 Pearson Education, Inc. 11) In the figure above, the total revenue from pizza per day is A) $60,000. B) $100,000. C) $40,000. D) $80,000. E) $50,000. Answer: B Topic: Total revenue Skill: Level 3: Using models Section: […]
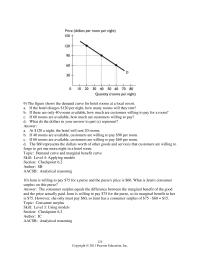
Chapter 6 7 Subsidies Have The Opposite Effect Decreasing The
Copyright © 2011 Pearson Education, Inc. 9) The figure shows the demand curve for hotel rooms at a local resort. a. If the hotel charges $120 per night, how many rooms will they rent? b. If there are only 40 […]

Chapter 7 1 When a price ceiling below the equilibrium price is imposed
Copyright © 2011 Pearson Education, Inc. Foundations of Microeconomics, 5e (Bade/Parkin) Chapter 7 Government Actions in Markets 7.1 Price Ceilings 1) A price ceiling A) is an illegal price. B) is the price that exists in a black market. C) […]
Chapter 7 2 The above figure shows the market for DVDs
Copyright © 2011 Pearson Education, Inc. 51) The above figure shows the market for DVDs. The government decides that all citizens deserve to watch affordable DVDs so a price ceiling of $12 per DVD is placed on DVDs. After this […]
Chapter 7 3 E topic Minimum Wage Efficiency skill Level Using Models section
Copyright © 2011 Pearson Education, Inc. 25) An increase in the minimum wage to $15 per hour would lead to A) an increase in search activity for many workers. B) a decrease in search activity for many workers. C) a […]
Chapter 7 4 If a minimum wage is introduced that is above the
Copyright © 2011 Pearson Education, Inc. 71) If a minimum wage is introduced that is above the equilibrium wage rate, A) the quantity of labor demanded increases. B) job search activity increases. C) the supply of labor increases and the […]
Chapter 7 5 What The Equilibrium Price Of the Drug How
Copyright © 2011 Pearson Education, Inc. The figure above shows the market for sugar beets. The government intervenes in this market and sets a support price at $35 a ton. 11) In the figure above, the quantity of sugar beets […]
Chapter 8 1 The Figure Shows That The Government Has imposed
Copyright © 2011 Pearson Education, Inc. Foundations of Microeconomics, 5e (Bade/Parkin) Chapter 8 Taxes 8.1 Taxes on Buyers and Sellers 1) Tax incidence is the A) burden buyers have to absorb from a tax on goods and services. B) burden […]
Chapter 8 2 C topic Tax Incidence Price Wedge skill Level Applying
Copyright © 2011 Pearson Education, Inc. 53) The loss to society resulting from a tax includes the A) deadweight loss. B) consumer surplus paid to the government in the form of tax revenue. C) producer surplus paid to the government […]
Chapter 8 3 Though The Employer Pays Some The Tax
Copyright © 2011 Pearson Education, Inc. 13) Ann pays $3,850 in taxes on an income of $38,500. Therefore her A) marginal tax rate must be ten percent. B) taxes must be progressive in nature. C) average tax rate must be […]
Chapter 8 4 a social security tax imposed on employers
Copyright © 2011 Pearson Education, Inc. 67) Suppose the supply of labor is more inelastic than the demand for labor. Then, a social security tax imposed on employers A) shifts the demand curve for labor leftward. B) lowers the wage […]
Chapter 8 5 at the market equilibrium with the tax, marginal benefit
Copyright © 2011 Pearson Education, Inc. The figure above shows the market for MP3 players, where S is the supply curve and D is the demand curve before any tax is imposed. The government imposes a $10 per unit tax […]
Chapter 8 6 There Difference The Tax Incidence The Same
96 10) The figure above illustrates the market for antifreeze. Suppose the government decides to impose an $8 sales tax on every gallon of antifreeze sold. a. In the figure, illustrate the effect the tax has on the market for […]
Chapter 9 1 Goods and services that the United States buys from
Copyright © 2011 Pearson Education, Inc. Foundations of Microeconomics, 5e (Bade/Parkin) Chapter 9 Global Markets in Action 9.1 How Global Markets Work 1) Goods and services that the United States buys from other nations are called A) exports. B) imports. […]
Chapter 9 2 The United States exports a good if its no-trade U.S
Copyright © 2011 Pearson Education, Inc. 56) The United States exports a good if its no-trade U.S. price is ________ its world price. With international trade, U.S. production of the good ________ compared to the level of no-trade production. A) […]
Chapter 9 3 As a result of U.S. tariffs on fishnets produced in other nations
Copyright © 2011 Pearson Education, Inc. 16) Imposing a tariff on a good leads to a ________ in the price of the product and ________ in imports. A) rise; an increase B) rise; a decrease C) fall; an increase D) […]
Chapter 9 4 A tax on a good that is imposed when it is imported is called
Copyright © 2011 Pearson Education, Inc. 72) A tax on a good that is imposed when it is imported is called A) an import quota. B) a VER. C) a tariff. D) a sanction. E) a border tax. Answer: C […]
Chapter 9 5 Producers The Good Being Exported Gain From
Copyright © 2011 Pearson Education, Inc. The figure above shows the U.S. market for T-shirts, where SUS is the domestic supply curve and DUS is the domestic demand curve. The world price of a T-shirt is $5. The U.S. government […]