50) The production possibilities frontier is a graph showing the
A) exact point of greatest efficiency for producing goods and services.
B) tradeoff between free lunches.
C) maximum combinations of goods and services that can be produced.
D) minimum combinations of goods and services that can be produced.
E) resources available for the economy’s production use.
51) The production possibilities frontier is a boundary that separates
A) the combinations of goods that can be produced from the combinations of services.
B) attainable combinations of goods and services that can be produced from unattainable ones.
C) equitable combinations of goods and services that can be produced from inequitable ones.
D) fair combinations of goods and services that can be consumed from unfair ones.
E) affordable production points from unaffordable points.
52) Points inside the PPF are all
A) unattainable and have fully employed resources.
B) attainable and have fully employed resources.
C) unattainable and have some unemployed resources.
D) attainable and have some unemployed resources.
E) unaffordable.
53) During a time of high unemployment, a country can increase the production of one good or
service
A) without decreasing the production of something else.
B) but must decrease the production of something else.
C) and must increase the production of something else.
D) by using resources in the production process twice.
E) but the opportunity cost is infinite.
54) Moving along the production possibilities frontier itself illustrates
A) the existence of tradeoffs.
B) the existence of unemployment of some factors of production.
C) the benefits of free lunches.
D) how free lunches can be exploited through trade.
E) how tradeoffs need not occur if the economy is efficient.
55) Points on the PPF are all
A) unattainable and have fully employed resources.
B) free lunches.
C) inefficient.
D) attainable and have some unemployed resources.
E) production efficient.
3.2 Opportunity Cost
1) In a production possibilities frontier graph, the cost of producing more units of a good is
measured by the
A) dollar value of the resources used to produce the good.
B) amount of the other good or service that must be forgone.
C) dollar value of the additional output.
D) area in the arc between the PPF and a straight line drawn between the starting point and the
ending point.
E) None of the above answers is correct.
2) The opportunity cost of producing one more unit of a good is calculated by dividing the
A) increase in the quantity of that good by the decrease in the quantity of other good.
B) total quantity of that good by the total quantity of other good.
C) decrease in the quantity of the other good by the increase in the quantity of the good whose
opportunity cost we’re calculating.
D) total quantity of the other good by the total quantity of the good whose opportunity cost we’re
calculating.
E) price of the good whose opportunity cost we are calculating by the number of units of the
other good that are forgone.
3) To find the opportunity cost of producing one more unit of any product while on the
production possibilities frontier requires
A) setting the amounts of the two products equal to each other.
B) setting the change in one product equal to the change in the other product.
C) dividing the amount of the product forgone by the amount of the product gained.
D) subtracting the change in the product whose production increased from the change in the
product whose production decreased.
E) None of these describe how to find opportunity cost.
4) To calculate the opportunity cost per unit, you divide the decrease in the quantity of the
forgone item by the
A) decrease in the quantity of the other item.
B) increase in the quantity of the other item obtained.
C) price of the item obtained.
D) price of the item forgone.
E) price of the item obtained and then multiply by the price of the item forgone.
5) On a production possibilities frontier, 500 pounds of apples and 1,200 pounds of bananas can
be produced while at another point on the same frontier, 300 pounds of apples and 1,300 pounds
of bananas can be produced. Between these points, what is the opportunity cost of producing a
pound of bananas?
A) 2 pounds of bananas
B) 200 pounds of apples
C) 2 pounds of apples
D) 0.5 a pound of apples
E) 12/5 = 2.4 pounds of apples
6) On a production possibilities frontier, 500 pounds of apples and 1,200 pounds of bananas can
be produced while at another point on the same frontier, 300 pounds of apples and 1,300 pounds
of bananas can be produced. Between these points, what is the opportunity cost of producing a
pound of apples?
A) 2 pounds of bananas
B) 100 pounds of bananas
C) 2 pounds of apples
D) 0.5 a pound of bananas
E) 5/12 of a banana
7) A country produces only apples and bananas. Moving from point A to point B along its
production possibilities frontier, 5 apples are forgone and 4 bananas are gained. What is the
opportunity cost of a banana?
A) 4 apples
B) 5/4 of an apple
C) 4/5 of an apple
D) 1 banana
E) None of the above answers is correct
8) A country produces only apples and bananas. Moving from point A to point B along its
production possibilities frontier, 5 apples are gained and 4 bananas are forgone. What is the
opportunity cost of an apple?
A) 4 bananas
B) 5/4 of a bananas
C) 4/5 of a banana
D) 1 apple
E) None of the above answers is correct
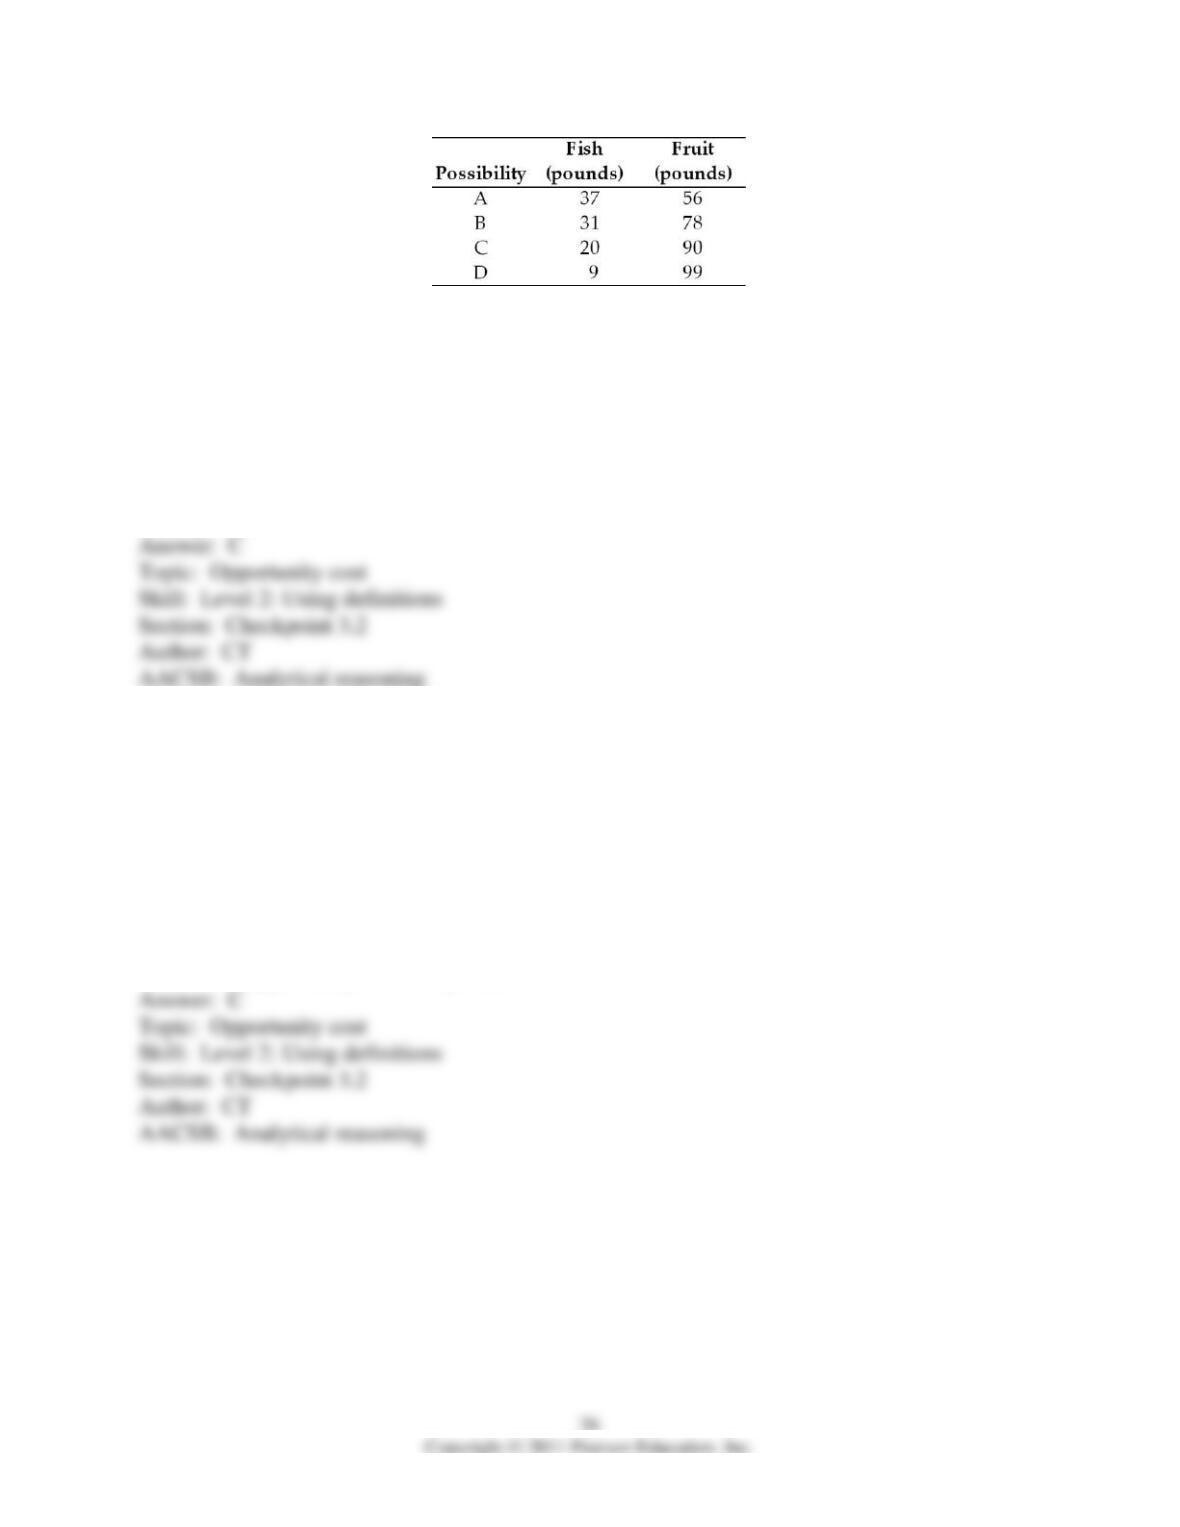
9) Robinson Crusoe divides his time between catching fish and gathering fruit. Part of his
production possibilities frontier is given in the above table. If Mr. Crusoe is on his PPF and he
increases the amount of fruit he gathers from 56 to 90 pounds, the opportunity cost is
A) 37 pounds of fish.
B) 31 pounds of fish.
C) 17 pounds of fish.
D) 34 pounds of fruit.
E) 90 pounds of fruit.
10) Robinson Crusoe divides his time between catching fish and gathering fruit. Part of his
production possibilities frontier is given in the above table. Mr. Crusoe, while lonesome, is
efficient and always stays on his PPF. Mr. Crusoe is consuming 20 pounds of fish. Then he
decides to slowly become a vegetarian and decrease his consumption of fish to 9 pounds. This
decision means that Mr. Crusoe will
A) incur an opportunity cost of 9 pounds of fruit.
B) incur an opportunity cost of 20 pounds of fish.
C) be able to enjoy a gain of 9 pounds of fruit.
D) incur an opportunity cost of 99 pounds of fruit.
E) incur an opportunity cost of 9 pounds of fish.
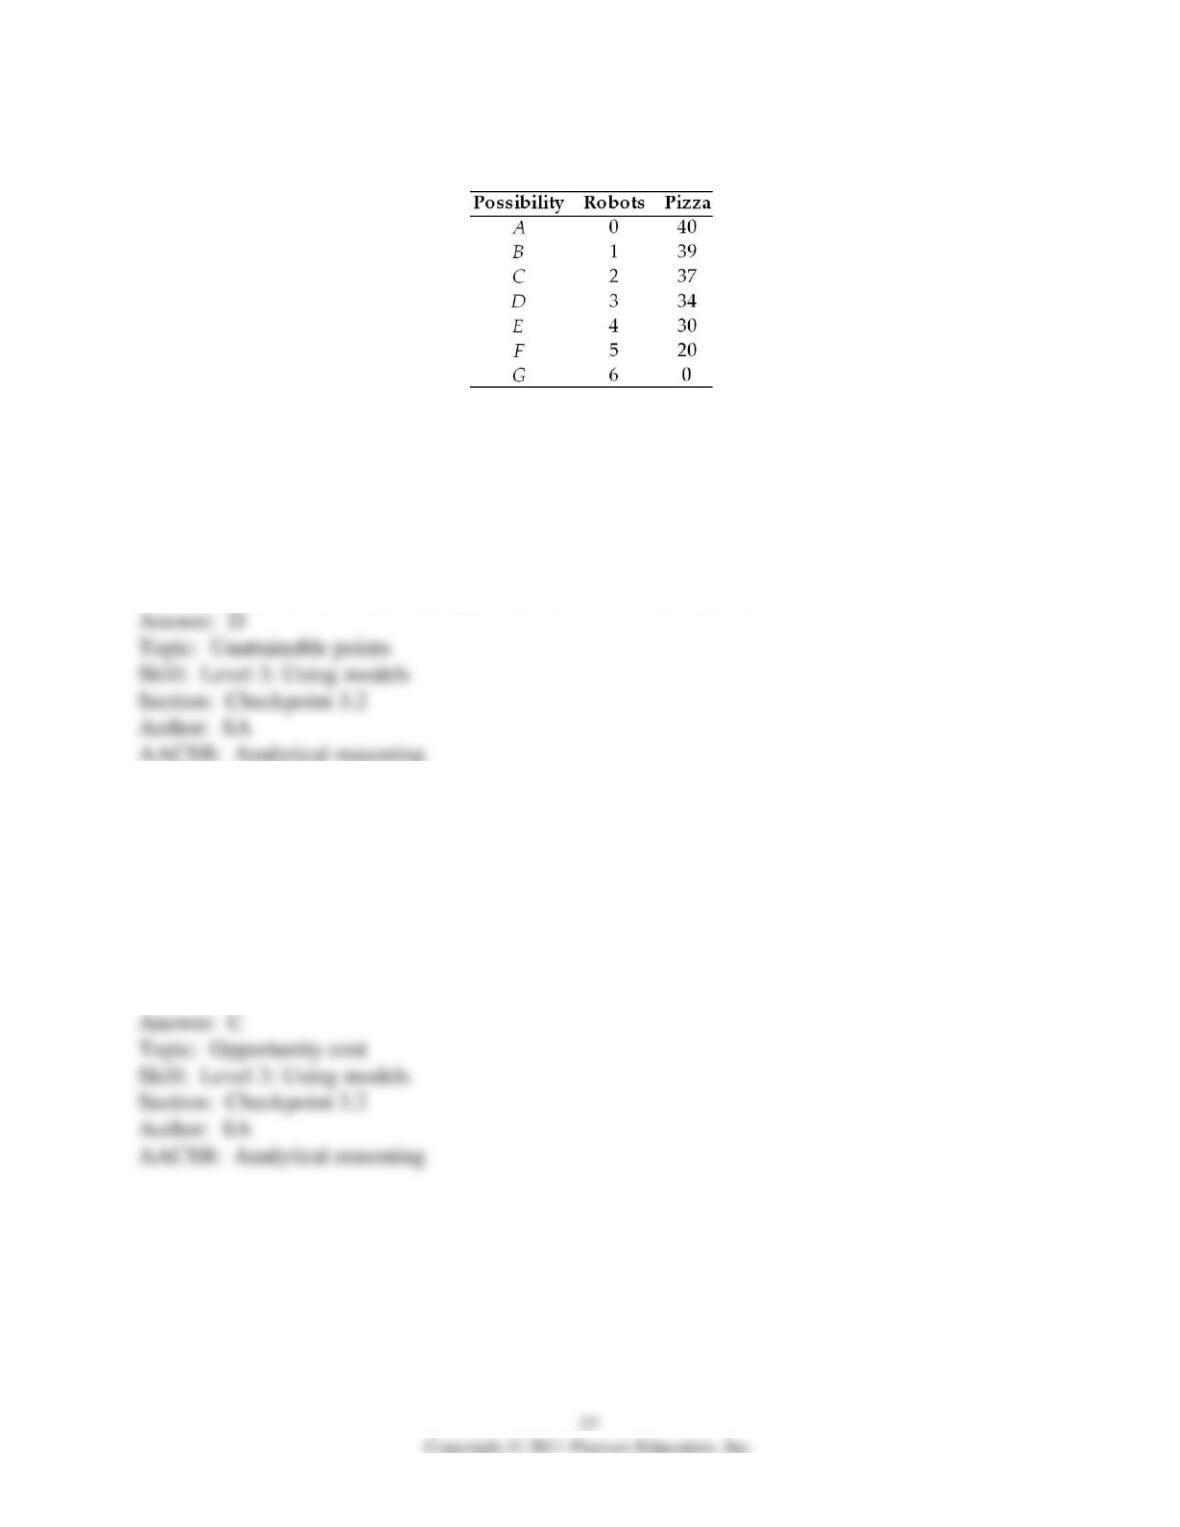
11) The table above shows a nation’s production possibilities frontier. If the nation wants to
produce 4 robots and 34 pizzas
A) it will shift the production possibilities frontier.
B) the opportunity cost is 9 pizzas.
C) the nation will be producing inefficiently.
D) it will be unable to do so because the production point is unattainable.
E) the nation will then be producing at a production efficient point.
12) The table above shows a nation’s production possibilities frontier. If the nation chooses to
increase the production of robots from 2 to 3 and it is on its PPF, it will have to forgo ________
pizzas.
A) 37
B) 34
C) 3
D) 35.5
E) None of the above answers is correct.
13) The table above shows a nation’s production possibilities frontier. The opportunity cost of a
robot between combination D and E is
A) 4 pizzas.
B) 34 pizzas.
C) 30 pizzas.
D) 1/4 of a pizza.
E) undefined because neither point is production efficient.
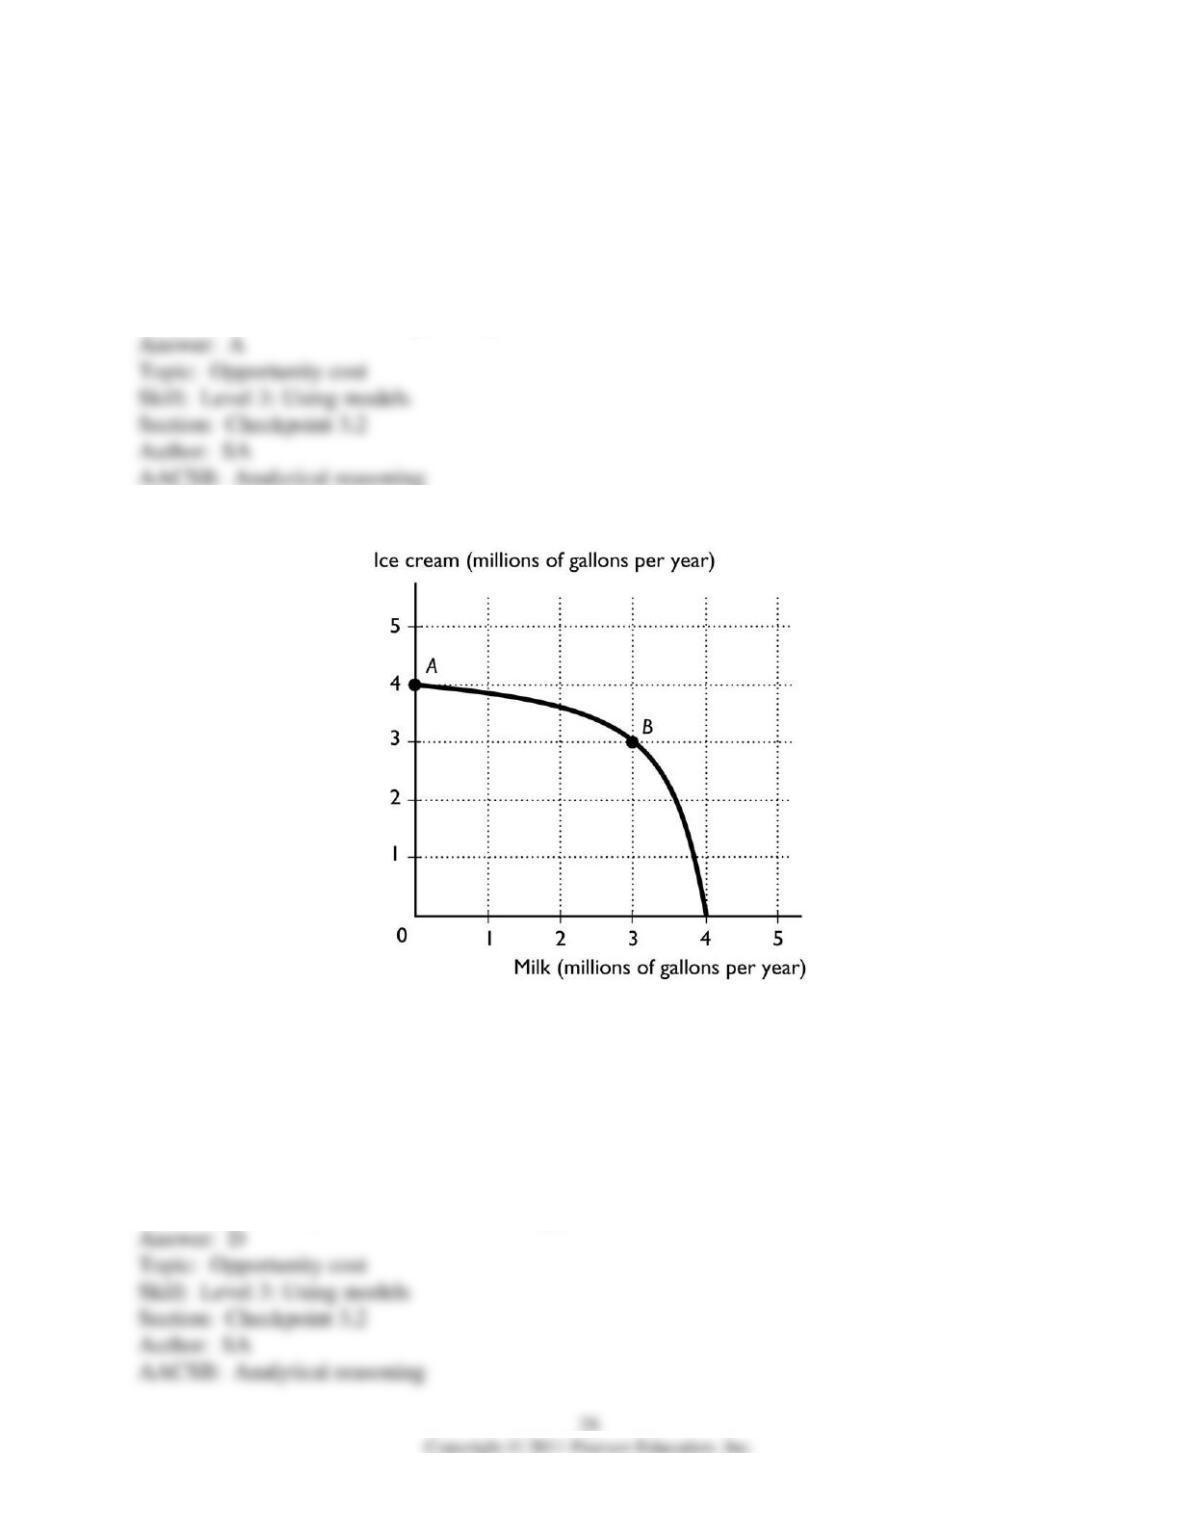
14) The figure above shows the production possibilities frontier for a country. The opportunity
cost of a gallon of milk between combination point A and B is
A) 4 gallons of ice cream for a gallon of milk.
B) 3 gallons of ice cream for a gallon of milk.
C) 1 gallon of ice cream for a gallon of milk.
D) 1/3 of a gallon of ice cream for a gallon of milk.
E) zero because at point A zero milk is being produced.
15) The figure above shows the production possibilities frontier for a country. If the economy is
operating at point B, then the opportunity cost of another million gallons of milk is
A) 4 gallons of ice cream for a gallon of milk.
B) 3 gallons of ice cream for a gallon of milk.
C) 1 gallon of ice cream for a gallon of milk.
D) 1/3 of a gallon of ice cream for a gallon of milk.
E) zero because after producing another million gallons of milk then zero gallons of ice cream
are produced.
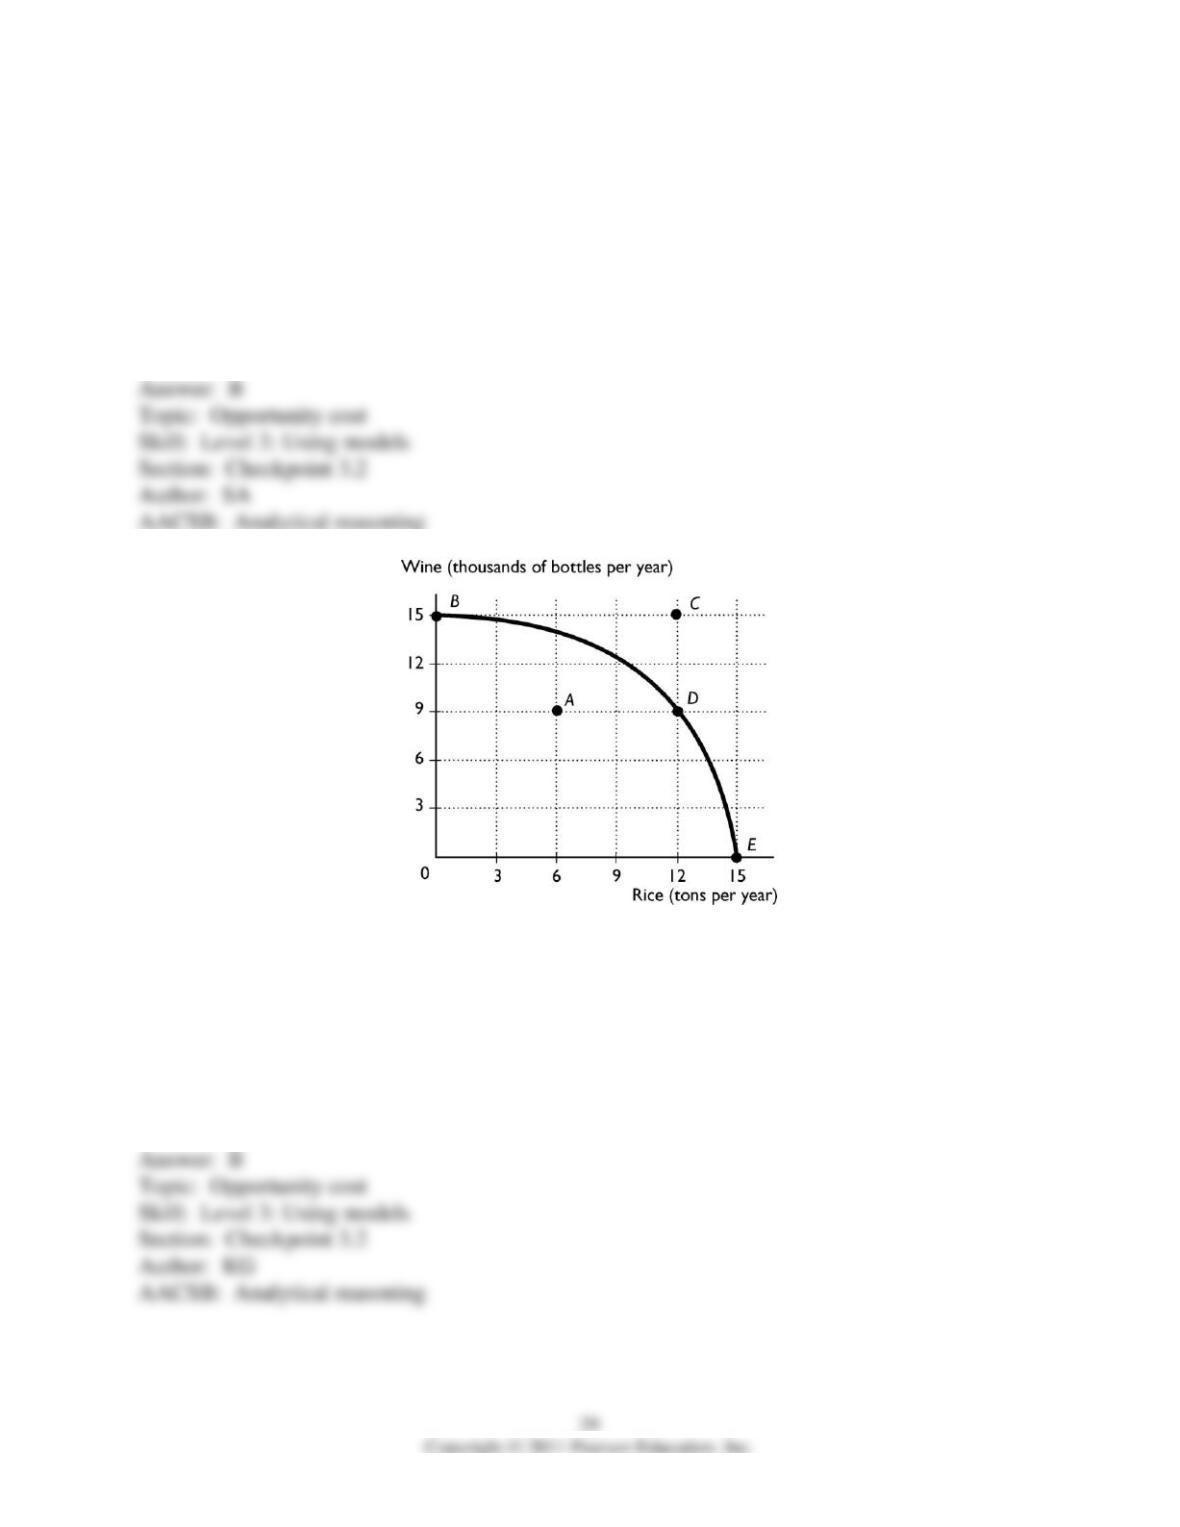
16) The above figure shows the production possibility frontier for a country. Suppose the
country is producing at point A. What is the opportunity cost of increasing the production of rice
to 12 tons?
A) 15 thousand bottles of wine
B) 6 thousand bottles of wine
C) 9 thousand bottles of wine
D) 12 tons of rice
E) Nothing, it is a free lunch

17) The above figure shows the production possibility frontier for a country. Suppose the
country is producing at point D. What is the opportunity cost of increasing the production of rice
to 15 tons?
A) 9 thousand bottles of wine
B) 6 thousand bottles of wine
C) 15 thousand bottles of wine
D) 12 tons of rice
E) Nothing, it is a free lunch
18) The above figure shows the production possibility frontier for a country. Suppose the
country is producing at point E. What would be the opportunity cost to increase the production
of wine to 9 thousand bottles?
A) Nothing, it is a free lunch
B) 12 tons of rice
C) 15 thousand bottles of wine
D) 9 thousand bottles of wine
E) 3 tons of rice
19) The above figure shows the production possibility frontier for a country. Suppose the
country is producing at point D. What would be the opportunity cost to move to point C?
A) 6 thousand bottles of wine
B) 15 thousand bottles of wine
C) Nothing, it is a free lunch
D) This movement is not possible without economic growth.
E) 12 tons of rice
20) The above figure shows the production possibility frontier for a country. Suppose the
country is producing at point A. What would be the opportunity cost to increase the production
of rice to 12 tons?
A) 6 thousand bottles of wine
B) 15 thousand bottles of wine
C) Nothing, it is a free lunch
D) 9 thousand bottles of wine
E) 6 tons of rice
21) The above figure shows the production possibility frontier for a country. What is the
opportunity cost per ton of rice to move from point B to point D?
A) 1000 bottles of wine
B) 500 bottles of wine
C) 2 bottles of wine
D) ½ of a bottle of wine
E) None of the above answers are correct.
22) The above figure shows the production possibility frontier for a country. What is the
opportunity cost per ton of rice to move from point D to E?
A) 3000 bottles of wine
B) 333 bottles of wine
C) 3 bottles of wine
D) 1/3 of a bottle of wine
E) None of the above answers are correct.
23) The above figure shows the production possibility frontier for a country. What is the
opportunity cost to move from point D to point E?
A) Nothing, it is a free lunch
B) 6 thousand bottles of wine
C) 15 thousand bottles of wine
D) 6 tons of rice
E) 9 thousand bottles of wine
24) The above figure shows the production possibility frontier for a country. What is the
opportunity cost to move from point D to point B?
A) 12 tons of rice
B) 15 thousand bottles of wine
C) Nothing, it is a free lunch
D) 6 thousand bottles of wine
E) 9 thousand bottles of wine
25) Moving from a point inside the production possibilities frontier to a point on the production
possibilities frontier, the opportunity cost of producing more of the good on the horizontal axis
A) increases.
B) decreases.
C) is constant.
D) is 0.
E) is infinite.
26) Suppose that in a PPF graph, wheat is on the vertical axis and jets are on the horizontal axis.
Moving down along the PPF, the
A) number of jets increases and the opportunity cost of jets increases.
B) amount of wheat increases and the opportunity cost of wheat increases.
C) number of jets increases and the opportunity cost of jets decreases.
D) amount of wheat increases and opportunity cost of wheat decreases.
E) opportunity cost of jets and wheat both increase.
27) Why is a production possibilities frontier bowed out (concave)?
A) The bowed shape reflects constant opportunity cost.
B) The bowed shape reflects decreasing opportunity cost.
C) The bowed shape indicates that opportunity cost at first decreases at a decreasing rate, and
then begins to decrease at an increasing rate.
D) The bowed shape indicates that opportunity cost at first increases at a decreasing rate, and
then begins to increase at an increasing rate.
E) The bowed shape reflects increasing opportunity cost.
28) The bowed out (concave) shape of the production possibilities curve implies that as
production of one good
A) increases, society must forgo increasing amounts of another good.
B) increases, society must forgo decreasing amounts of another good.
C) decreases, production of other goods decreases as well.
D) increases, production of other goods increases as well.
E) increases, society can obtain a free lunch.
29) The idea of increasing opportunity cost is reflected in the
A) bowed out shape of the production possibilities frontier.
B) bowed in shape of the production possibilities frontier.
C) linear shape of the production possibilities frontier.
D) positive slope of the production possibilities frontier.
E) fact that the PPF shows there are unattainable production points.
30) A bowed out production possibilities frontier shows
A) that resources are equally productive in all uses.
B) increasing opportunity cost.
C) that resources are not equally productive in all uses.
D) Both answers B and C are correct.
E) Both answers A and B are correct.
31) The opportunity cost of a good increases as more of it is produced because
A) there is no such thing as a free lunch.
B) resources are not equally productive in all activities.
C) producing more of a good requires additional resources.
D) the number of forgone alternatives also increases.
E) people want the good less as more is produced.
32) As an economy increasingly specializes in producing one good, the opportunity cost of that
good increases. The opportunity cost increases because
A) resources are not equally productive in all activities.
B) what must be paid to resources increases.
C) human wants are virtually unlimited.
D) not all goods are equally valuable.
E) as more of a good is produced, the profit from its production must rise.
33) As an economy produces more of one of the goods on a bowed out production possibilities
frontier, what happens to the opportunity cost of producing the good?
A) It remains constant.
B) It decreases.
C) It increases.
D) It might increase, decrease, or remain constant depending on how much people value the
additional units of the good.
E) None of these depict what happens to opportunity cost.
34) When a production possibilities frontier is bowed outward, as more of one good is produced,
its opportunity cost
A) increases.
B) decreases.
C) remains constant.
D) might increase, decrease, or remain constant depending on how much people value the
additional units of the good.
E) cannot be predicted.
35) A bowed out PPF reflects which of the following ideas?
i. increasing opportunity cost
ii. resources are not equally productive in all activities
iii. prices of goods increase over time
A) i only
B) i and ii
C) i and iii
D) ii and iii
E) i, ii, and iii
36) If there is increasing opportunity cost, then when moving downward on a production
possibilities frontier, the opportunity cost of the good on the horizontal axis ________ as more of
the good is produced.
A) increases and the PPF gets steeper
B) increases and the PPF gets flatter
C) decreases and the PPF gets steeper
D) decreases and the PPF gets flatter
E) does not change and the PPF gets steeper
37) A bowed out production possibility frontier shows that the
A) opportunity cost of a good is constant as more of the good is produced.
B) opportunity cost of a good decreases as more of the good is produced.
C) opportunity cost of a good increases as more of the good is produced.
D) opportunity cost relationship is linear.
E) opportunity cost of producing another good is negative.
38) Why does a nation experience increasing opportunity cost?
A) As the nation moves from a production point within the PPF to one on the PPF, opportunity
costs increase.
B) As the nation moves from a production point within the PPF to another point also within the
PPF, opportunity costs increase.
C) When the amount of resources increases, the opportunity cost of all goods and services
increases.
D) Resources are not equally productive in producing different kinds of goods and services.
E) Because the nation cannot produce at the unattainable production points that lie beyond the
PPF.
39) The fact of increasing opportunity cost when moving on the PPF means that
A) to increase the production of one product requires larger and larger sacrifices of the other
good.
B) to decrease the production of one product requires smaller and smaller sacrifices of the other
good.
C) to increase the production of one product requires smaller and smaller sacrifices of the other
good.
D) when the government forces a movement from one point on the PPF to another point, no
production is lost.
E) the PPF will be a negatively sloped straight line.
40) If the production possibilities frontier between two goods were a straight line, then the
opportunity cost of one good in terms of another would be
A) constant.
B) increasing.
C) decreasing.
D) zero.
E) either constant, increasing, or decreasing but more information is needed to determine which.
41) If the production possibilities frontier between two goods is a straight line, then the
A) opportunity cost is not a ratio.
B) resources are equally productive in both goods.
C) line does not qualify as a production possibilities frontier because the unattainable production
points are too close to the inefficient production points.
D) Both answers A and C are correct.
E) Both answers A and B are correct.
42) As an economy moves down along a straight line production possibilities frontier, what
happens to the opportunity cost of producing the good on the horizontal axis?
A) It remains constant.
B) It decreases.
C) It increases.
D) Above the midpoint it decreases until it equals 1 at the midpoint and then it increases.
E) None of these depict what happens to opportunity cost.
43) If the production possibilities frontier between bottled water and water in a jug is a straight
line, which of the following statements would be correct?
A) A large amount of unemployment must exist.
B) Resources are equally productive at producing either product.
C) There is no tradeoff between the two goods.
D) There is no decrease in the production of one good when the production of the other is
increased.
E) Producing more of one good gives the economy a free lunch.
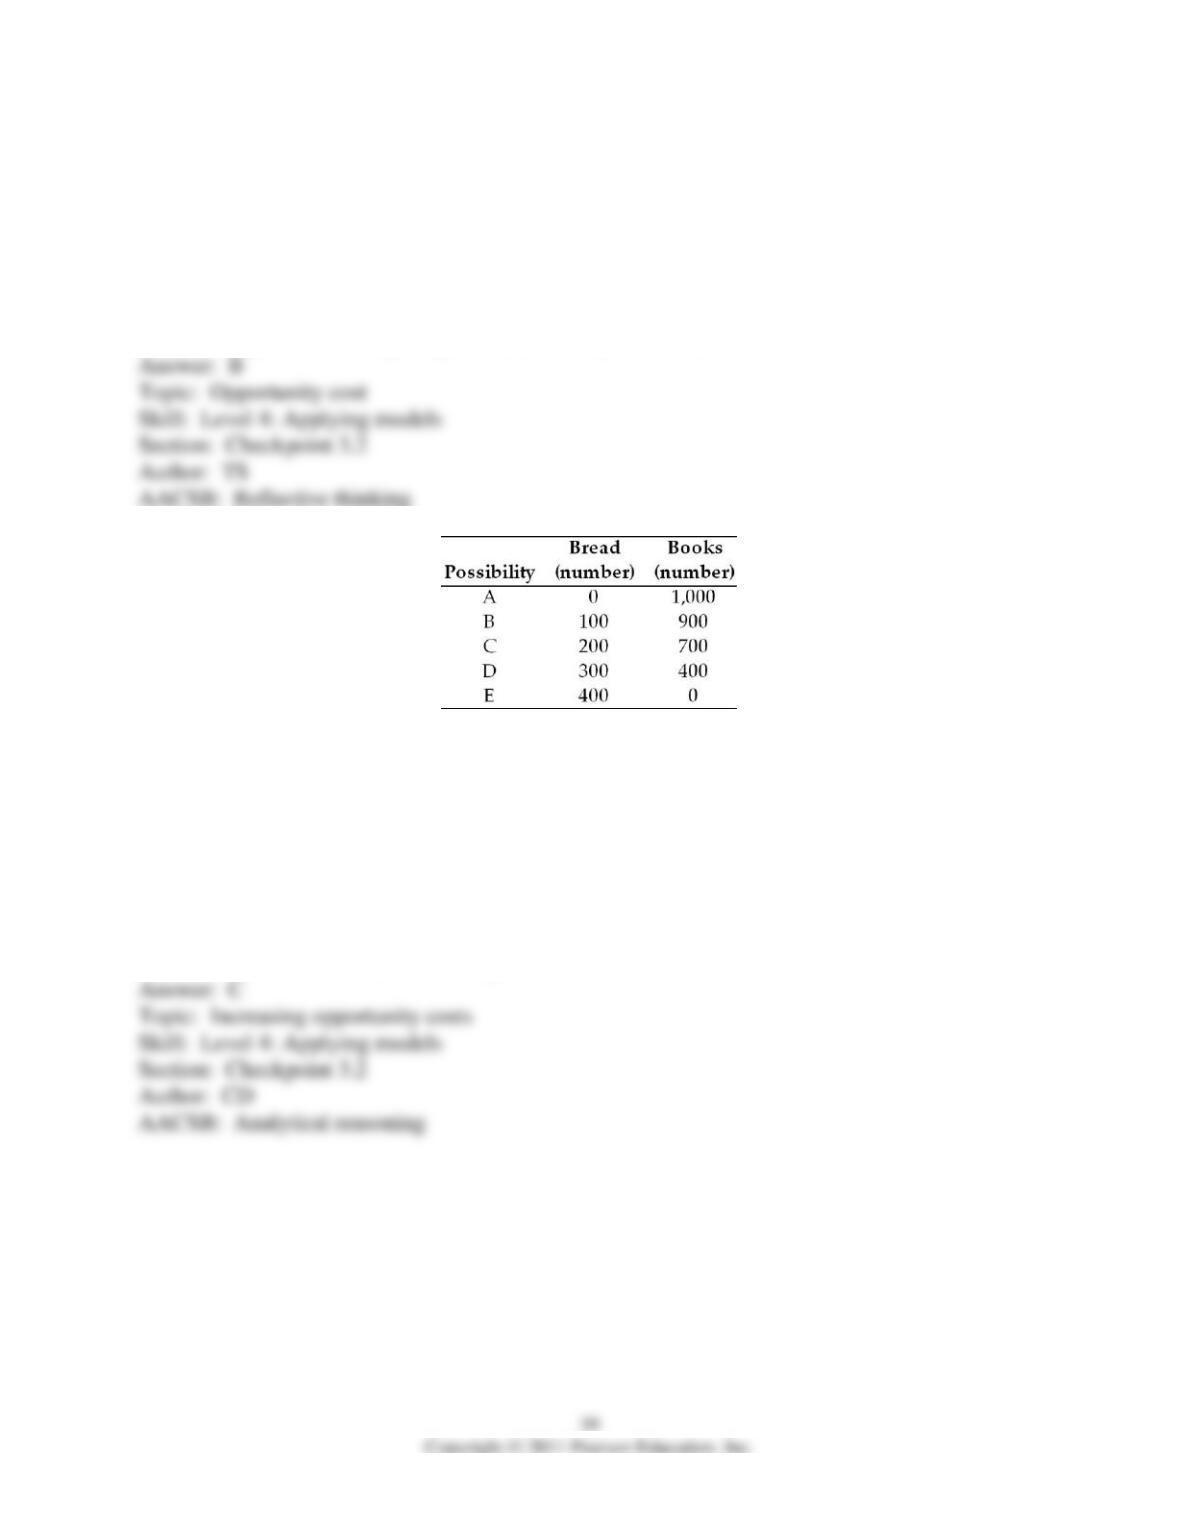
44) The table above shows the production possibilities for an economy. Drawing a PPF with
books on the vertical axis and bread on the horizontal axis, a movement from possibility B to
possibility C to possibility D shows the opportunity cost of ________ moving down along the
PPF.
A) books decreasing
B) bread decreasing
C) bread increases
D) books is constant
E) books and bread are both increasing
45) The table above shows the production possibilities for an economy. The opportunity cost of a
loaf of bread is ________ when moving from possibility B to possibility C.
A) 1/2 of a book
B) 2 books
C) 200 books
D) 100 loaves of bread
E) 1 loaf of bread
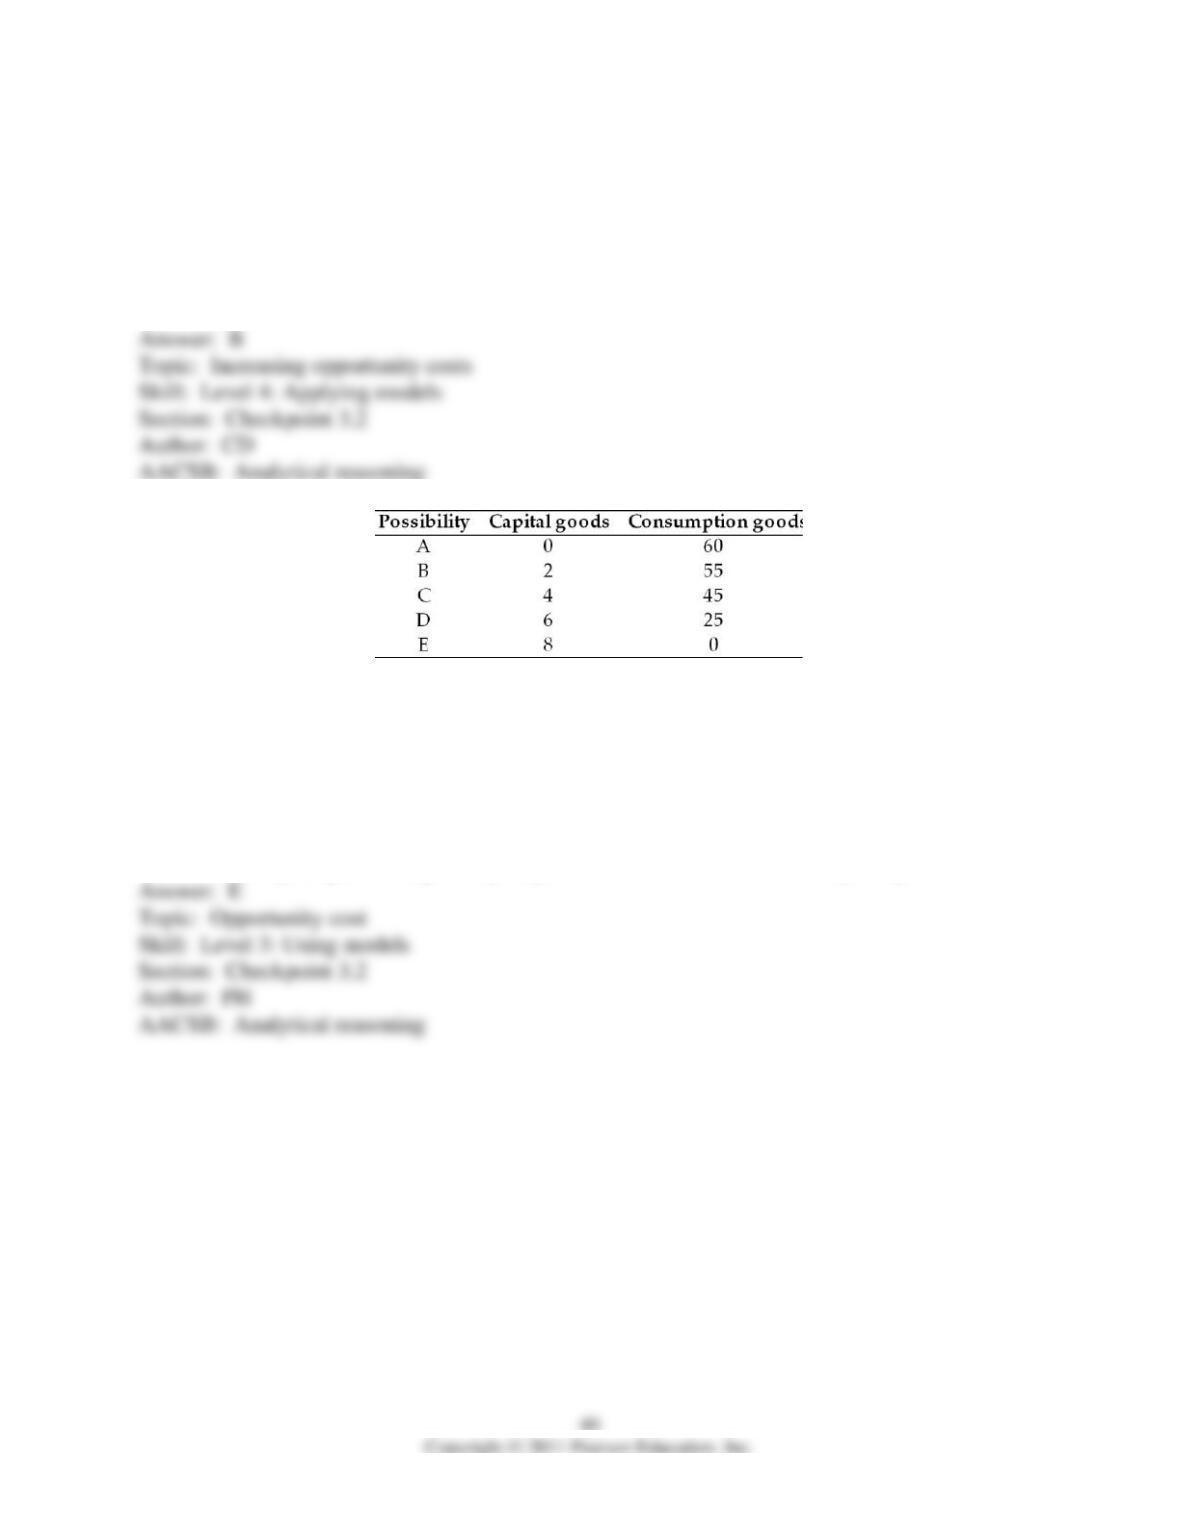
46) The table above presents the production possibilities frontier for a nation. Using the
information in the table, moving from possibility C to B means that
A) 4 units of capital goods are given up to get 55 units of consumption goods.
B) 2 units of capital goods are given up to get 55 additional units of consumption goods.
C) 4 units of capital goods are given up to get 10 additional units of consumption goods.
D) 4 units of capital goods are given up to get 45 units of consumption goods.
E) 2 units of capital goods are given up to get 10 additional units of consumption goods.