71
Copyright © 2011 Pearson Education, Inc.
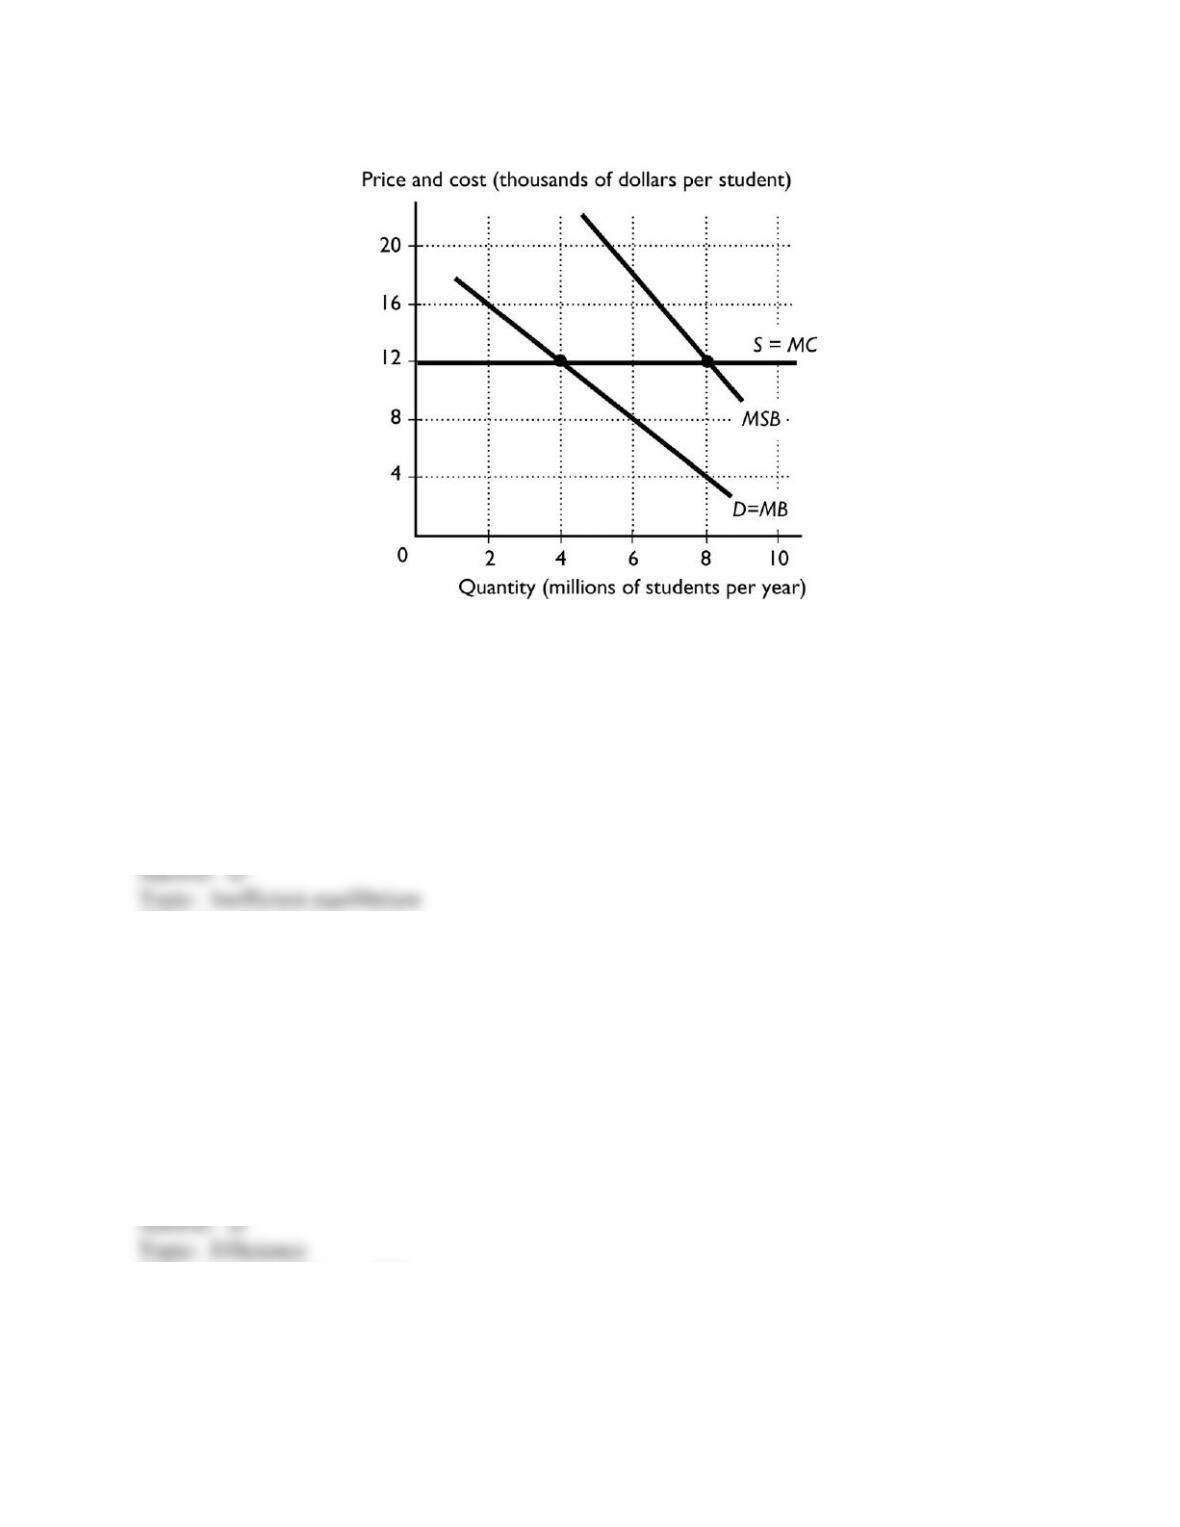
74) The figure above shows an education market in which the government is providing
households with vouchers. What is the efficient quantity of students?
A) 2 million
B) 4 million
C) 6 million
D) more than 6 million
E) more than 4 million and less than 6
Skill: Level 3: Using models
Section: Checkpoint 10.3
Author: SA
AACSB: Analytical reasoning

72
Copyright © 2011 Pearson Education, Inc.
75) The figure above shows an education market in which the government is providing
households with vouchers. What is the dollar value of a voucher in this market?
A) $4,000
B) $8,000
C) $12,000
D) $16,000
E) None of the above answers is correct.
Skill: Level 4: Applying models
Section: Checkpoint 10.3
Author: SA
AACSB: Analytical reasoning
76) The figure above shows an education market in which the government is providing
households with vouchers. In total, how much do the schools receive for a student?
A) $4,000
B) $8,000
C) $12,000
D) $16,000
E) $20,000
Skill: Level 4: Applying models
Section: Checkpoint 10.3
Author: SA
AACSB: Analytical reasoning
77) The figure above shows an education market in which the government is providing
households with vouchers. Excluding the voucher, what do the students pay the schools?
A) $4,000
B) $8,000
C) $12,000
D) $16,000
E) $0
Skill: Level 4: Applying models
Section: Checkpoint 10.3
Author: SA
AACSB: Analytical reasoning
73
Copyright © 2011 Pearson Education, Inc.
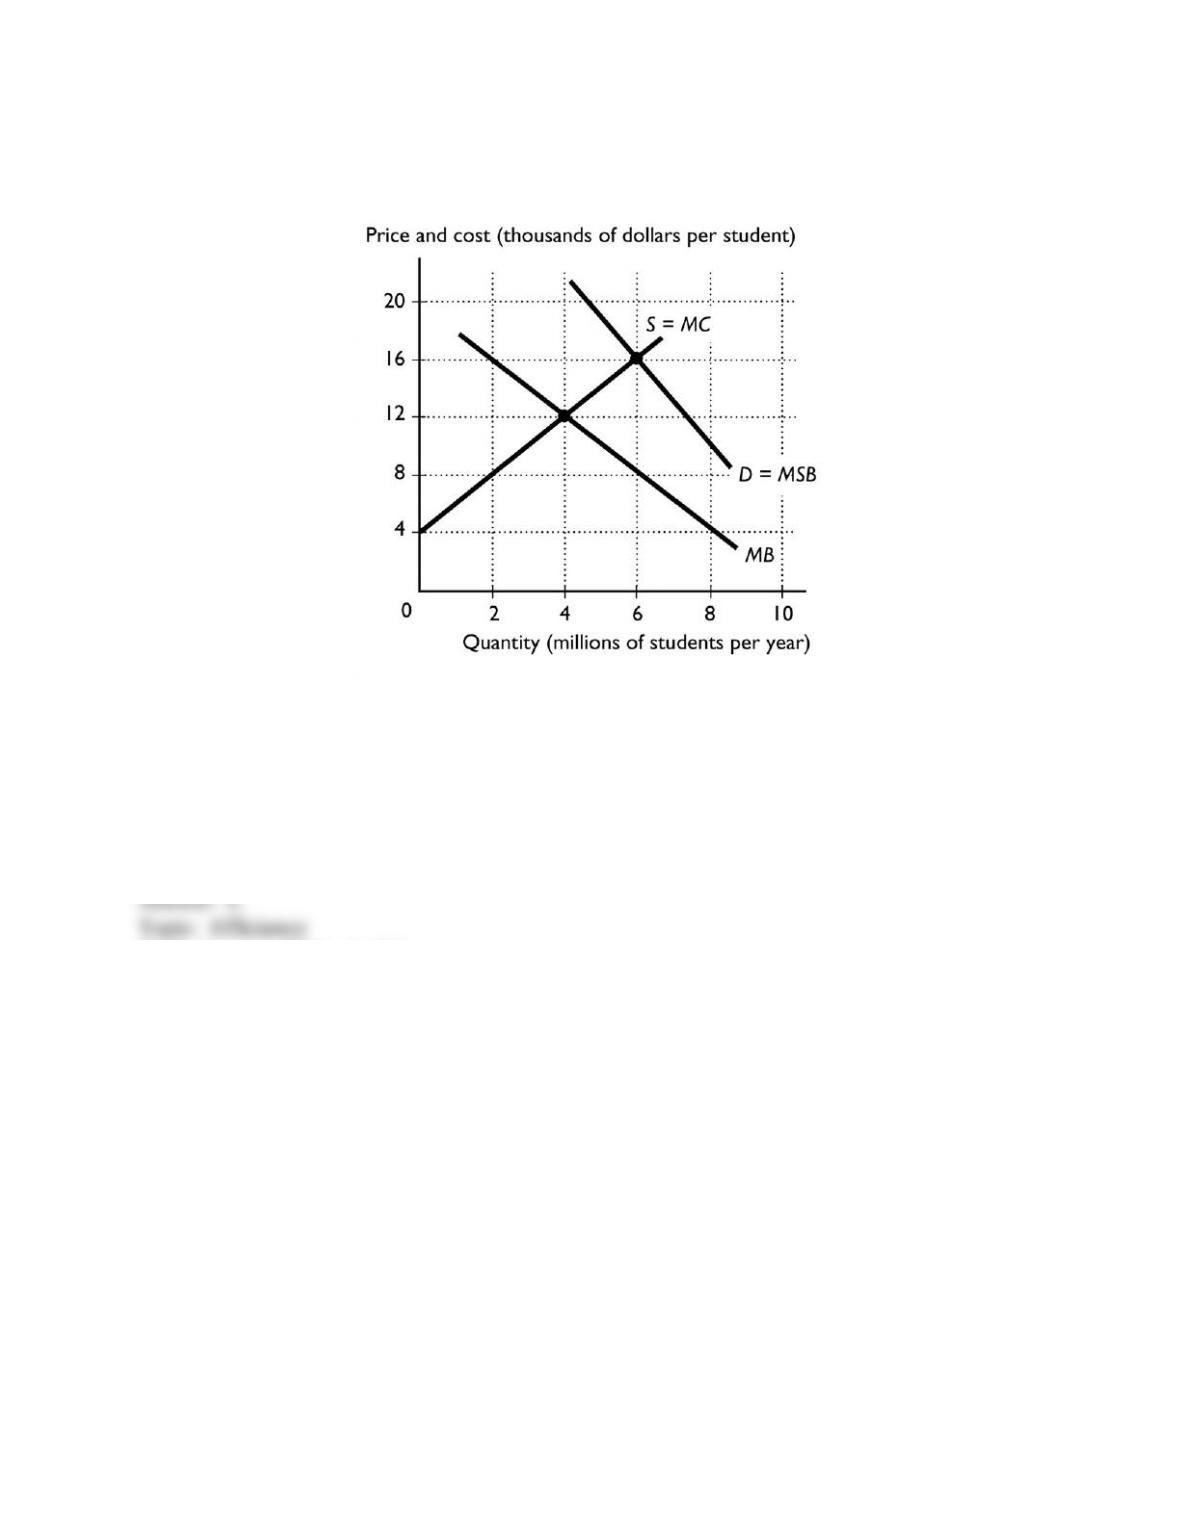
78) The figure shows the market for college education. If the market for education is competitive
and with no government intervention, the equilibrium quantity of college students is ________
million and the efficient quantity of college students is ________ million.
A) 2; 4
B) 8; 2
C) 8; 4
D) 4; 8
E) 0; 10
Skill: Level 3: Using models
Section: Checkpoint 10.3
Author: MR
AACSB: Analytical reasoning
79) The figure shows the market for college education. The efficient number of students is
A) less than 4 million.
B) more than 4 million and less than 8 million.
C) 4 million.
D) 8 million.
E) more than 8 million.
Skill: Level 3: Using models
Section: Checkpoint 10.3
Author: CD
AACSB: Analytical reasoning

74
Copyright © 2011 Pearson Education, Inc.
80) The figure shows the market for college education. In order for the efficient amount of
education to occur, the government could provide a subsidy of ________ per student.
A) $4,000
B) $8,000
C) $12,000
D) $20,000
E) $16,000
Skill: Level 3: Using models
Section: Checkpoint 10.3
Author: CD
AACSB: Analytical reasoning
81) The figure shows the market for college education. In order for the efficient amount of
education to occur, the government could provide a voucher of ________ per student.
A) $4,000
B) $8,000
C) $12,000
D) $20,000
E) $16,000
Skill: Level 3: Using models
Section: Checkpoint 10.3
Author: MR
AACSB: Analytical reasoning
75
Copyright © 2011 Pearson Education, Inc.
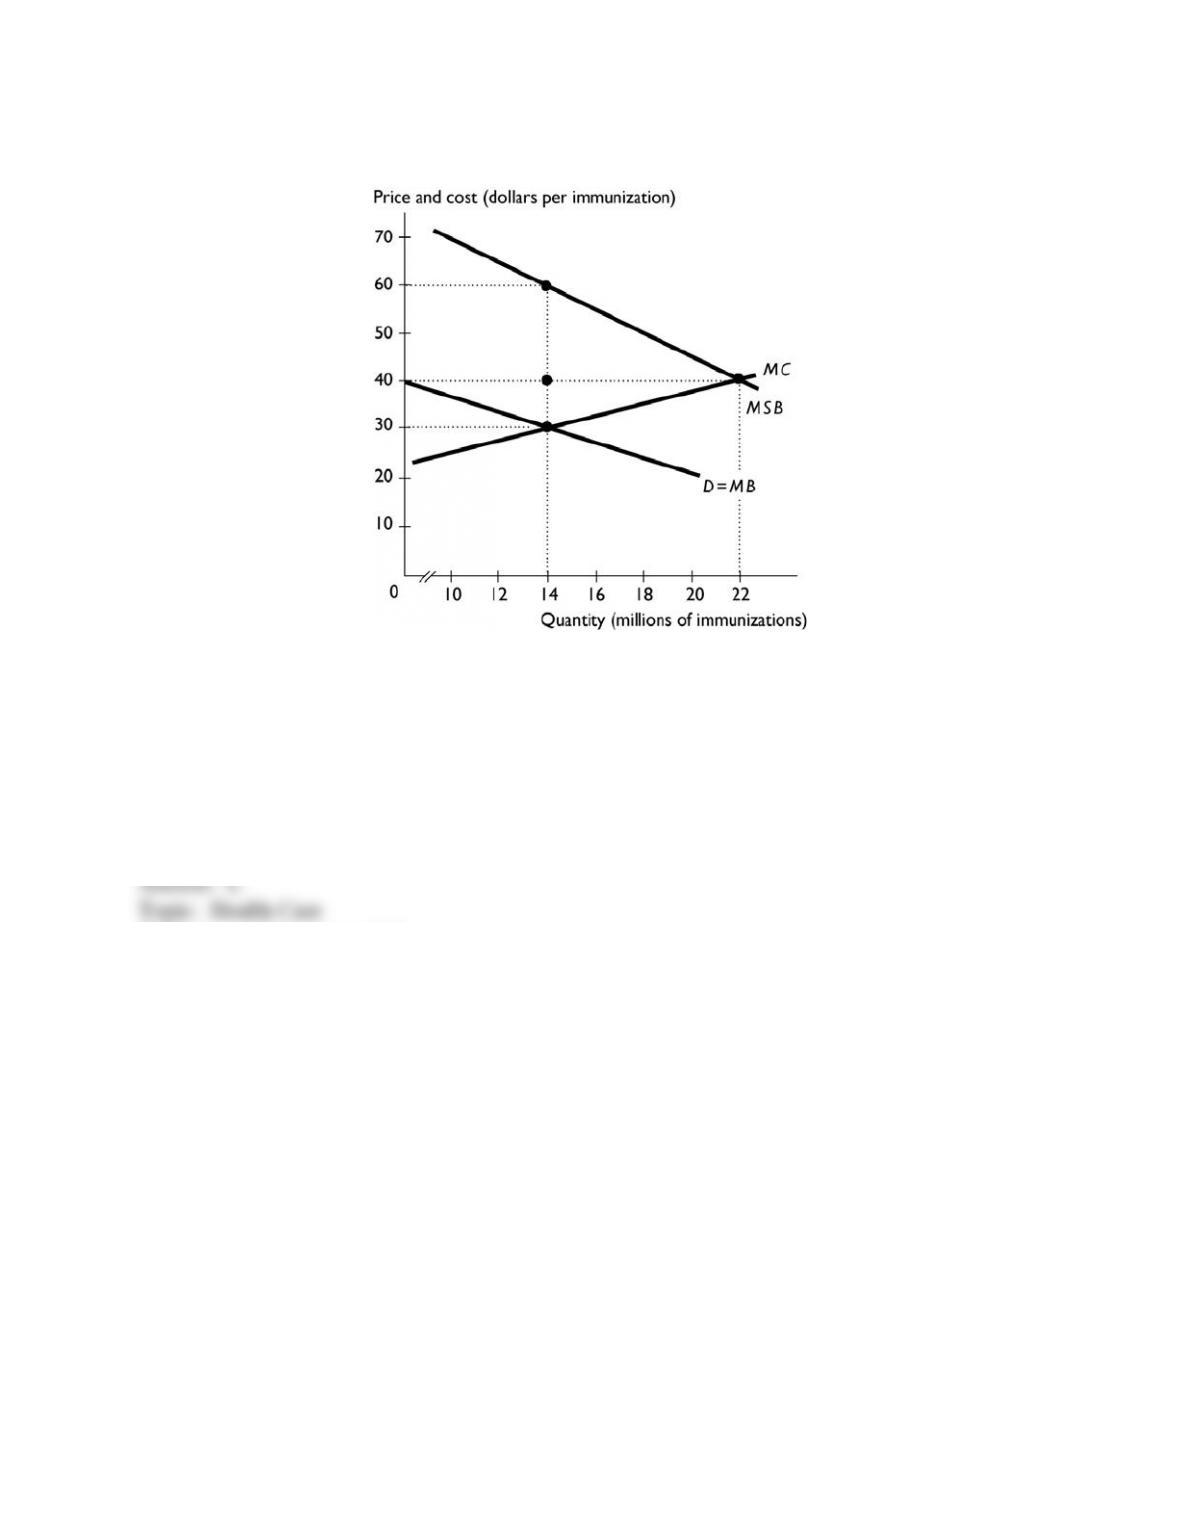
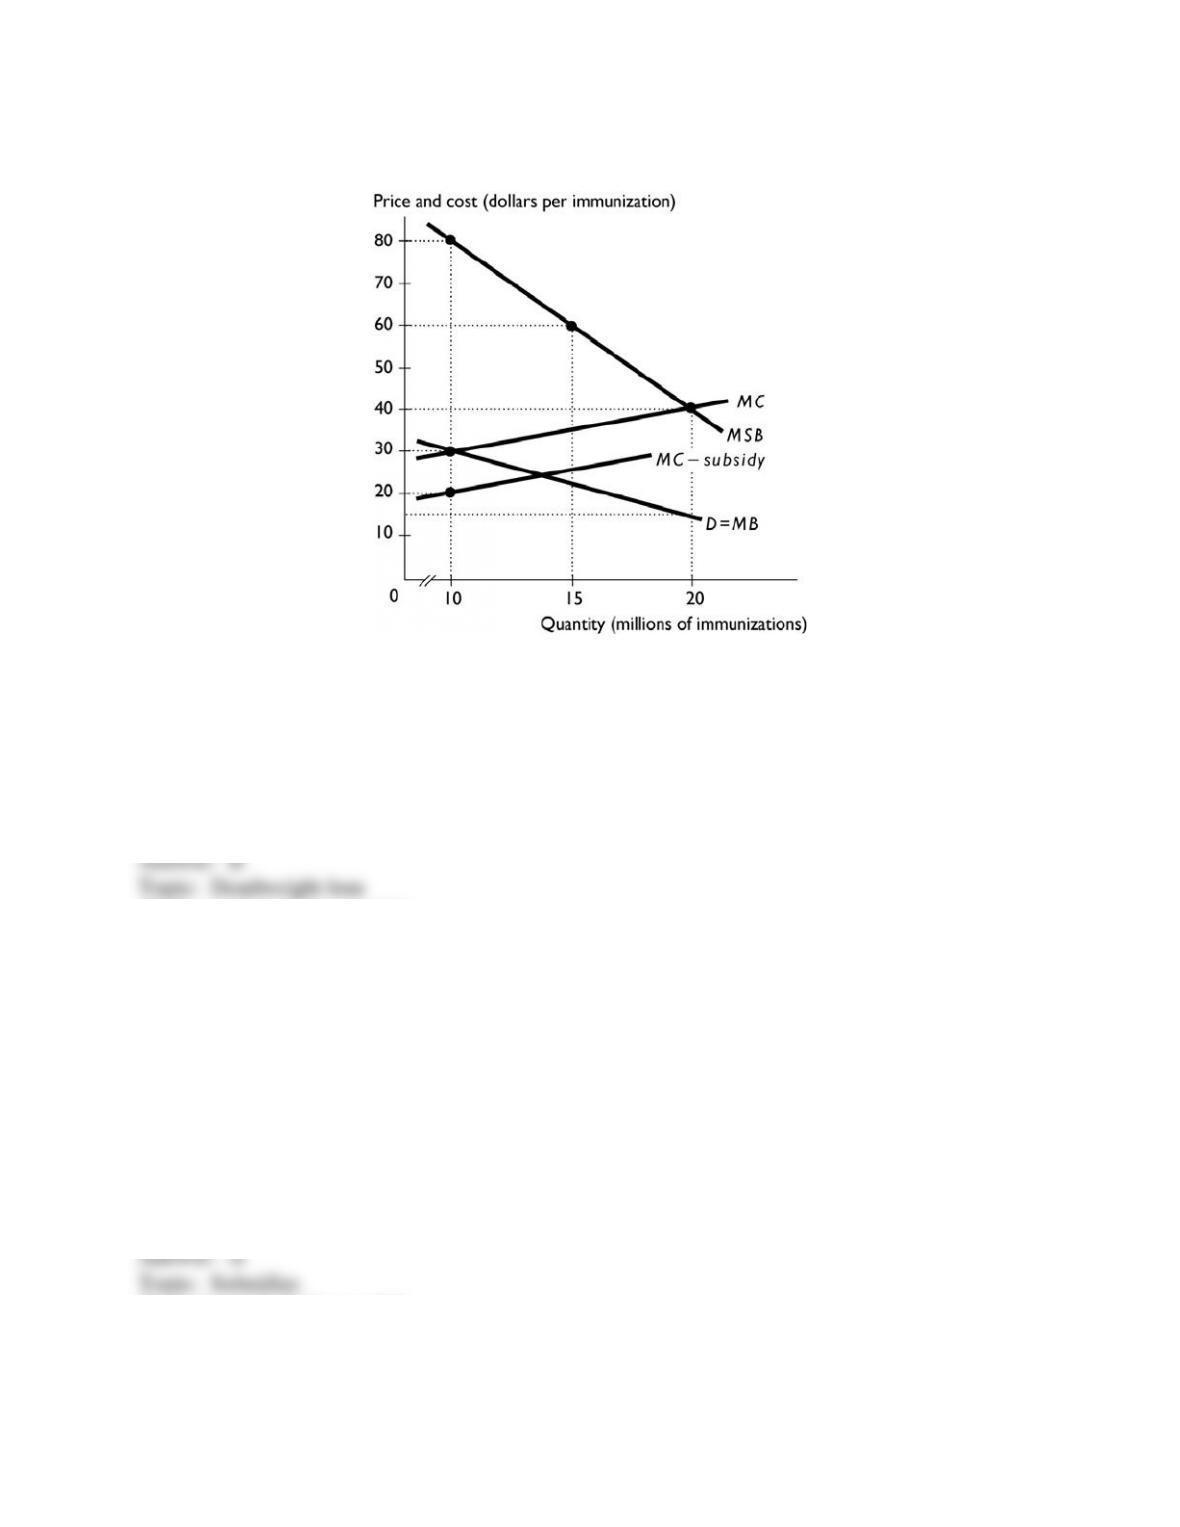
82) The figure above shows the market for annual influenza immunizations the United States.
With no government intervention, the market equilibrium is at a price of ________ and
________ million immunizations per year.
A) $60; 14
B) $40; 14
C) $30; 14
D) $40; 22
E) None of the above answers are correct.
Skill: Level 3: Using models
Section: Checkpoint 10.3
Author: KG
AACSB: Analytical reasoning

76
Copyright © 2011 Pearson Education, Inc.
83) The figure above shows the market for annual influenza immunizations the United States.
The market equilibrium with no government intervention is ________ because health care
generates ________.
A) efficient; positive external benefits
B) inefficient; positive external benefits
C) inefficient; positive external costs
D) efficient; positive external costs
E) inefficient; public goods
Skill: Level 3: Using models
Section: Checkpoint 10.3
Author: KG
AACSB: Analytical reasoning
84) The figure above shows the market for annual influenza immunizations the United States. If
there is NO external benefit from health care and the government does not intervene in the
market, then the equilibrium price of immunizations is
A) $30
B) $20
C) $40
D) $60
E) $70
Skill: Level 3: Using models
Section: Checkpoint 10.3
Author: KG
AACSB: Analytical reasoning
85) The figure above shows the market for annual influenza immunizations the United States.
The efficient quantity of immunizations is
A) 14 million per year.
B) 10 million per year.
C) Between 14 and 21 million per year.
D) Less than 10 million per year.
E) 22 million per year.
Skill: Level 3: Using models
Section: Checkpoint 10.3
Author: KG
AACSB: Analytical reasoning
77
Copyright © 2011 Pearson Education, Inc.
86) The figure above shows the market for annual influenza immunizations the United States.
The marginal external benefit associated with immunizing 14 million people is ________ per
person per year.
A) $40
B) $20
C) $90
D) $30
E) $60
Skill: Level 3: Using models
Section: Checkpoint 10.3
Author: KG
AACSB: Analytical reasoning
87) The figure above shows the market for annual influenza immunizations the United States. If
the government does not intervene in this market, the number of immunizations per year is
________ and the efficient number of immunizations per year is ________.
A) 14 million; 20 million
B) 20 million; 22 million
C) 14 million; 22 million
D) 14 million; 10 million
E) 10 million; 14 million
Skill: Level 3: Using models
Section: Checkpoint 10.3
Author: KG
AACSB: Analytical reasoning
78
Copyright © 2011 Pearson Education, Inc.
88) The figure above shows the market for annual influenza immunizations the United States. If
the government does not intervene in this market, deadweight loss equals ________.
A) $350 million
B) $250 million
C) $500 million
D) $600 million
E) $37.5 million
Skill: Level 3: Using models
Section: Checkpoint 10.3
Author: KG
AACSB: Analytical reasoning
89) The figure above shows the market for annual influenza immunizations the United States. If
the government intervenes in the market and provides a subsidy to providers of immunizations to
immunize the efficient number of people, the amount of the subsidy is ________ per person.
A) $25
B) $50
C) $35
D) $15
E) $40
Skill: Level 3: Using models
Section: Checkpoint 10.3
Author: KG
AACSB: Analytical reasoning
79
Copyright © 2011 Pearson Education, Inc.
90) The figure above shows the market for annual influenza immunizations the United States. If
the government intervenes in the market and provides a $10 subsidy to providers of
immunizations, the number of people immunized is ________.
A) 20 million per year.
B) exactly 10 million per year.
C) between 15 and 20 million per year.
D) less than 10 million per year.
E) more than 10 million and less than 15 million.
Skill: Level 3: Using models
Section: Checkpoint 10.3
Author: KG
AACSB: Analytical reasoning
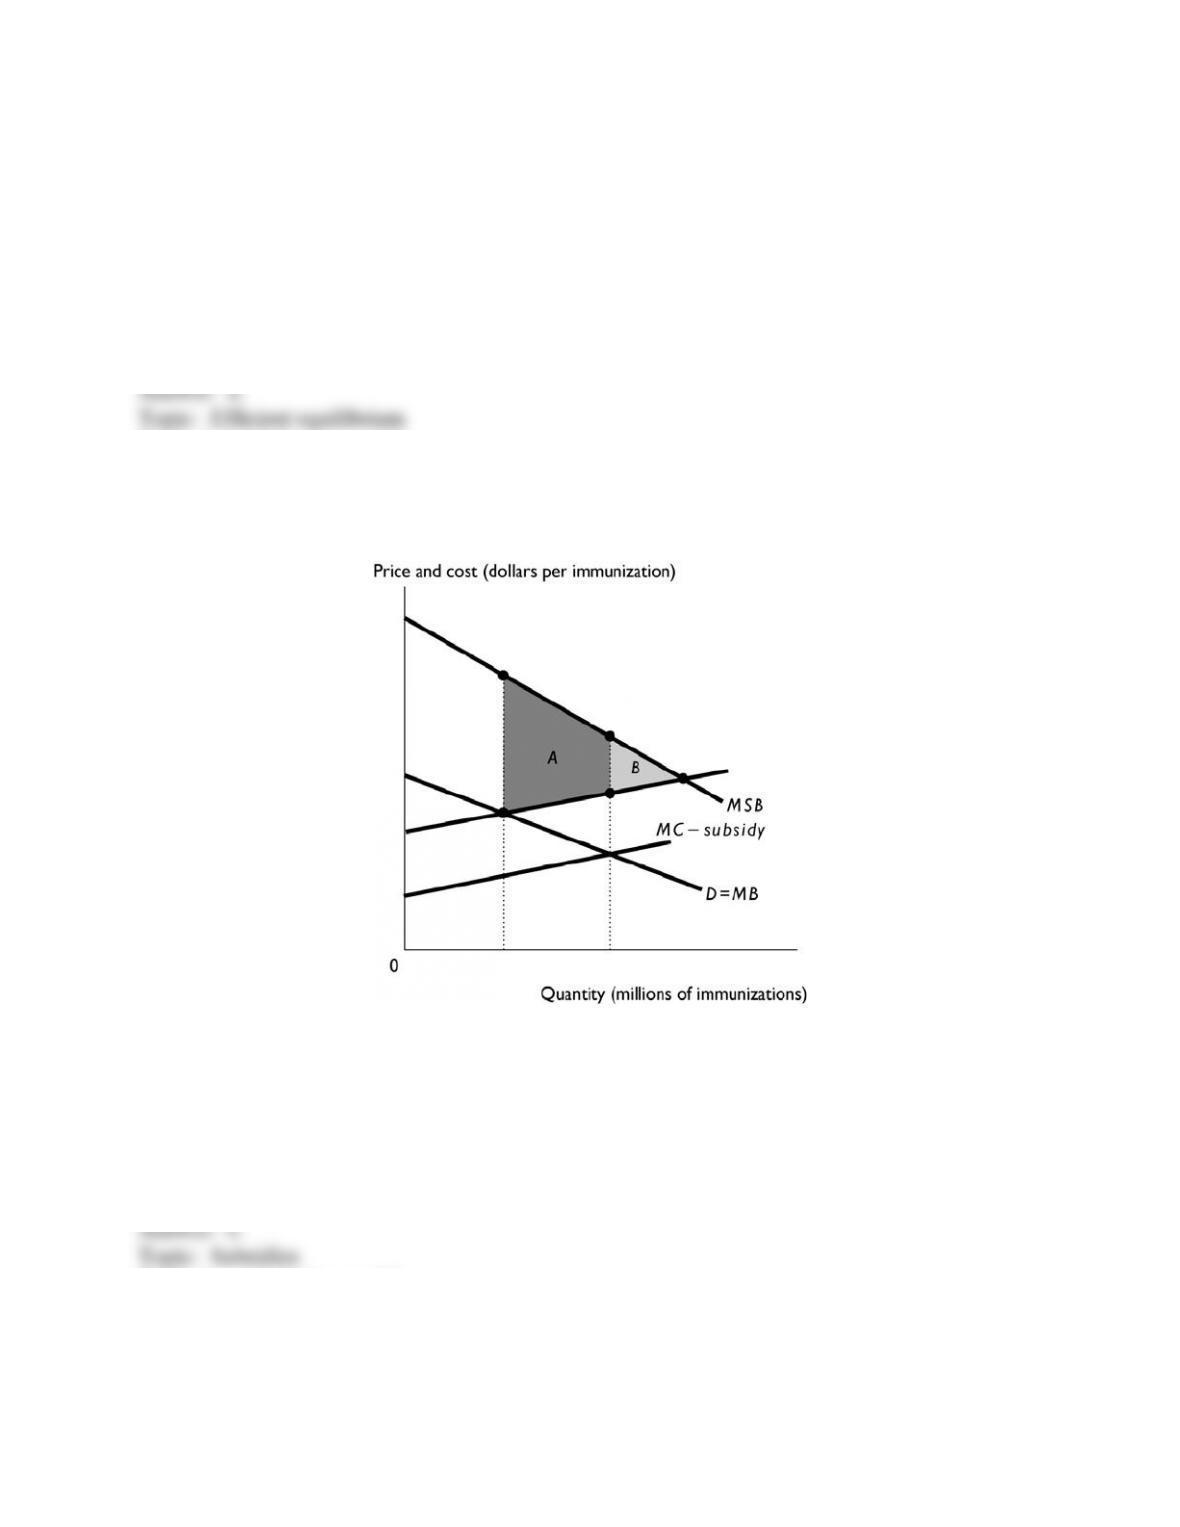
91) The figure above shows the market for annual influenza immunizations the United States.
Area A is the
A) the total deadweight loss when there is not the illustrated subsidy.
B) remaining deadweight loss when there is the illustrated subsidy.
C) the gain in efficiency from the illustrated subsidy.
D) the loss in efficiency from the illustrated subsidy.
E) the consumer surplus with the illustrated subsidy.
Skill: Level 3: Using models
Section: Checkpoint 10.3
Author: KG
AACSB: Analytical reasoning
80
Copyright © 2011 Pearson Education, Inc.
92) The figure above shows the market for annual influenza immunizations the United States.
Area B is the
A) gain in efficiency from the illustrated subsidy.
B) remaining deadweight loss when there is the illustrated subsidy.
C) deadweight loss when there is not the illustrated subsidy.
D) the equilibrium with the illustrated subsidy.
E) the loss in efficiency from the illustrated subsidy.
Skill: Level 3: Using models
Section: Checkpoint 10.3
Author: KG
AACSB: Analytical reasoning
93) The figure above shows the market for annual influenza immunizations the United States.
Area A + Area B is the
A) deadweight loss when there is not the illustrated subsidy.
B) loss in efficiency from the illustrated subsidy.
C) gain in efficiency from the illustrated subsidy.
D) remaining deadweight loss when there is the illustrated subsidy.
E) the equilibrium with the illustrated subsidy.
Skill: Level 3: Using models
Section: Checkpoint 10.3
Author: KG
AACSB: Analytical reasoning
94) The benefit the consumer of a good or service receives is the
A) social benefit.
B) external benefit.
C) private benefit.
D) public benefit.
E) consumption benefit.
Skill: Level 1: Definition
Section: Checkpoint 10.3
Author: STUDY GUIDE
AACSB: Reflective thinking