51
Copyright © 2011 Pearson Education, Inc.
45) If the U.S. government imposes a tariff on imported steel, who else besides U.S. steel
producers gains from the tariff?
A) U.S. steel consumers
B) the U.S. government
C) U.S. importers of steel
D) foreign exporters of steel
E) the foreign government
Skill: Level 2: Using definitions
Section: Checkpoint 9.3
Author: TPS
AACSB: Reflective thinking
46) Of the following, who gains from a tariff?
A) the government of the importing country
B) the government of the exporting country
C) consumers in the importing country
D) producers in the exporting country
E) both the government of the exporting country and the government of the importing country
Skill: Level 2: Using definitions
Section: Checkpoint 9.3
Author: NAU
AACSB: Reflective thinking
47) Which type of policy raises the most revenue for the government?
A) tariff
B) quota
C) voluntary export restraints
D) If they are set at the same level, all of the above raise the same amount of revenue.
E) None of the above answers is correct because none of the policies raise revenue for the
government.
Skill: Level 2: Using definitions
Section: Checkpoint 9.3
Author: NAU
AACSB: Reflective thinking
52
Copyright © 2011 Pearson Education, Inc.
48) The difference between a tariff and a quota is that the tariff revenue goes to the
A) domestic consumer.
B) domestic producer.
C) domestic government.
D) holder of the quota license.
E) foreign government.
Skill: Level 2: Using definitions
Section: Checkpoint 9.3
Author: NAU
AACSB: Reflective thinking
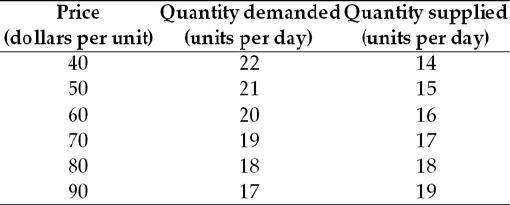
49) The table above gives the domestic demand and supply schedules for a good. Suppose the
world price of the good is $40 and the government imposes a $20 per unit tariff. How much will
the government collect as tariff revenue?
A) $160
B) $320
C) $80
D) $240
E) $360
Skill: Level 4: Applying models
Section: Checkpoint 9.3
Author: NAU
AACSB: Analytical reasoning

53
Copyright © 2011 Pearson Education, Inc.
50) A quota is
A) a tax on imports.
B) a specified minimum amount that must be imported.
C) a specified maximum amount that can be imported.
D) a tariff on exports.
E) the minimum amount that domestic firms can dump.
Skill: Level 1: Definition
Section: Checkpoint 9.3
Author: WM
AACSB: Reflective thinking
51) A quota is a
A) quantitative restriction on an import imposed by the importing country.
B) quantitative restriction on an import imposed by the exporting country.
C) restriction on how much a customer can buy of a scarce good imposed by the seller.
D) tax that is imposed on a good when it crosses an international boundary.
E) trade barrier that does not harm domestic consumers of the good or service.
Skill: Level 1: Definition
Section: Checkpoint 9.3
Author: TS
AACSB: Reflective thinking
52) When governments specify the maximum amount of a good that may be imported in a given
period of time, they are establishing a
A) tariff.
B) quota.
C) dynamic tariff.
D) tax.
E) dumping limit.
Skill: Level 1: Definition
Section: Checkpoint 9.3
Author: SB
AACSB: Reflective thinking

54
Copyright © 2011 Pearson Education, Inc.
53) A specified maximum amount of the good that may be imported in a given period of time is
a
A) forcible limit.
B) quota.
C) tariff.
D) sanction.
E) dumping limit.
Skill: Level 1: Definition
Section: Checkpoint 9.3
Author: JC
AACSB: Reflective thinking
54) The imposition of a quota ________ domestic production, ________ imports, and ________
domestic purchases.
A) increases; decreases; decreases
B) increases; decreases; increases
C) decreases; increases; decreases
D) decreases; decreases; decreases
E) increases; increases; increases
Skill: Level 3: Using models
Section: Checkpoint 9.3
Author: WM
AACSB: Analytical reasoning
55) Of the following, who gains with a quota?
A) domestic buyers of the good or service
B) the importer of the good or service
C) the foreign exporter of the good or service
D) the government of the importing nation
E) the government of the exporting nation
Skill: Level 2: Using definitions
Section: Checkpoint 9.3
Author: TS
AACSB: Reflective thinking

55
Copyright © 2011 Pearson Education, Inc.
56) If the United States imposed a quota on the amount of salmon imported from Chile, the result
would be ________ salmon prices in the United States and ________ in the quantity of salmon
demanded in the United States.
A) higher; an increase
B) higher; a decrease
C) lower; an increase
D) lower; a decrease
E) higher; no change
Skill: Level 3: Using models
Section: Checkpoint 9.3
Author: JC
AACSB: Reflective thinking
57) If a quota is imposed on imports of shrimp into the United States, U.S. consumer surplus
from shrimp will ________ and U.S. producer surplus from shrimp will ________.
A) increase; increase
B) increase; decrease
C) decrease; increase
D) decrease; decrease
E) increase; not change
Skill: Level 4: Applying models
Section: Checkpoint 9.3
Author: MR
AACSB: Analytical reasoning
58) If an import quota is imposed on imports of shrimp into the United States, U.S. consumer
surplus from shrimp will ________ and U.S. total surplus from shrimp will ________.
A) increase; increase
B) increase; decrease
C) decrease; increase
D) decrease; decrease
E) increase; not change
Skill: Level 4: Applying models
Section: Checkpoint 9.3
Author: MR
AACSB: Analytical reasoning

56
Copyright © 2011 Pearson Education, Inc.
59) If an import quota is imposed on imports of shrimp into the United States, U.S. producer
surplus from shrimp will ________ and U.S. total surplus from shrimp will ________.
A) increase; increase
B) increase; decrease
C) decrease; increase
D) decrease; decrease
E) increase; not change
Skill: Level 4: Applying models
Section: Checkpoint 9.3
Author: MR
AACSB: Analytical reasoning
60) A quota ________ a deadweight loss and a tariff ________ a deadweight loss.
A) creates; creates
B) creates; does not create
C) does not create; creates
D) does not create; does not create
E) might create;might create
Skill: Level 4: Applying models
Section: Checkpoint 9.3
Author: MR
AACSB: Reflective thinking

57
Copyright © 2011 Pearson Education, Inc.
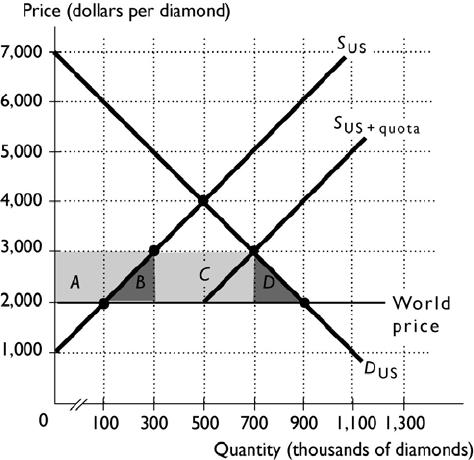
61) The above figure shows the U.S. market for 1 carat diamonds. With free trade, Americans
buy ________ diamonds and pay a price of ________ per diamond.
A) 500,000; $4,000
B) 300,000; $3,000
C) 700,000; $3,000
D) 300,000; $4,000
E) 900,000; $2,000
Skill: Level 3: Using models
Section: Checkpoint 9.3
Author: KG
AACSB: Analytical reasoning
62) The above figure shows the U.S. market for 1 carat diamonds. With free trade, the United
States produces ________ diamonds and imports ________ diamonds.
A) 300,000; 600,000
B) 0; 900,000
C) 100,000; 900,000
D) 100,000; 800,000
E) 500,000; 400,000
Skill: Level 3: Using models
Section: Checkpoint 9.3
Author: KG
AACSB: Analytical reasoning

58
Copyright © 2011 Pearson Education, Inc.
63) The above figure shows the U.S. market for 1 carat diamonds. Suppose the United States
imposes the import quota shown in the figure. With the import quota, how many diamonds can
be imported?
A) 500,000
B) 700,000
C) 400,000
D) 900,000
E) 300,000
Skill: Level 3: Using models
Section: Checkpoint 9.3
Author: KG
AACSB: Analytical reasoning
64) The above figure shows the U.S. market for 1 carat diamonds. The free trade, the price in
the United States for diamonds is equal to ________ and with the quota illustrated in the figure,
the price in the United States is equal to ________.
A) $4,000; $2,000
B) $2,000; $3,000
C) $4,000; $3,000
D) $2,000; $2,000
E) $2,000; $4,000
Skill: Level 3: Using models
Section: Checkpoint 9.3
Author: KG
AACSB: Analytical reasoning
65) The above figure shows the U.S. market for 1 carat diamonds. With free trade, U.S.
production of diamonds is equal to ________ diamonds. When the quota illustrated in the figure
is in place, U.S. production is equal to ________ diamonds.
A) 100,000; 300,000
B) 100,000; 500,000
C) 300,000; 100,000
D) 300,000; 500,000
E) 900,000; 700,000
Skill: Level 3: Using models
Section: Checkpoint 9.3
Author: KG
AACSB: Analytical reasoning


59
Copyright © 2011 Pearson Education, Inc.
66) The above figure shows the U.S. market for 1 carat diamonds. Area B + area D is the
A) decrease in consumer surplus due to the import quota.
B) importers’ profit from the quota.
C) gain in total surplus due to the import quota.
D) deadweight loss from the import quota.
E) increase in producer surplus due to the import quota.
Skill: Level 3: Using models
Section: Checkpoint 9.3
Author: KG
AACSB: Analytical reasoning
67) The above figure shows the U.S. market for 1 carat diamonds. Area A + area B + area C +
area D is the
A) deadweight loss from the import quota.
B) importers’ profit from the quota.
C) decrease in consumer surplus due to the import quota.
D) gain in total surplus due to the import quota.
E) increase in producer surplus due to the import quota.
Skill: Level 3: Using models
Section: Checkpoint 9.3
Author: KG
AACSB: Analytical reasoning
68) The above figure shows the U.S. market for 1 carat diamonds. Area C is the
A) decrease in consumer surplus due to the import quota.
B) importers’ profit from the quota.
C) deadweight loss from the import quota.
D) increase in producer surplus due to the import quota.
E) gain in total surplus due to the import quota.
Skill: Level 3: Using models
Section: Checkpoint 9.3
Author: KG
AACSB: Analytical reasoning

60
Copyright © 2011 Pearson Education, Inc.
69) The above figure shows the U.S. market for 1 carat diamonds. Area A is the
A) increase in producer surplus due to the import quota.
B) importers’ profit from the import quota.
C) decrease in consumer surplus due to the import quota.
D) deadweight loss from the import quota.
E) gain in total surplus due to the import quota.
Skill: Level 3: Using models
Section: Checkpoint 9.3
Author: KG
AACSB: Analytical reasoning
70) If the United States negotiates a voluntary export restraint with international sugar producing
nations, then
A) U.S. sugar buyers pay a lower price for sugar.
B) U.S. sugar producers produce a smaller quantity.
C) imports of sugar increase.
D) the U.S. government collects less revenue than if it imposed a tariff on sugar.
E) the foreign governments collect more revenue than if a tariff is imposed on sugar.
Skill: Level 2: Using definitions
Section: Checkpoint 9.3
Author: TPS
AACSB: Reflective thinking
71) Which of the following methods of restricting trade does NOT create a deadweight loss?
A) a tariff
B) a quota
C) a voluntary export restraint
D) Both answers A and B are correct.
E) None of the above answers are correct because all the methods create a deadweight loss
Skill: Level 2: Using definitions
Section: Checkpoint 9.3
Author: TPS
AACSB: Reflective thinking