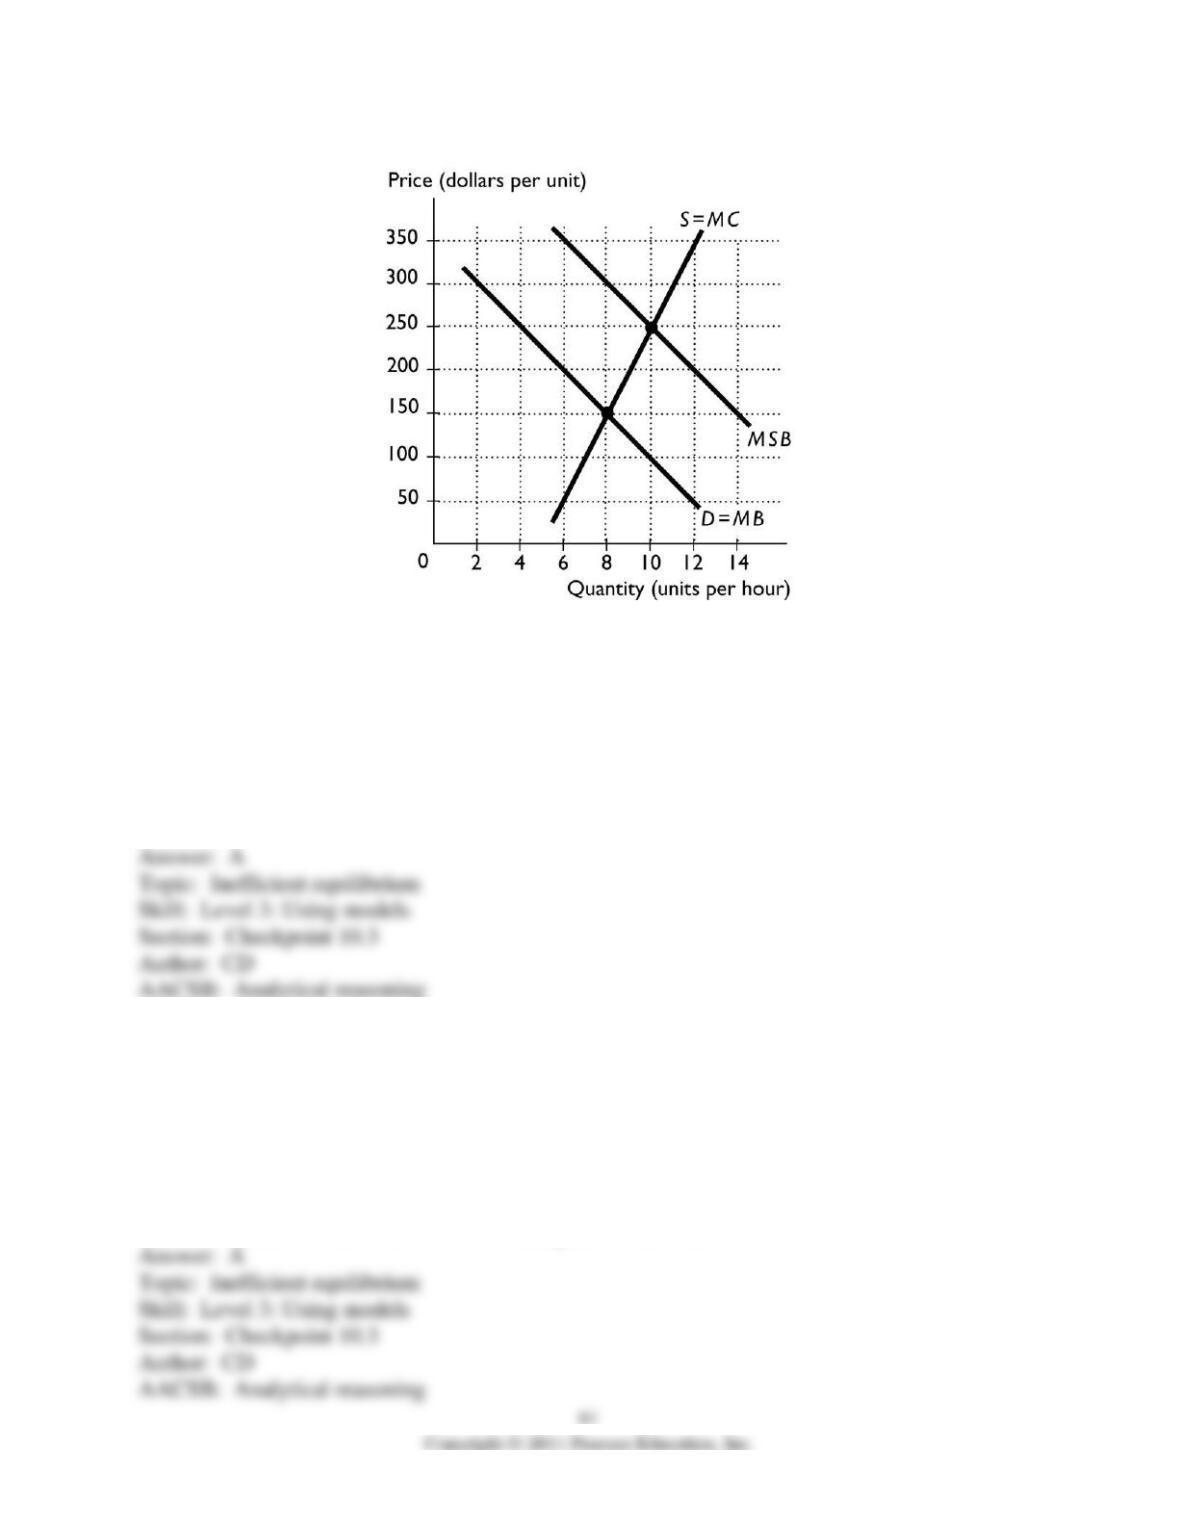
49) The figure above shows the market for a good with an external benefit. If the market is
competitive and the government takes no action, the equilibrium quantity is ________ units and
the equilibrium price is ________ per unit.
A) 8; $150
B) 8; $300
C) 10; $250
D) 10; $100
E) 10; $150
50) The figure above shows the market for a good with an external benefit. If the market is
competitive and the government takes no action, the equilibrium quantity of ________ units is
inefficient because ________.
A) 8; marginal benefit exceeds marginal cost
B) 8; marginal cost exceeds marginal benefit
C) 10; marginal cost exceeds marginal benefit
D) 10; marginal social benefit exceeds marginal benefit
E) 10; marginal external benefit exceeds marginal social benefit
51) The figure above shows the market for a good with an external benefit. When 6 units are
produced, marginal social benefit equals ________ and marginal external benefit equals
________.
A) $200; $150
B) $350; $200
C) $200; $50
D) $350; $150
E) $150; $250
52) The figure above shows the market for a good with an external benefit. The efficient level of
production is ________ units because ________.
A) 8; marginal benefit equals marginal cost
B) 8; marginal cost is less than marginal social benefit
C) 10; marginal cost equals marginal social benefit
D) 10; marginal social benefit exceeds marginal benefit
E) 8; marginal benefit equals the marginal external benefit
53) The figure above shows the market for a good with an external benefit. If the government
wants to grant a subsidy so that the efficient quantity is produced, the subsidy must equal
________ per unit.
A) $100
B) $150
C) $250
D) $300
E) $50
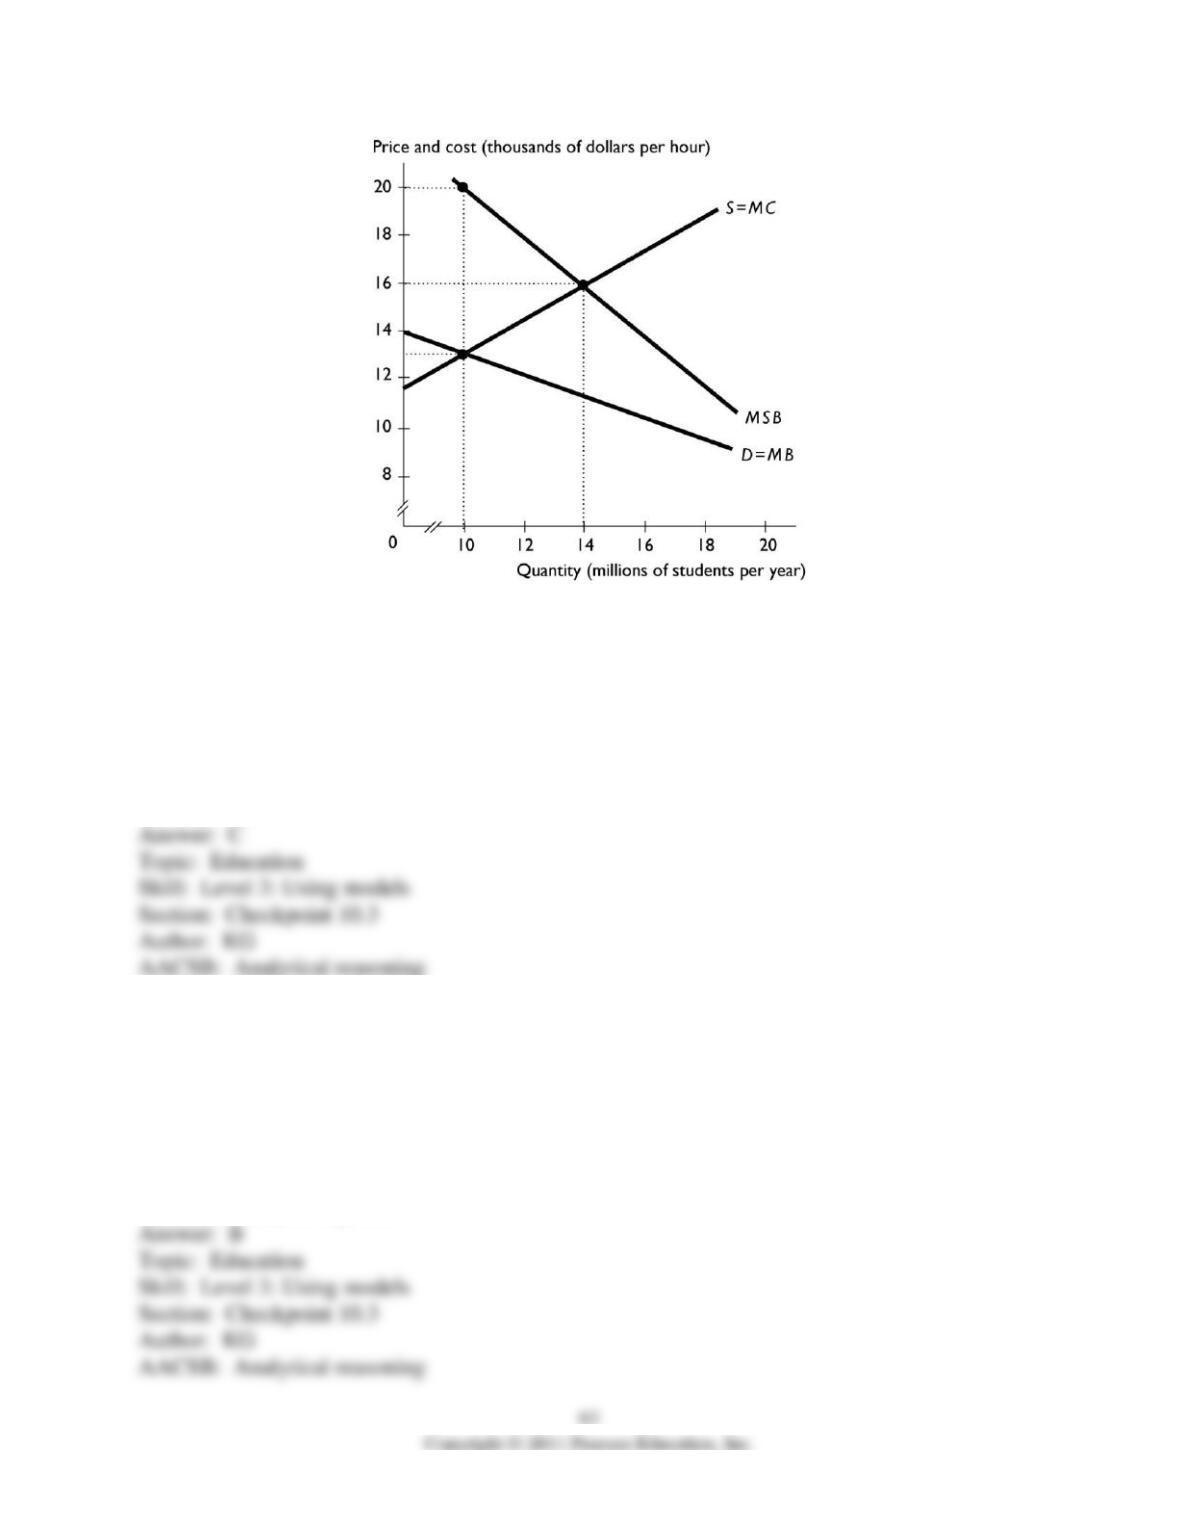
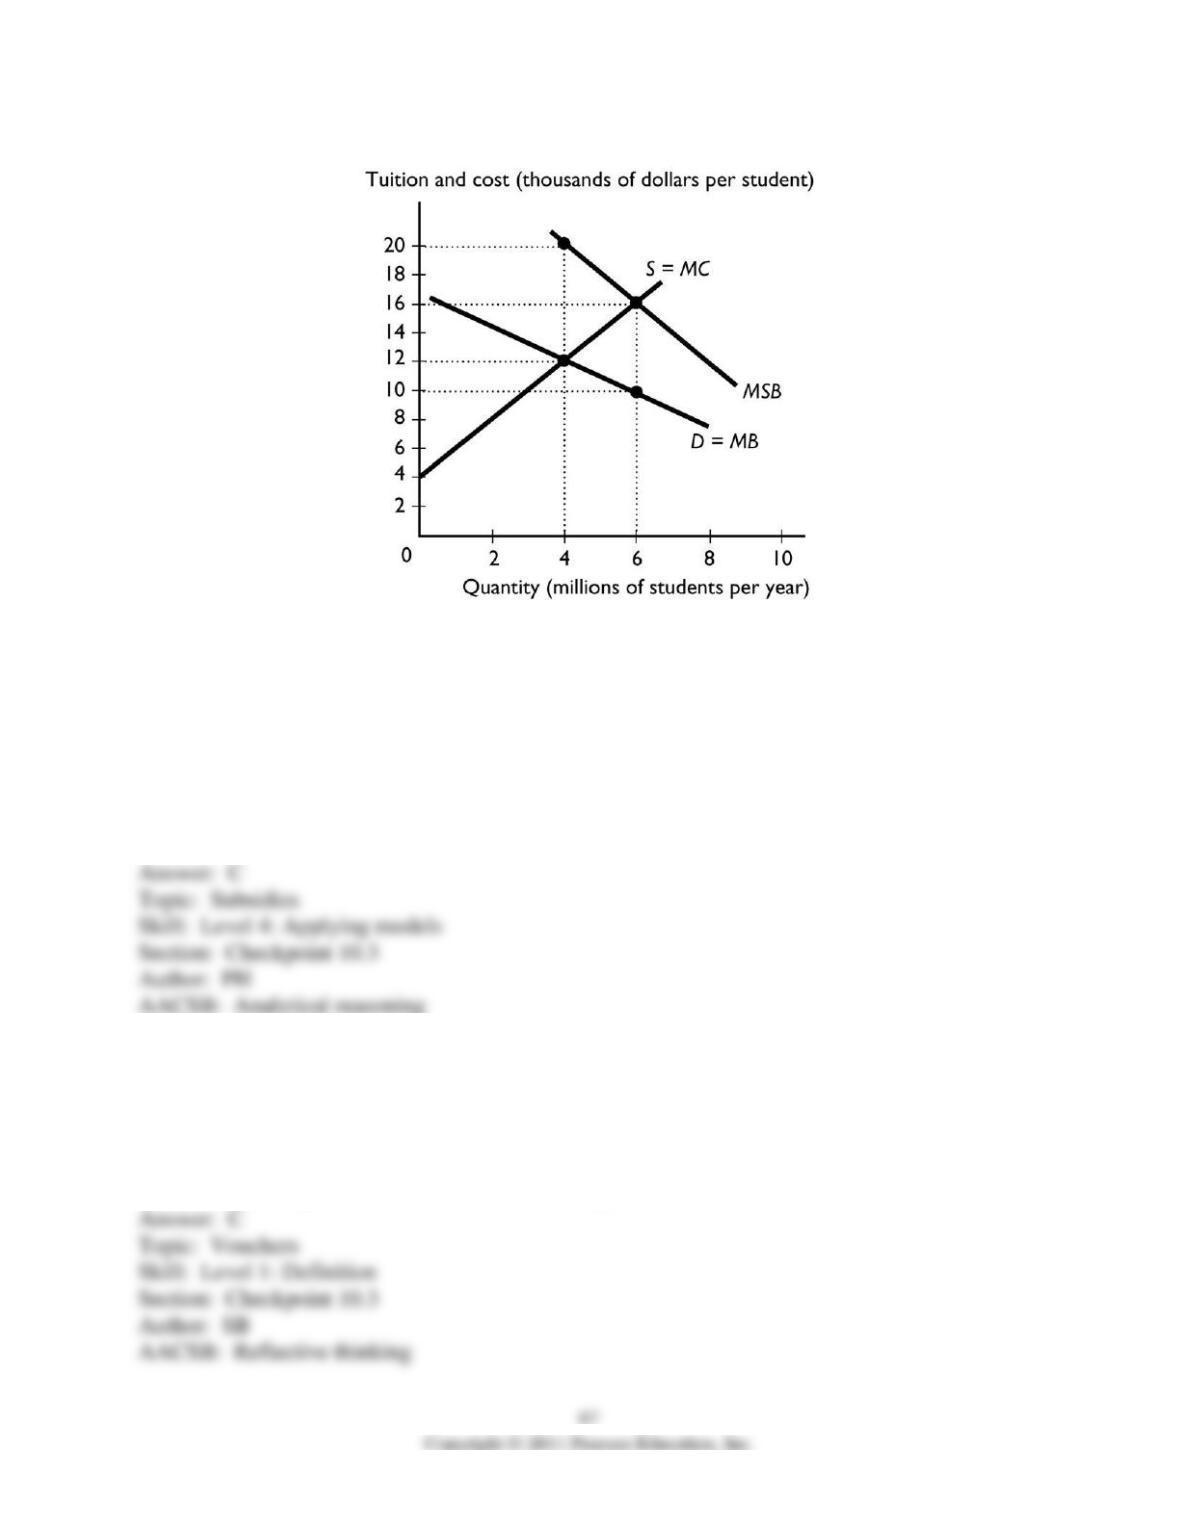
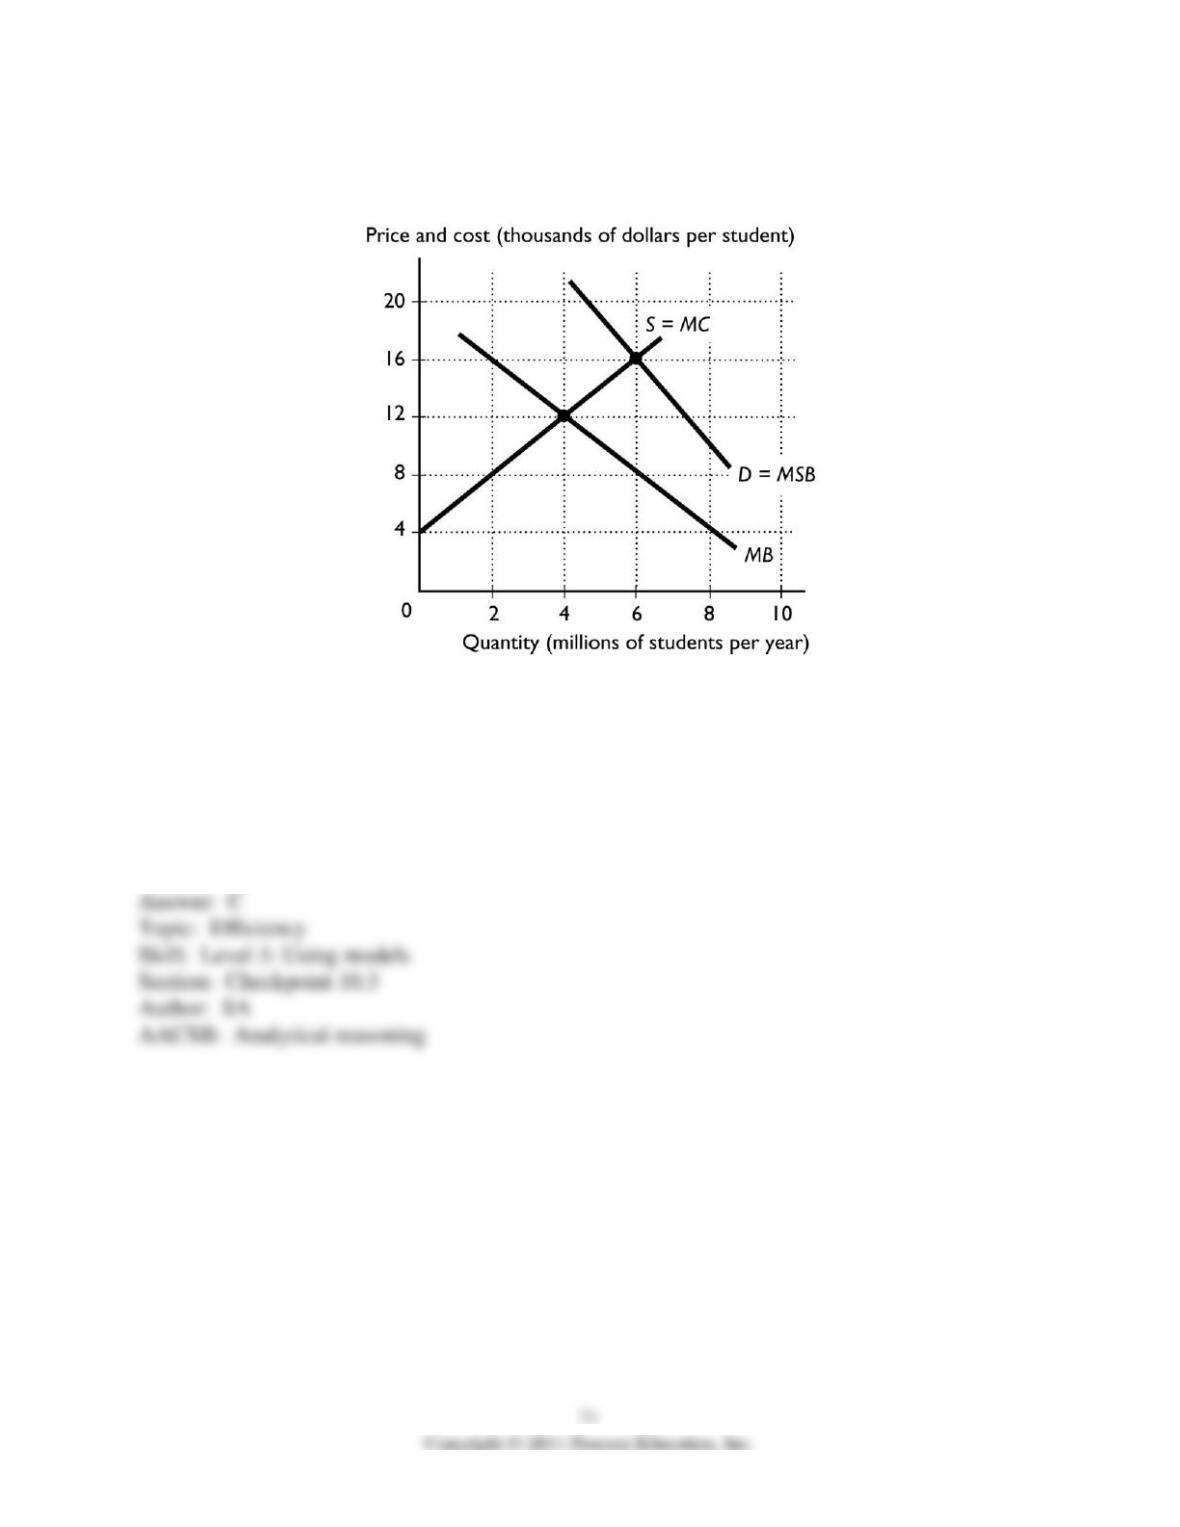
54) The above figure shows the market for college education in the United States. With no
government intervention, the market equilibrium is at a tuition of ________ and ________
million students per year.
A) 16,000; 14
B) $20,000; 10
C) $13,000; 10
D) $13,000; 17
E) $16,000; 10
55) The above figure shows the market for college education in the United States. With no
government intervention, the unregulated market equilibrium is ________ because education
generates ________.
A) efficient; positive external benefits
B) inefficient; positive external benefits
C) inefficient; positive external costs
D) efficient; positive external costs
E) inefficient; public goods

56) The figure above shows the market for college education in the United States. If there is no
external benefit from a college education and the government does not intervene in the market,
then the equilibrium tuition of college education is
A) $13,000.
B) $16,000.
C) $20,000.
D) $13,000.
E) $16,000.
57) The figure above shows the market for college education in the United States. The efficient
quantity of college education is ________ students per year.
A) 10 million
B) 12 million
C) 17 million
D) 18 million
E) 14 million
58) The figure above shows the market for college education in the United States. The marginal
external benefit associated with educating 14 million students is ________ per student per year.
A) $16,000
B) $13,000
C) $11,000
D) $5,000
E) $7,000
59) The figure above shows the market for college education in the United States. If the
government does not intervene in this market, the number of students going to college is
________ and the efficient number of students is ________.
A) 13 million students per year; 16 million students per year
B) 14 million students per year; 16 million students per year
C) 10 million students per year; 14 million students per year
D) 10 million students per year; 13 million students per year
E) 14 million students per year; 10 million students per year
60) The figure above shows the market for college education in the United States. If the
government does not intervene in this market, the deadweight loss equals ________ per year.
A) $28 billion
B) $14 billion
C) $280 billion
D) $224 billion
E) $7 billion
61) The figure above shows the market for college education in the United States. If the
government intervenes in the market and provides a subsidy to colleges to enroll the efficient
number of students, the amount of the subsidy equals ________ per student.
A) $5,000
B) $16,000
C) $13,000
D) $11,000
E) $7,000
62) The figure above shows the market for college education in the United States. If the
government provides a subsidy to colleges to enroll the efficient number of students, the amount
of the subsidy per student equals ________ and each student pays ________ per year.
A) $16,000; $13,000
B) $7,000; $13,000
C) $5,000; $13,000
D) $11,000; $16,000
E) $5,000; $11,000
63) The figure above shows the market for college education in the United States. If the
government has a goal of enrolling the efficient number of students each year, the government
should provide a voucher to students equaling ________.
A) $16,000
B) $13,000
C) $11,000
D) $5,000
E) $7,000
64) The figure above shows the market for education, a good possessing an external benefit. In
order to attain the efficient number of students, a government subsidy must equal ________ per
student.
A) $2,000
B) $8,000
C) $6,000
D) $10,000
E) $16,000
65) A voucher is
A) the production of a good by some public institution.
B) a payment that government makes to private producers.
C) a token that government provides to households to use in purchasing a specific good.
D) a permit to pollute.
E) a tax that is imposed on consumers rather than producers.
66) Which of the following government actions is appropriate in a market with an external
benefit?
A) taxes
B) vouchers
C) marketable permits
D) setting a tax equal to the transactions costs
E) price ceiling
67) Some policymakers have proposed giving parents of children in poorly performing schools
tax dollars to help send their children to private schools. This proposal is an example of
A) vouchers.
B) public provision.
C) external costs.
D) taxes.
E) correcting an externality using a Coase good.
68) Pell grants are money given to students attending college. Pell grants are most closely similar
to
A) public provision of a good.
B) private subsidies given to producers of a good.
C) vouchers given to consumers of a good.
D) property rights assigned to consumers of a good.
E) a subsidy given to the producer of a good.
69) Food stamps provided by the government to households are an example of
A) vouchers.
B) marginal benefits from producing a good or service.
C) marginal cost from producing a good or service.
D) marginal external cost.
E) a Coasian good.
70) Vouchers given to consumers
A) increase the demand for a good.
B) decrease the demand for a good.
C) increase the supply of a good.
D) decrease the supply of a good.
E) increase both the demand for the good and the supply of the good.
71) The use of vouchers for education
A) decreases the demand for education and increases the equilibrium quantity.
B) increases the demand for education and increases the equilibrium quantity.
C) increases the deadweight loss for those who can’t afford schooling.
D) decreases the quantity provided to the efficient level.
E) decreases the demand for education and decreases the equilibrium quantity.

72) Education has an external benefit. So to achieve the efficient level of education, an education
voucher must equal the difference between the
A) marginal (private) cost and the marginal social benefit.
B) marginal (private) benefit and the marginal social benefit.
C) marginal social benefit and the marginal (private) cost.
D) dollar price and marginal (private) cost.
E) marginal (private) cost and the marginal social cost.
73) If vouchers for a good or service given to consumers, then the supply curve ________ and
the demand curve ________.
A) shifts leftward; shifts leftward
B) shifts leftward; shifts rightward
C) shifts rightward; shifts rightward
D) does not shift; shifts rightward
E) shifts rightward; does not shift
74) The figure above shows an education market in which the government is providing
households with vouchers. What is the efficient quantity of students?
A) 2 million
B) 4 million
C) 6 million
D) more than 6 million
E) more than 4 million and less than 6
75) The figure above shows an education market in which the government is providing
households with vouchers. What is the dollar value of a voucher in this market?
A) $4,000
B) $8,000
C) $12,000
D) $16,000
E) None of the above answers is correct.
76) The figure above shows an education market in which the government is providing
households with vouchers. In total, how much do the schools receive for a student?
A) $4,000
B) $8,000
C) $12,000
D) $16,000
E) $20,000
77) The figure above shows an education market in which the government is providing
households with vouchers. Excluding the voucher, what do the students pay the schools?
A) $4,000
B) $8,000
C) $12,000
D) $16,000
E) $0
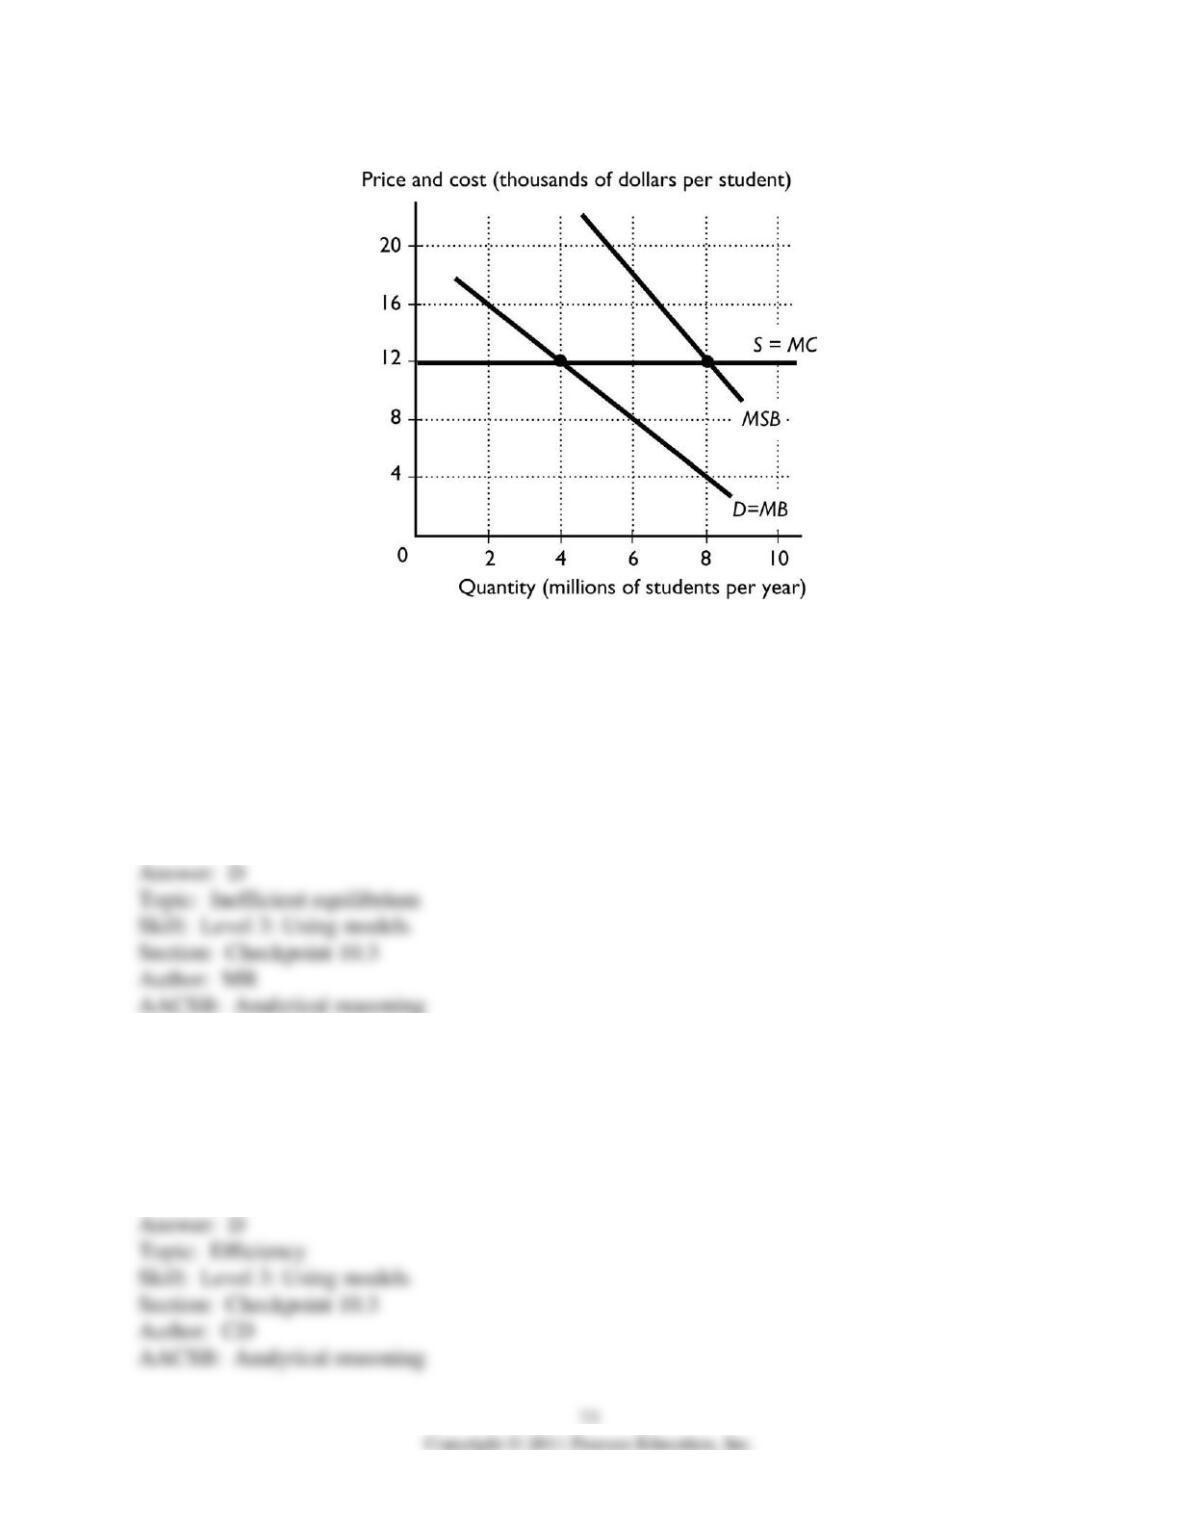
78) The figure shows the market for college education. If the market for education is competitive
and with no government intervention, the equilibrium quantity of college students is ________
million and the efficient quantity of college students is ________ million.
A) 2; 4
B) 8; 2
C) 8; 4
D) 4; 8
E) 0; 10
79) The figure shows the market for college education. The efficient number of students is
A) less than 4 million.
B) more than 4 million and less than 8 million.
C) 4 million.
D) 8 million.
E) more than 8 million.
80) The figure shows the market for college education. In order for the efficient amount of
education to occur, the government could provide a subsidy of ________ per student.
A) $4,000
B) $8,000
C) $12,000
D) $20,000
E) $16,000
81) The figure shows the market for college education. In order for the efficient amount of
education to occur, the government could provide a voucher of ________ per student.
A) $4,000
B) $8,000
C) $12,000
D) $20,000
E) $16,000
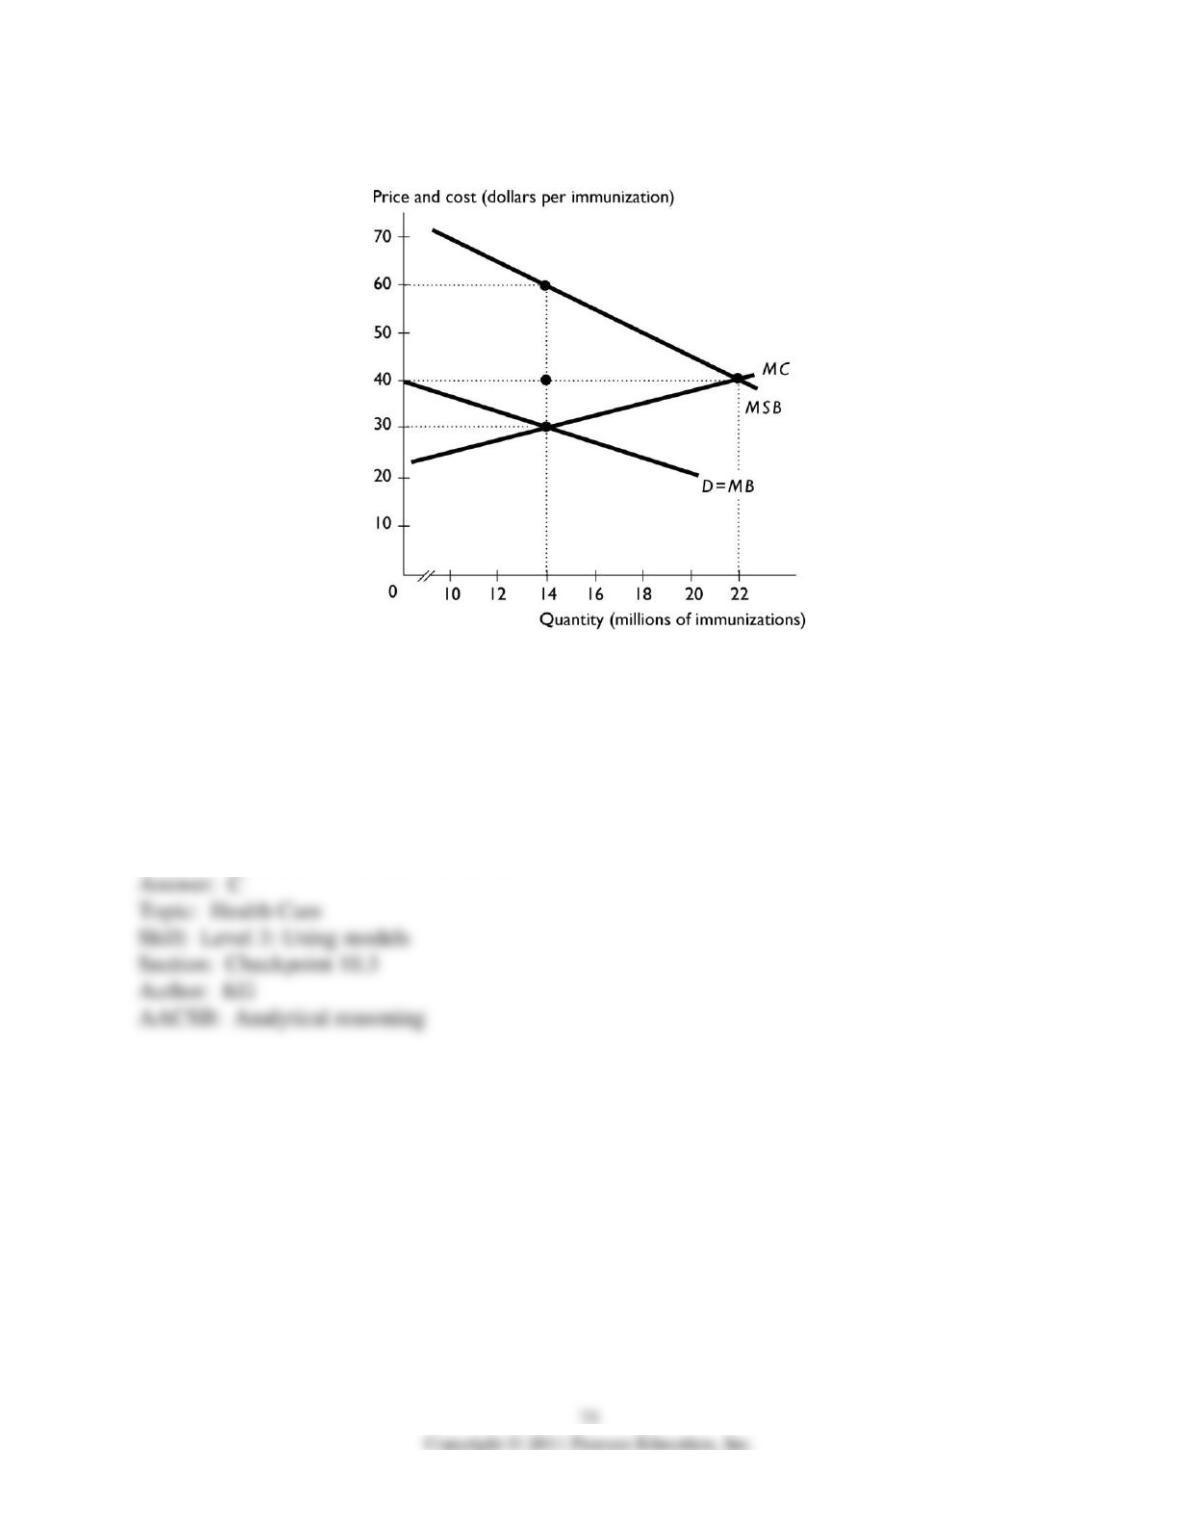
82) The figure above shows the market for annual influenza immunizations the United States.
With no government intervention, the market equilibrium is at a price of ________ and
________ million immunizations per year.
A) $60; 14
B) $40; 14
C) $30; 14
D) $40; 22
E) None of the above answers are correct.
83) The figure above shows the market for annual influenza immunizations the United States.
The market equilibrium with no government intervention is ________ because health care
generates ________.
A) efficient; positive external benefits
B) inefficient; positive external benefits
C) inefficient; positive external costs
D) efficient; positive external costs
E) inefficient; public goods
84) The figure above shows the market for annual influenza immunizations the United States. If
there is NO external benefit from health care and the government does not intervene in the
market, then the equilibrium price of immunizations is
A) $30
B) $20
C) $40
D) $60
E) $70
85) The figure above shows the market for annual influenza immunizations the United States.
The efficient quantity of immunizations is
A) 14 million per year.
B) 10 million per year.
C) Between 14 and 21 million per year.
D) Less than 10 million per year.
E) 22 million per year.
86) The figure above shows the market for annual influenza immunizations the United States.
The marginal external benefit associated with immunizing 14 million people is ________ per
person per year.
A) $40
B) $20
C) $90
D) $30
E) $60
87) The figure above shows the market for annual influenza immunizations the United States. If
the government does not intervene in this market, the number of immunizations per year is
________ and the efficient number of immunizations per year is ________.
A) 14 million; 20 million
B) 20 million; 22 million
C) 14 million; 22 million
D) 14 million; 10 million
E) 10 million; 14 million
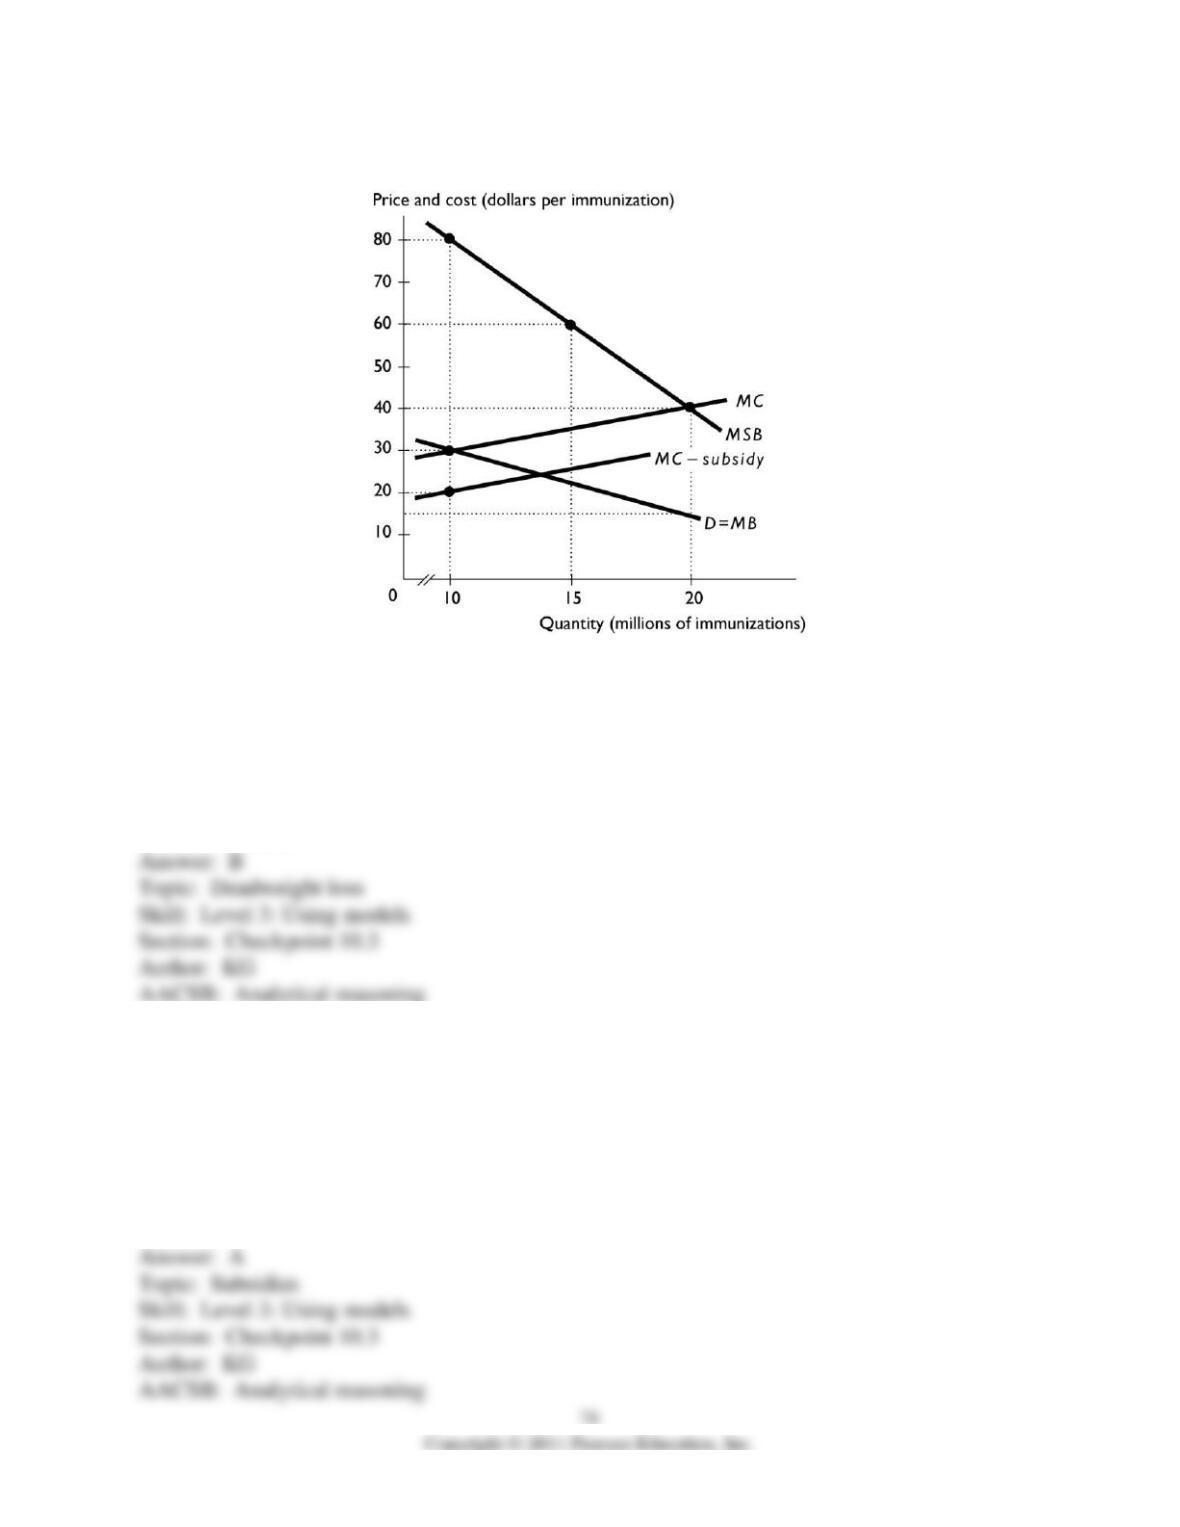
88) The figure above shows the market for annual influenza immunizations the United States. If
the government does not intervene in this market, deadweight loss equals ________.
A) $350 million
B) $250 million
C) $500 million
D) $600 million
E) $37.5 million
89) The figure above shows the market for annual influenza immunizations the United States. If
the government intervenes in the market and provides a subsidy to providers of immunizations to
immunize the efficient number of people, the amount of the subsidy is ________ per person.
A) $25
B) $50
C) $35
D) $15
E) $40
90) The figure above shows the market for annual influenza immunizations the United States. If
the government intervenes in the market and provides a $10 subsidy to providers of
immunizations, the number of people immunized is ________.
A) 20 million per year.
B) exactly 10 million per year.
C) between 15 and 20 million per year.
D) less than 10 million per year.
E) more than 10 million and less than 15 million.
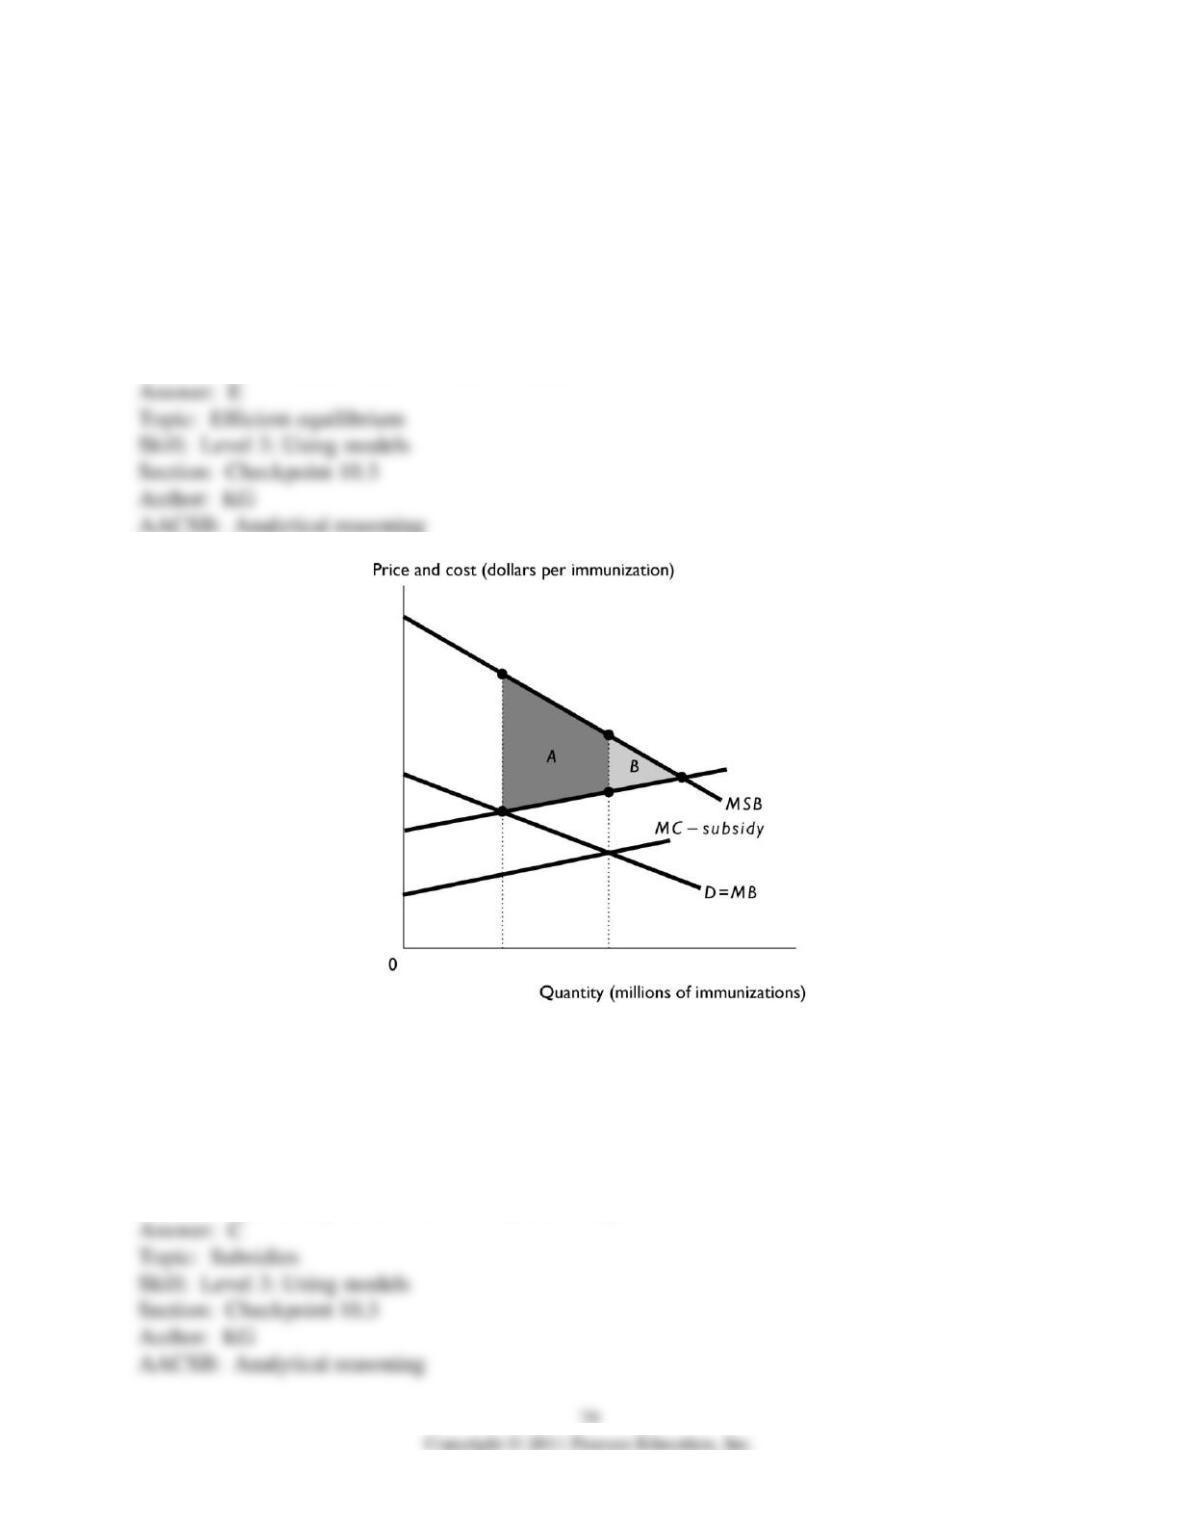
91) The figure above shows the market for annual influenza immunizations the United States.
Area A is the
A) the total deadweight loss when there is not the illustrated subsidy.
B) remaining deadweight loss when there is the illustrated subsidy.
C) the gain in efficiency from the illustrated subsidy.
D) the loss in efficiency from the illustrated subsidy.
E) the consumer surplus with the illustrated subsidy.
92) The figure above shows the market for annual influenza immunizations the United States.
Area B is the
A) gain in efficiency from the illustrated subsidy.
B) remaining deadweight loss when there is the illustrated subsidy.
C) deadweight loss when there is not the illustrated subsidy.
D) the equilibrium with the illustrated subsidy.
E) the loss in efficiency from the illustrated subsidy.
93) The figure above shows the market for annual influenza immunizations the United States.
Area A + Area B is the
A) deadweight loss when there is not the illustrated subsidy.
B) loss in efficiency from the illustrated subsidy.
C) gain in efficiency from the illustrated subsidy.
D) remaining deadweight loss when there is the illustrated subsidy.
E) the equilibrium with the illustrated subsidy.
94) The benefit the consumer of a good or service receives is the
A) social benefit.
B) external benefit.
C) private benefit.
D) public benefit.
E) consumption benefit.