19.4 Chapter Figures
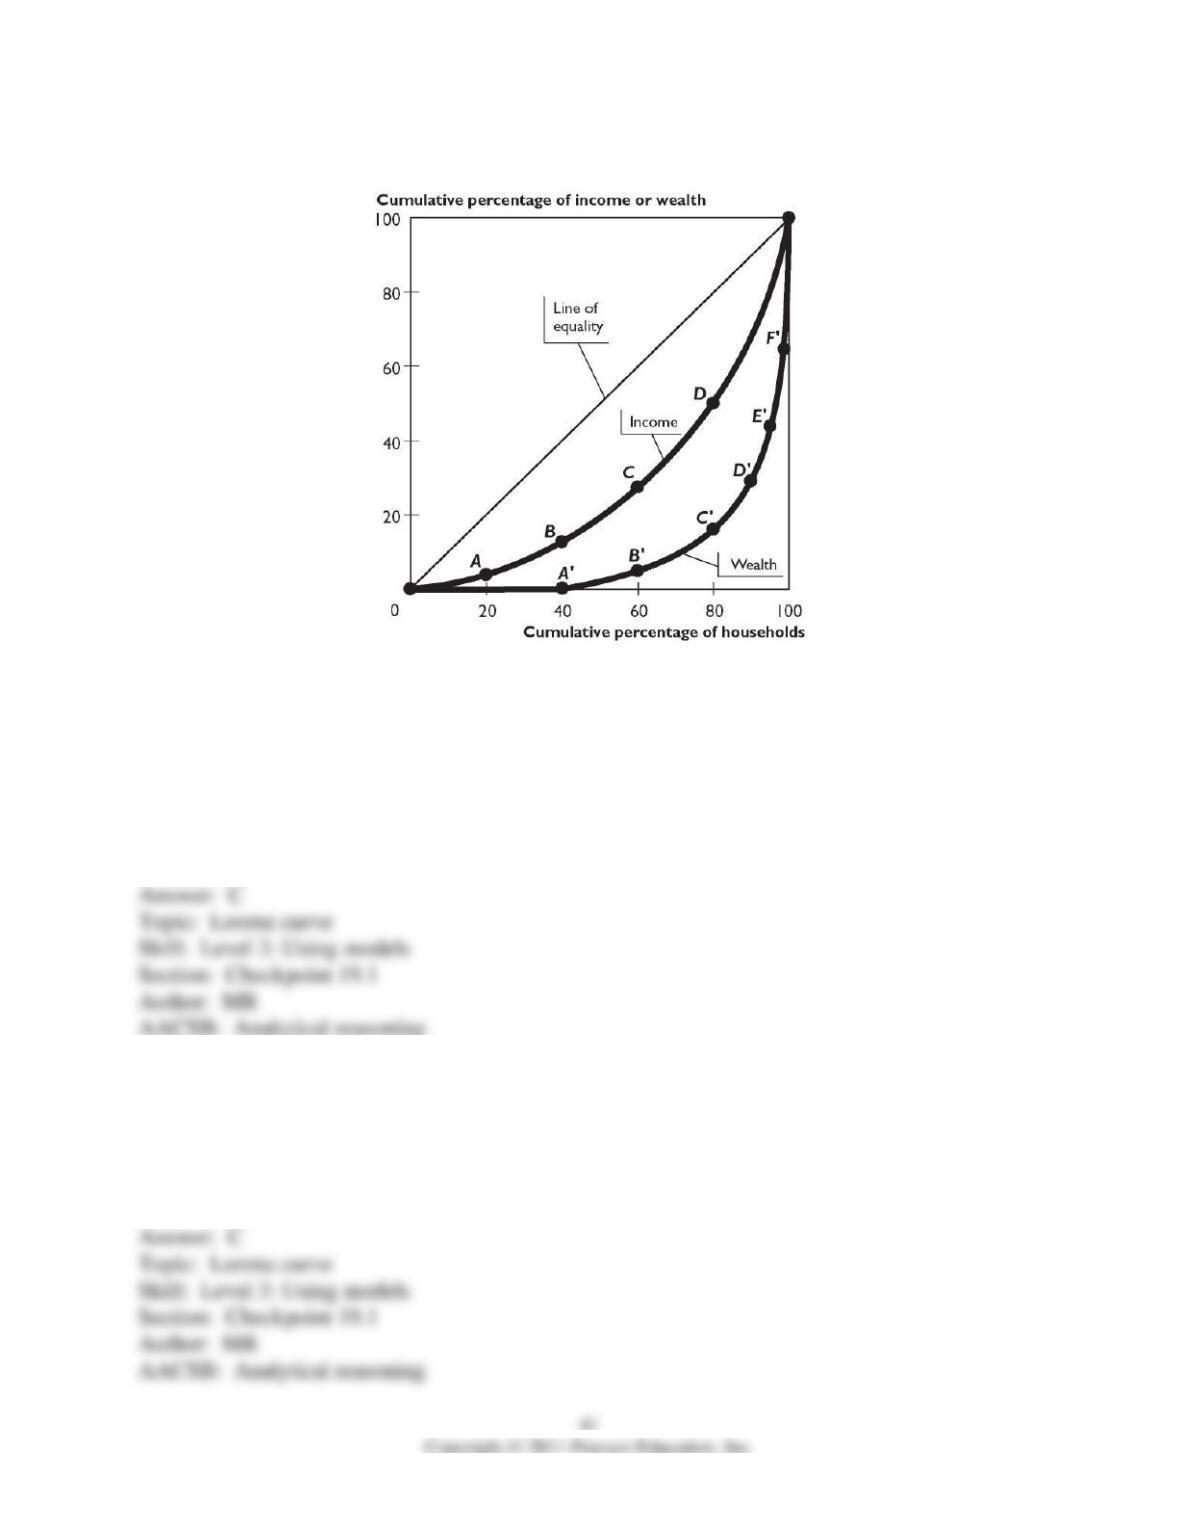
The figure above shows Lorenz curves for a nation.
1) Based on the figure above, if the poorest 20 percent group of households increased the share
of the nation’s income they receive, then
A) there is a movement up along the Lorenz curve for income.
B) there is a movement down along the Lorenz curve for income.
C) the Lorenz curve for income shifts toward the line of equality.
D) the Lorenz curve for income shifts away from the line of equality.
E) Both answers A and C are correct.
2) Based on the figure above,
A) the average household’s income exceeds its wealth.
B) the average household’s wealth exceeds its income.
C) income is distributed more equally than wealth.
D) wealth is distributed more equally than income.
E) Both answers A and C are correct.

3) Based on the figure above,
A) wealth is distributed more equally than income.
B) the Lorenz curve for wealth shows that the poorest 40 percent of households receive about 40
percent of the nation’s wealth.
C) average income exceeds average wealth.
D) average wealth exceeds average income.
E) the Lorenz curve for income shows that the richest 20 percent of households receive about 50
percent of the nation’s income.
4) Based on the figure above, which of the following can cause a movement from point C to
point D on the Lorenz curve for income?
A) an increase in income for the bottom 60 percent of households
B) an increase in income for the bottom 80 percent of households
C) a decrease in income for the bottom 60 percent of households
D) a decrease in income for the bottom 80 percent of households
E) None of the above answers is correct.
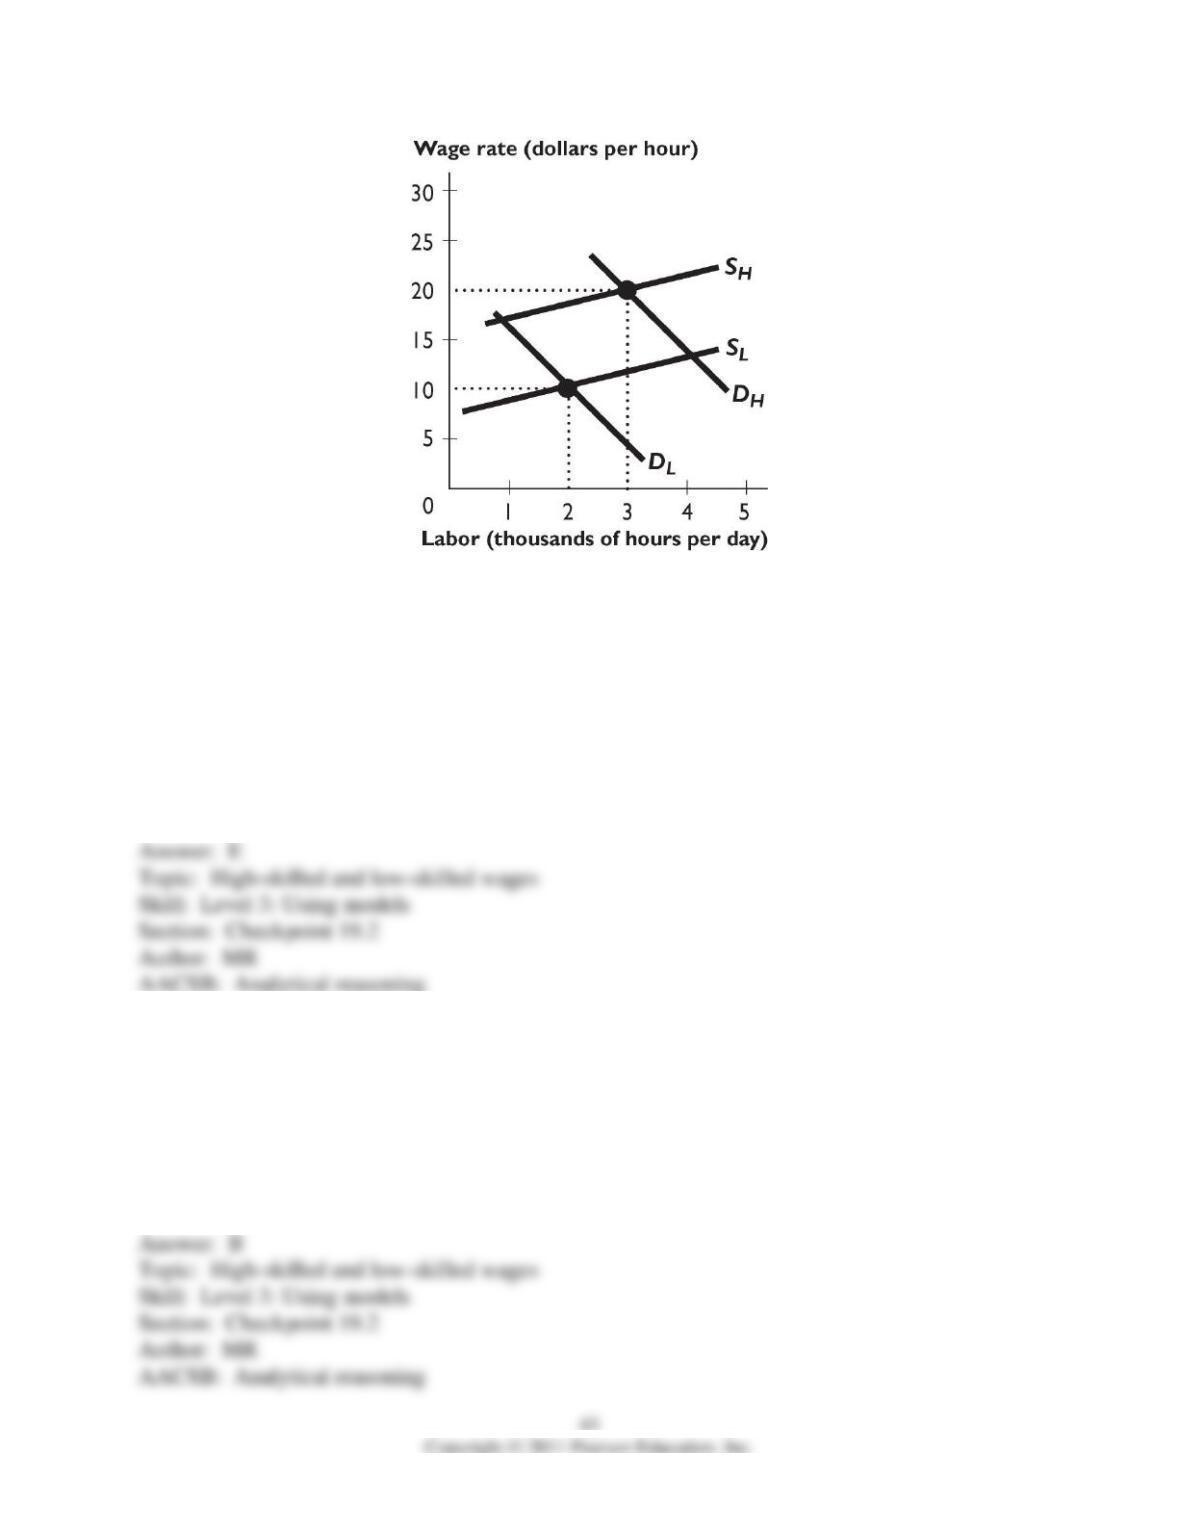
The figure above shows the demand and supply curves for high-skilled (indicated by an “H”
subscript) and low-skilled (indicated by an “L” subscript) workers.
5) In the figure above, the value of the marginal product of skill creates the difference between
the ________ curves and ________.
A) SL and SH; is equal to $10 per hour
B) SL and SH; exceeds $10 per hour
C) DL and DH; is less than $10 per hour
D) DL and DH; is equal to $10 per hour
E) DL and DH; exceeds $10 per hour
6) In the figure above, the compensation for the cost of acquiring the skill creates the difference
between the ________ curves and ________.
A) SL and SH; is equal to $10 per hour
B) SL and SH; is less than $10 per hour
C) DL and DH; is less than $10 per hour
D) DL and DH; is equal to $10 per hour
E) SL and SH; exceeds $10 per hour
7) In the figure above, the equilibrium wage differential between high-skilled workers and low-
skilled workers is
A) zero.
B) $5.00 or less per hour.
C) between $5.01 and $10.00 per hour.
D) between $10.01 and $20.00 per hour.
E) more than $20.01 per hour.
8) In the figure above, if the value of the marginal product of skill increased, then the
A) SL curve shifts leftward.
B) SH curve shifts leftward.
C) DH curve shifts rightward.
D) DH curve shifts leftward.
E) DL curve shifts leftward.
9) In the figure above, if the cost of acquiring the skill decreased, then the
A) SL curve shifts leftward.
B) SH curve shifts leftward.
C) SH curve shifts rightward.
D) DH curve shifts leftward.
E) DL curve shifts leftward.
19.5 Integrative Questions
1) The wage differential between high-skilled and low-skilled workers is the result of
A) a difference in the value of marginal product.
B) the cost of acquiring skills.
C) a negative income tax.
D) Both answers A and B are correct.
E) Both answers B and C are correct.
2) Discrimination
A) can be corrected by imposing a negative income tax.
B) cannot explain economic inequality.
C) immediately results in an unequal ownership of capital.
D) is more likely to occur in a business where customers come into contact with minority
employees.
E) means that the costs paid by people who discriminate are lower than otherwise.
3) Which of the following statements correctly describes how taxes redistribute income across
different households in an economy?
A) The richest 40 percent of households increase their share of income.
B) The poorest 60 percent of households increase their share of income.
C) Taxes have no effect on the distribution of income.
D) The poorest 20 percent of households receive 20 percent of their income from the
government.
E) The richest 20 percent of households increase their share of income and the poorest 20 percent
decrease their share of income.
4) Suppose a state charges an in-state student $2000 in tuition for a college education and
charges an out-of -state student $10,000 in tuition. This differential
A) is a result of the state subsidizing education for its residents.
B) explains the difference between the demand curve for high-skilled and low-skilled labor.
C) explains the difference between the supply curve for high-skilled and low-skilled labor.
D) can be corrected via a negative income tax.
E) is an example of the positive theories of income redistribution.
19.6 Essay: Economic Inequality in the United States
1) What is the difference between wealth and income?
2) In the United States, do the poorest 20 percent of the households receive more or less than 5
percent of market income?
3) Which is distributed more equally: income or wealth?
4) What is a Lorenz curve?
5) “If the distribution of income was equal, the Lorenz curve would be a straight, 45° line.” Is the
previous statement correct or incorrect?
6) What do the Lorenz curves for wealth and income in the United States look like? Which is
closer to the line of equality?
7) “Over the past two decades, the distribution of income in the United States has become more
equal.” Is the previous statement correct or incorrect? Briefly explain your answer.
8) Of age, marital status, family size, education, and race, which is the single biggest factor
affecting the household income distribution?
9) Describe the characteristics of the typical lowest income household in the United States and
the characteristics of the typical richest household in the United States.
10) Is the poverty rate the lowest among Hispanic households, black households, or white
households?
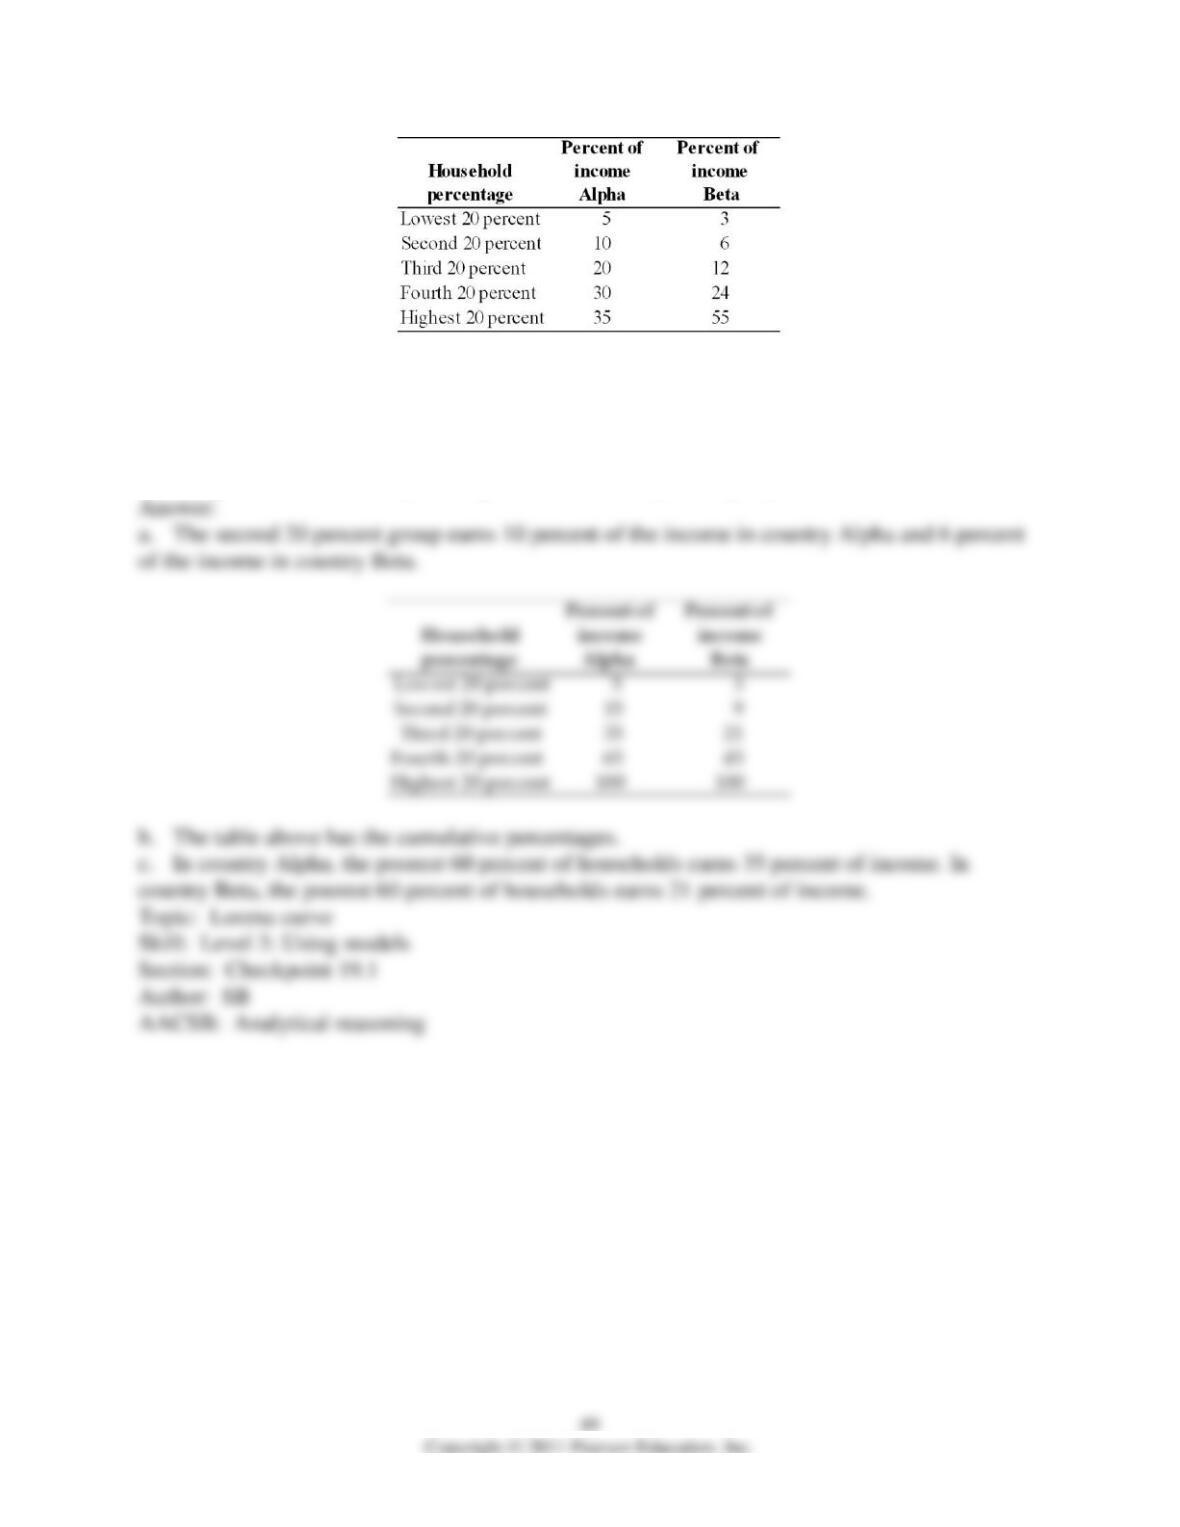
11) The above table shows the distribution of income in two imaginary countries, Alpha and
Beta.
a. What does the table tell you about the second 20 percent group in each country?
b. Calculate the cumulative percentage for both countries.
c. Interpret the cumulative percentage for the third 20 percent group in both countries.
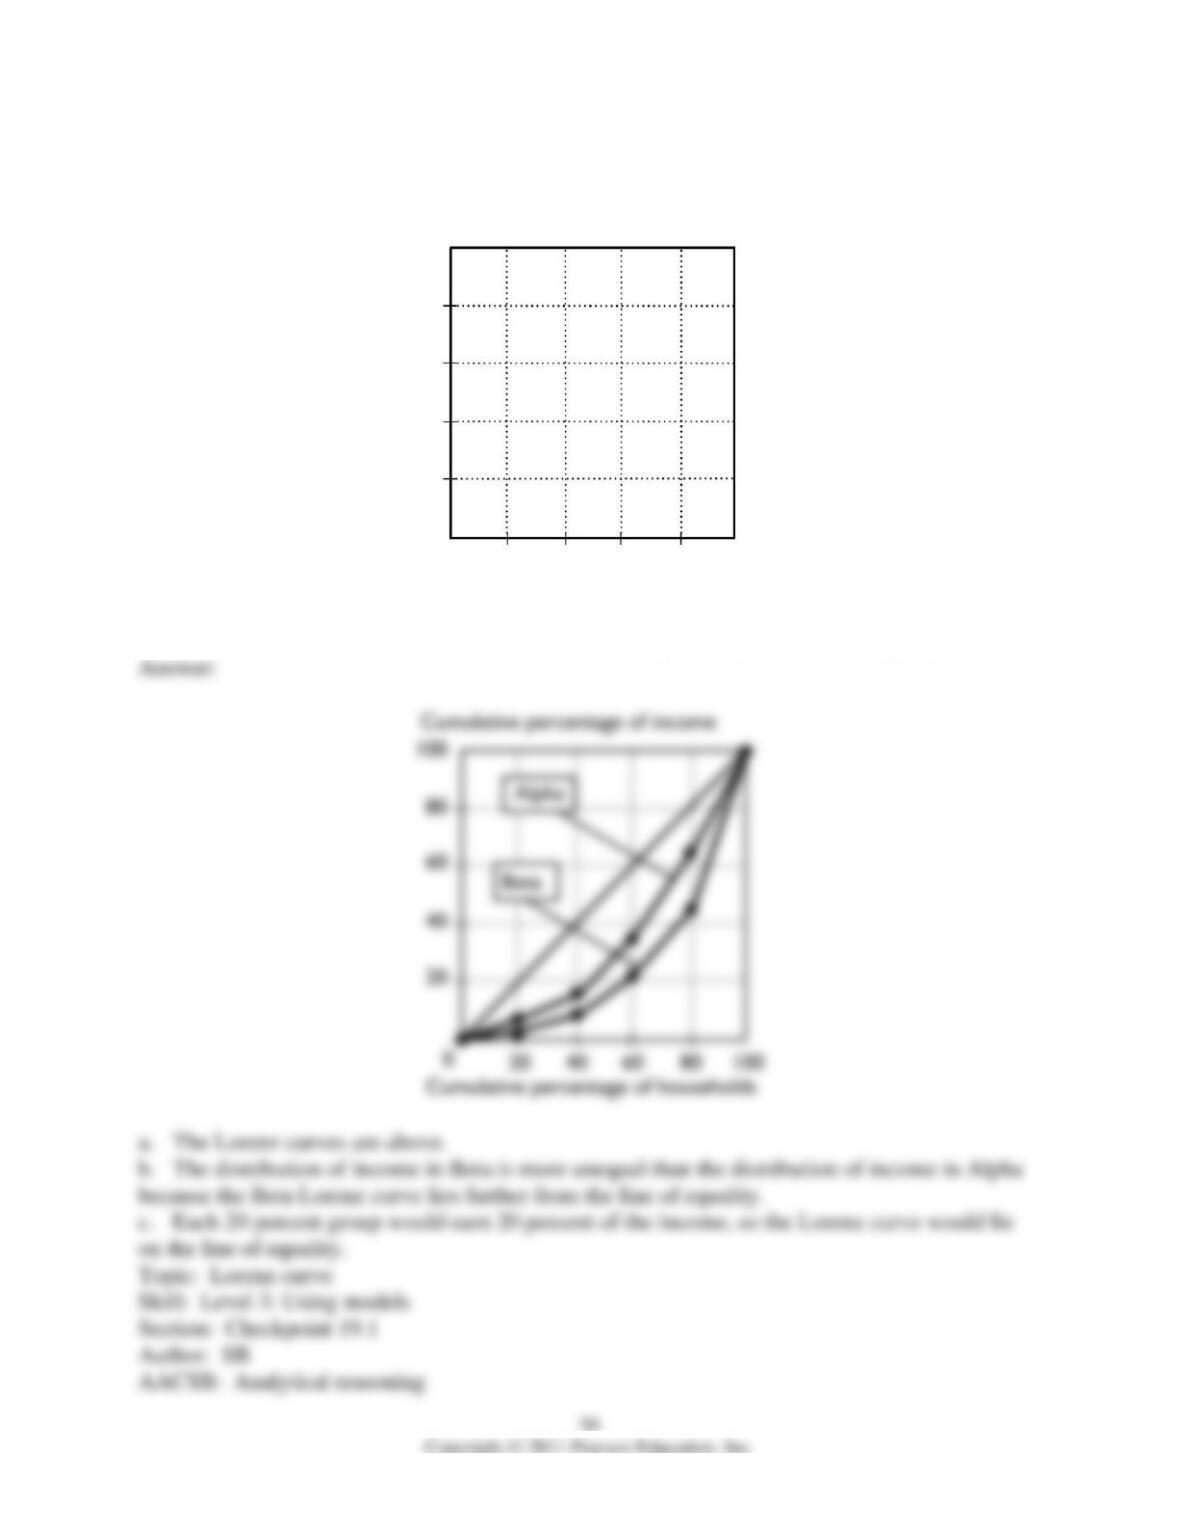
12) The above table shows the distribution of income in two imaginary countries, Alpha and
Beta.
a. In the figure below, draw the Lorenz curves for Alpha and Beta.
b. Compare the distribution of income in Alpha with that in Beta. Which distribution is more
unequal?
c. What would be the distribution of income in a country with perfect income equality?
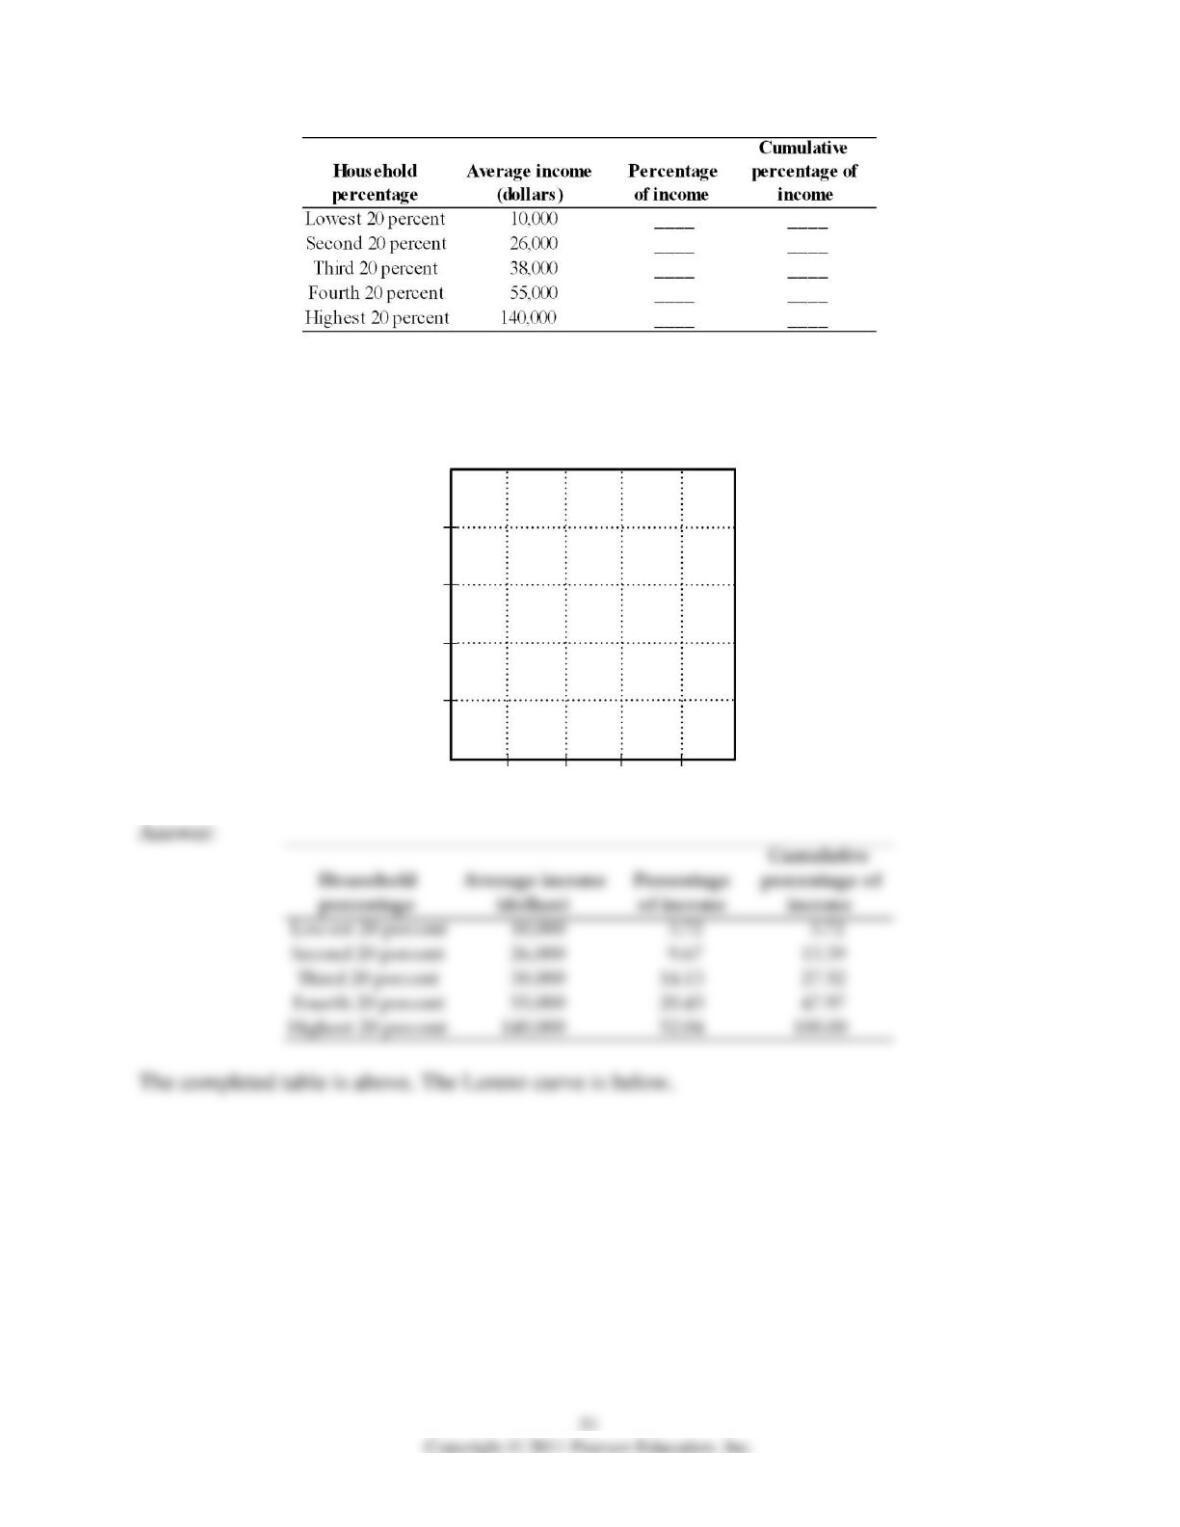
13) The table above gives the average income received by each 20 percent group of households.
Complete the table by finding the percentage of income earned by each group and the cumulative
percentage of income. Label the figure below and then plot the Lorenz curve.