71
Copyright © 2011 Pearson Education, Inc.
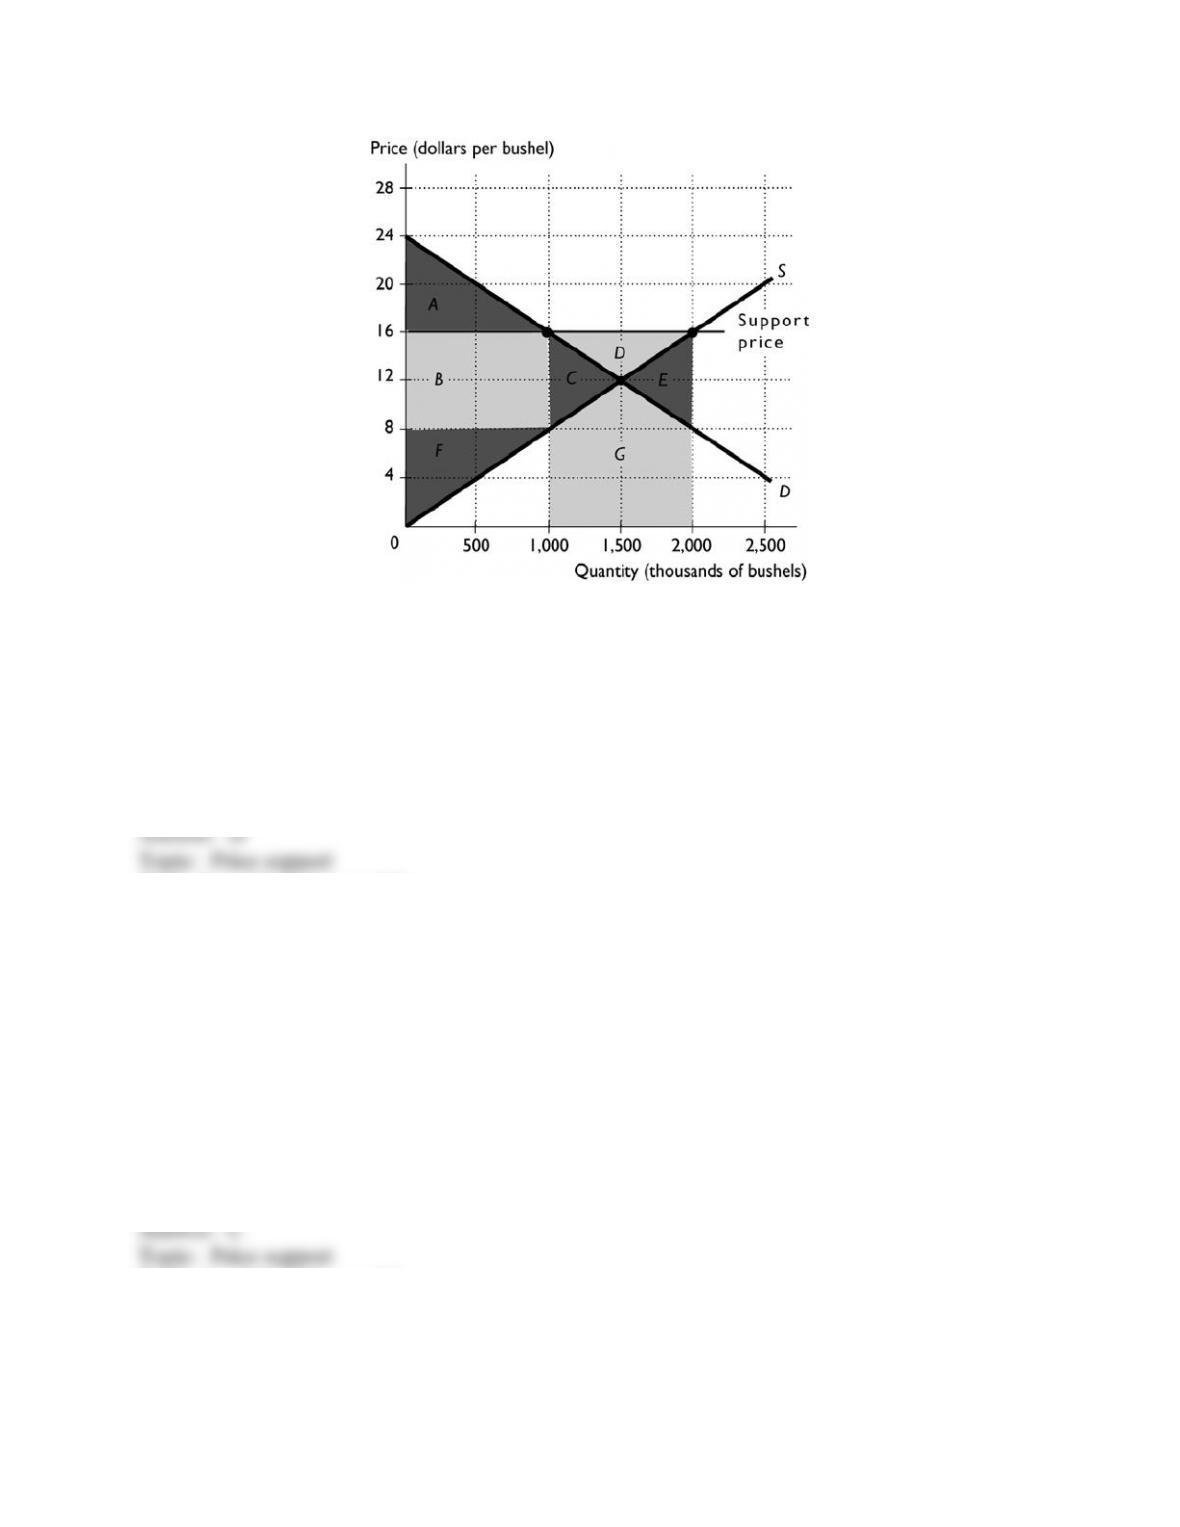
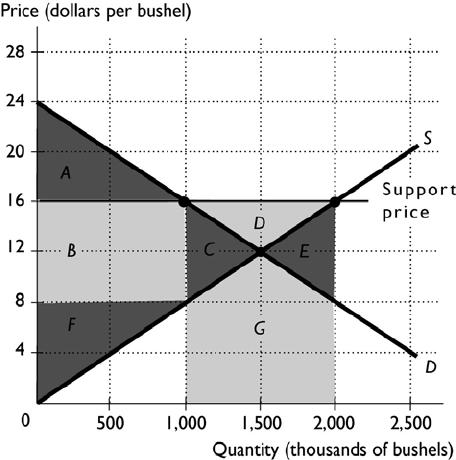
21) The above figure shows the domestic market for tomatoes. Suppose this market is isolated
from global competition and there is a support price set at $16. In this figure, what area equals
the consumer surplus?
A) area A + area B + area C
B) area A + area F
C) area C + area D + area E + area G
D) area A
E) area F
Skill: Level 3: Using models
Section: Checkpoint 7.3
Author: KG
AACSB: Analytical reasoning
22) The above figure shows the domestic market for tomatoes. Suppose this market is isolated
from global competition and there is a support price set at $16. In this figure, what area equals
the producer surplus?
A) area A + area B + area C
B) area A + area F
C) area B + area C + area D + area F
D) area C + area D + area E + area G
E) area F
Skill: Level 3: Using models
Section: Checkpoint 7.3
Author: KG
AACSB: Analytical reasoning
72
Copyright © 2011 Pearson Education, Inc.
23) The above figure shows the domestic market for tomatoes. Suppose this market is isolated
from global competition and there is a support price set at $16. In this figure, what area equals
the deadweight loss?
A) area B + area C + area D + area F
B) area E
C) area C + area D + area E + area G
D) area A
E) area F
Skill: Level 3: Using models
Section: Checkpoint 7.3
Author: KG
AACSB: Analytical reasoning
24) The above figure shows the domestic market for tomatoes. Suppose this market is isolated
from global competition and there is a support price set at $16. In this figure, what area equals
the total subsidy paid to tomato farmers?
A) area E
B) area B + area C + area D + area F
C) area C + area D + area E + area G
D) area A
E) area F
Skill: Level 3: Using models
Section: Checkpoint 7.3
Author: KG
AACSB: Analytical reasoning
25) Price supports are generally used in
A) labor markets.
B) industrial markets.
C) housing markets.
D) markets for services.
E) agricultural markets.
Skill: Level 1: Definition
Section: Checkpoint 7.3
Author: STUDY GUIDE
AACSB: Reflective thinking
73
Copyright © 2011 Pearson Education, Inc.
26) To have an effective price support program, the government must
i. isolate the domestic market from the world market
ii. pay the farmers a subsidy
iii. introduce a price floor
A) i only
B) ii only
C) iii only
D) ii and iii
E) i, ii, and iii
Skill: Level 2: Using definitions
Section: Checkpoint 7.3
Author: STUDY GUIDE
AACSB: Reflective thinking
27) A price support directly sets the
A) amount of production.
B) subsidy the government must receive from producers.
C) equilibrium quantity.
D) lowest price for which the good may be sold.
E) highest price for which the good may be sold.
Skill: Level 1: Definition
Section: Checkpoint 7.3
Author: STUDY GUIDE
AACSB: Reflective thinking
28) To keep the price at the level set by a price support, the government must
A) buy some of the good.
B) sell some of the good.
C) receive a subsidy from the producers.
D) insure that imports are readily available.
E) be careful to always set the price support below the equilibrium price.
Skill: Level 1: Definition
Section: Checkpoint 7.3
Author: STUDY GUIDE
AACSB: Reflective thinking
74
Copyright © 2011 Pearson Education, Inc.
29) With a price support program, who receives a subsidy?
A) only consumers
B) only producers
C) the government
D) importers
E) both consumers and producers receive a subsidy
Skill: Level 1: Definition
Section: Checkpoint 7.3
Author: STUDY GUIDE
AACSB: Reflective thinking
30) When a price support is set above the equilibrium price, producers ________ the quantity
supplied and consumers ________ the quantity demanded.
A) increase; increase
B) increase; decrease
C) decrease; increase
D) decrease; decrease
E) do not change; do not change
Skill: Level 2: Using definitions
Section: Checkpoint 7.3
Author: STUDY GUIDE
AACSB: Reflective thinking
31) An effective price support ________ producers and ________ a deadweight loss.
A) has no effect on; does not create
B) benefits; creates
C) harms; creates
D) benefits; does not create
E) harms; does not create
Skill: Level 3: Using models
Section: Checkpoint 7.3
Author: STUDY GUIDE
AACSB: Reflective thinking

75
Copyright © 2011 Pearson Education, Inc.
7.4 Chapter Figures
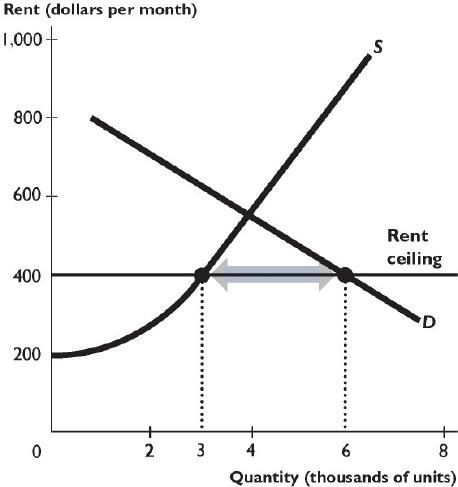
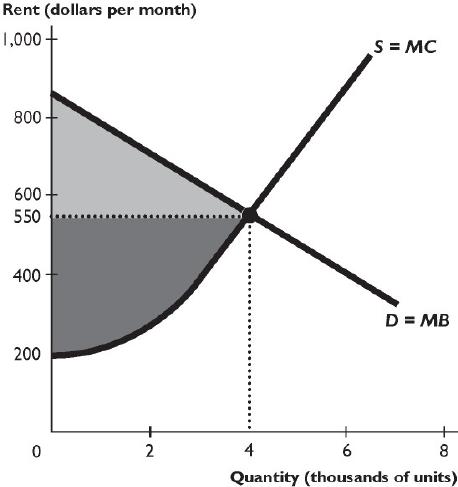
The figure above shows the supply and demand curves in the market for rental housing. A rent
ceiling is set at $400 per month.
1) In the figure above, with the rent ceiling the quantity of housing supplied is ________ units,
the quantity demanded is ________ units, and the quantity rented is ________ units.
A) 3,000; 6,000; 3,000
B) 3,000; 6,000; 6,000
C) 3,000; 6,000; 4,000
D) 3,000; 3,000; 3,000
E) 4,000; 4,000; 4,000
Skill: Level 3: Using models
Section: Checkpoint 7.1
Author: CO
AACSB: Analytical reasoning
76
Copyright © 2011 Pearson Education, Inc.
2) In the figure above, with the rent ceiling
A) there is a shortage of 3,000 units.
B) there is a surplus of 3,000 units.
C) there is a surplus of 2,000 units.
D) there is a shortage of 1,000 units.
E) the market is in equilibrium.
Skill: Level 3: Using models
Section: Checkpoint 7.1
Author: CO
AACSB: Analytical reasoning
3) In the figure above, with the rent ceiling ________ units of housing are available, and black
market rents might be as high as ________ a month.
A) 3,000; $625
B) 6,000; $400
C) 3,000; $550
D) 4,000; $550
E) 4,000; $625
Skill: Level 3: Using models
Section: Checkpoint 7.1
Author: CO
AACSB: Analytical reasoning
77
Copyright © 2011 Pearson Education, Inc.
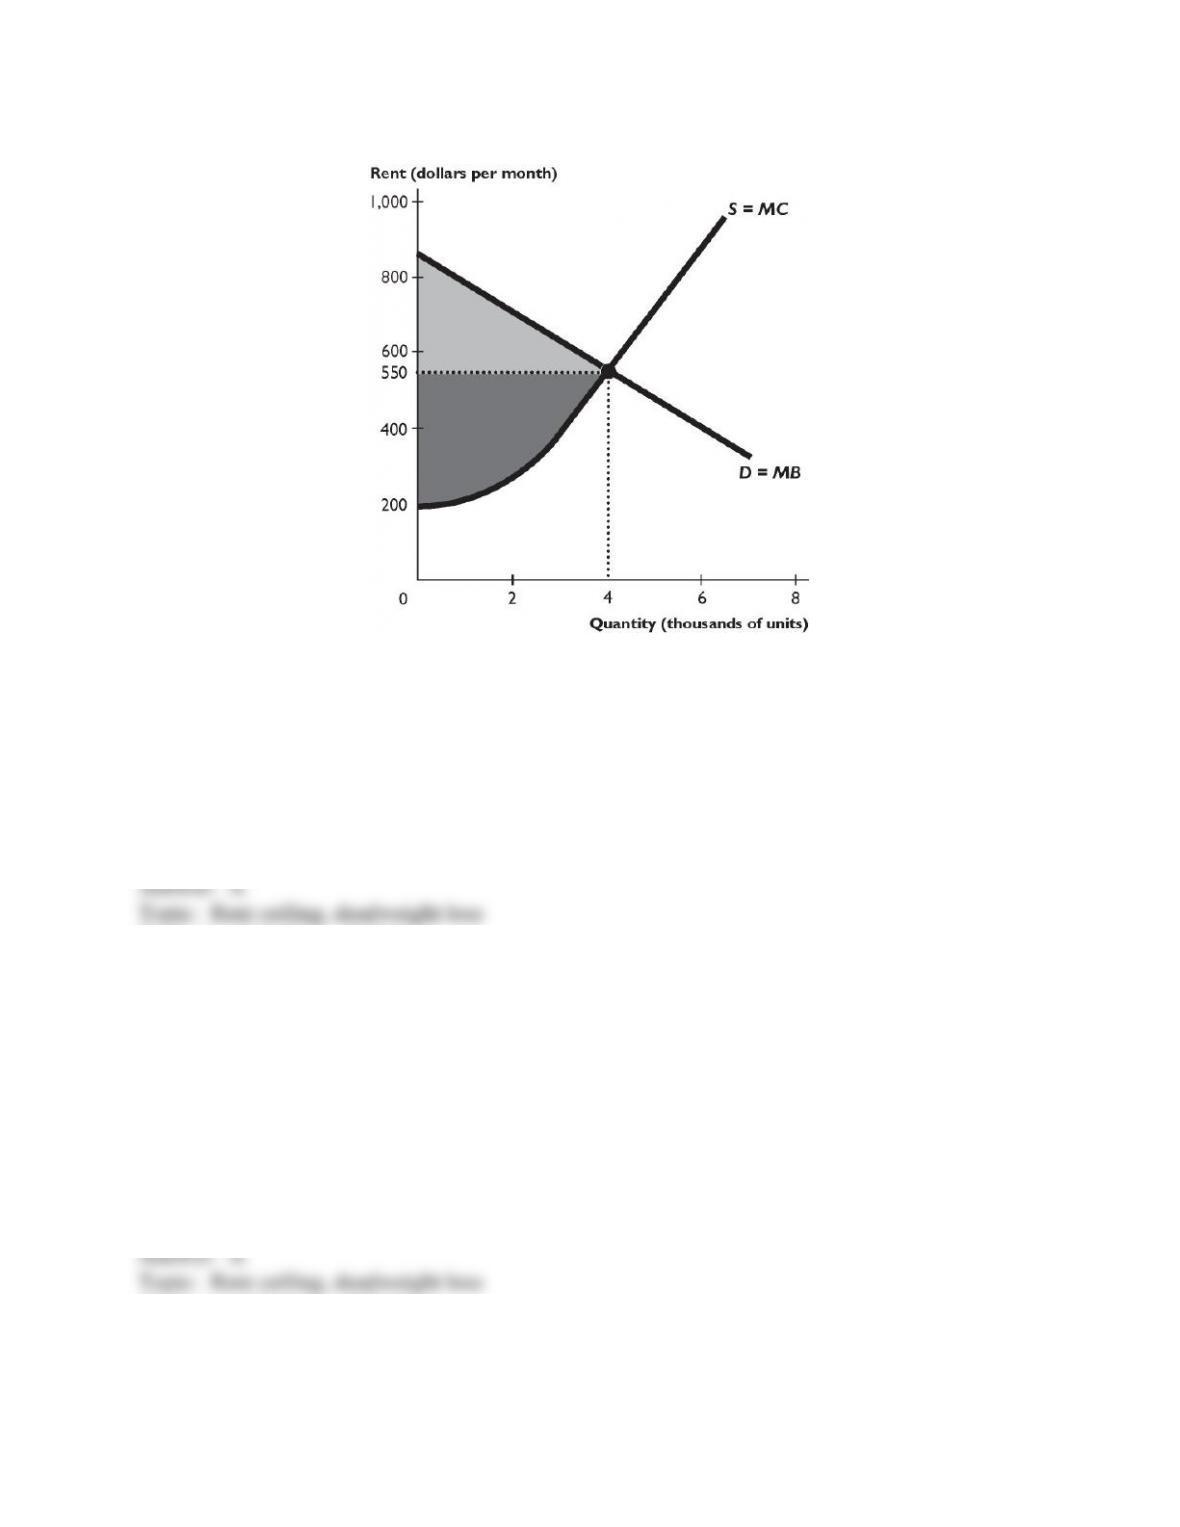
The figure above shows the supply and demand curves in the market for rental housing. A rent
ceiling is set at $400 per month.
4) As shown in the figure above, the rent ceiling
A) decreases consumer surplus.
B) increases producer surplus.
C) decreases deadweight loss.
D) increases the quantity of housing rented.
E) is efficient.
Skill: Level 2: Using definitions
Section: Checkpoint 7.1
Author: CO
AACSB: Analytical reasoning
5) As shown in the figure above, the rent ceiling ________ consumer surplus and ________
producer surplus.
A) decreases; decreases
B) decreases; increases
C) increases; increases
D) increases; decreases
E) decreases; does not change
Skill: Level 2: Using definitions
Section: Checkpoint 7.1
Author: CO
AACSB: Analytical reasoning
78
Copyright © 2011 Pearson Education, Inc.
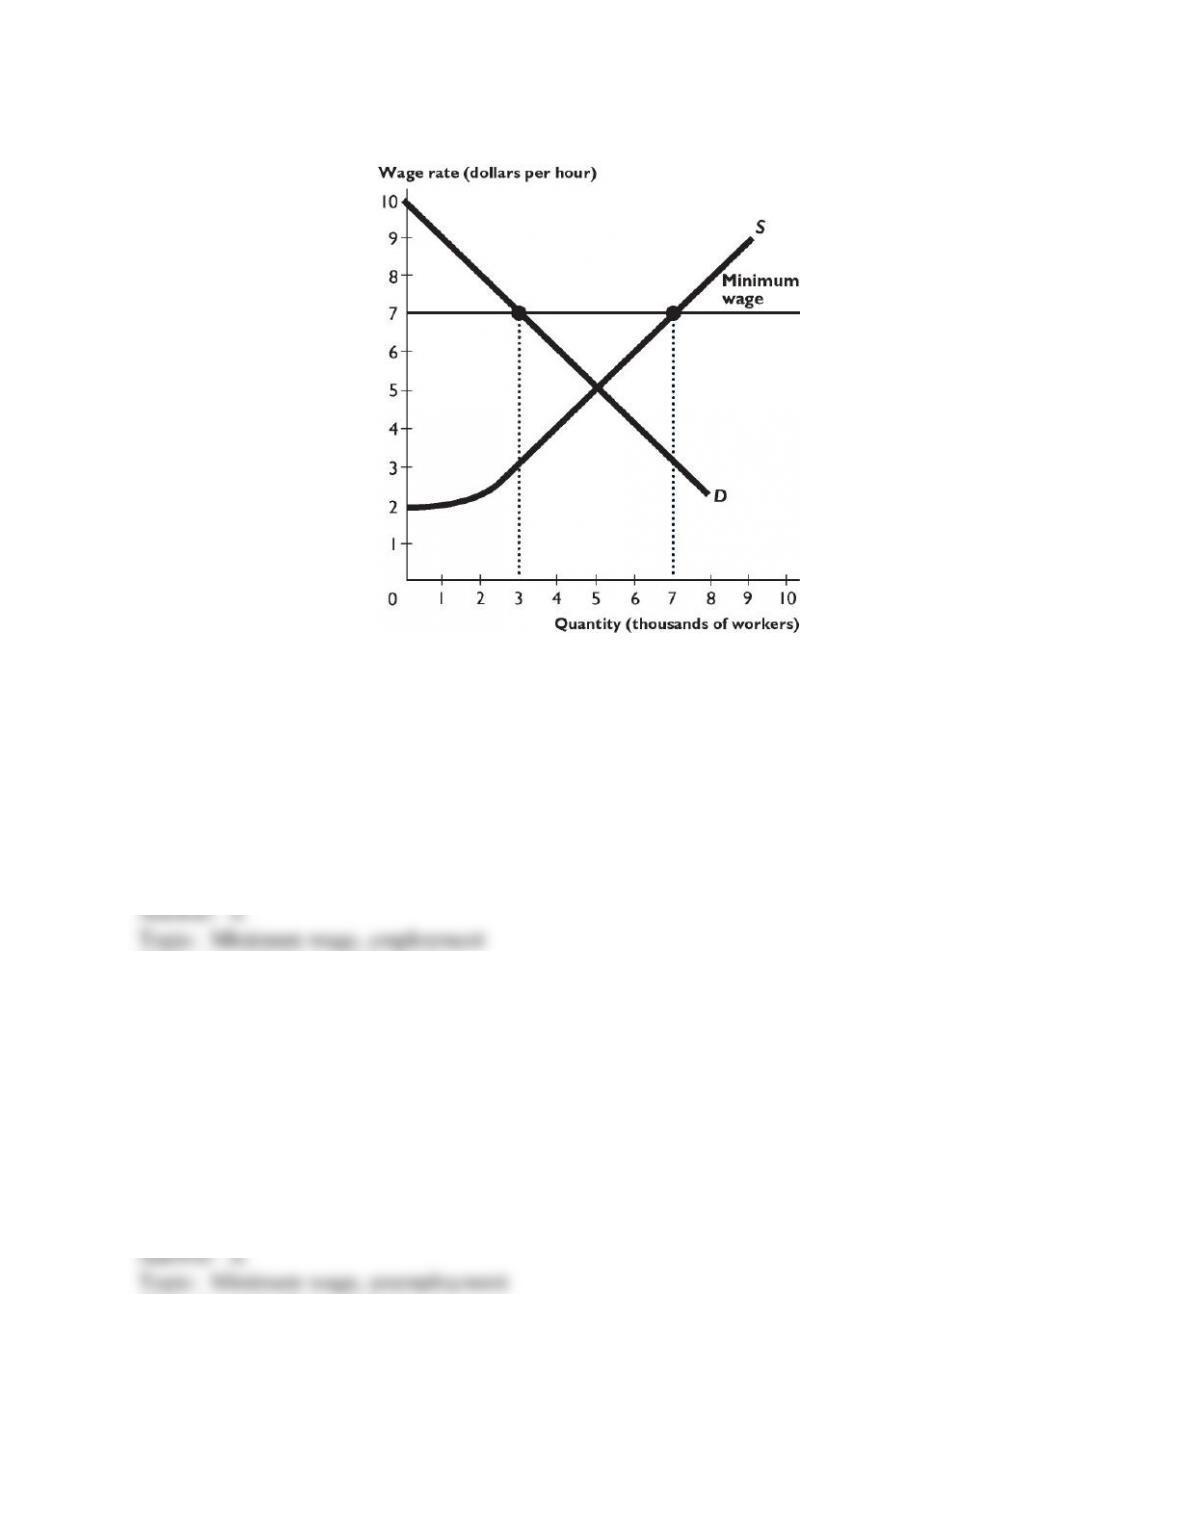
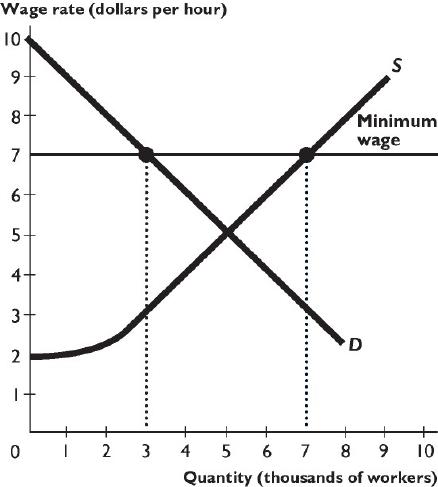
The figure above shows supply and demand in the market for labor. The government introduces
a minimum wage of $7 per hour.
6) In the figure above, the number of workers employed is ________, and the wage paid is
________.
A) 3,000; $7 per hour
B) 7,000; $7 per hour
C) 5,000; $5 per hour
D) 5,000; $7 per hour
E) 3,000; $5 per hour
Skill: Level 2: Using definitions
Section: Checkpoint 7.2
Author: CO
AACSB: Analytical reasoning
7) In the figure above, the number of unemployed workers is
A) 4,000.
B) 3,000.
C) 2,000.
D) 5,000.
E) zero.
Skill: Level 2: Using definitions
Section: Checkpoint 7.2
Author: CO
AACSB: Analytical reasoning

79
Copyright © 2011 Pearson Education, Inc.
8) The figure above shows that the lowest wage rate for which someone is willing to work is
A) $3 an hour.
B) $5 an hour.
C) $6 an hour.
D) $7 an hour.
E) $4 an hour.
Skill: Level 3: Using models
Section: Checkpoint 7.2
Author: CO
AACSB: Analytical reasoning
9) In the figure above, the deadweight loss is
A) $4,000 an hour.
B) $2,000 an hour.
C) $1,000 an hour.
D) $5,000 an hour.
E) zero.
Skill: Level 3: Using models
Section: Checkpoint 7.2
Author: CO
AACSB: Analytical reasoning
10) The figure above shows that the value of the resources used in job-search activity can be as
large as ________ per hour.
A) $12,000
B) $8,000
C) $6,000
D) $4,000
E) $2,000
Skill: Level 4: Applying models
Section: Checkpoint 7.2
Author: CO
AACSB: Analytical reasoning
80
Copyright © 2011 Pearson Education, Inc.
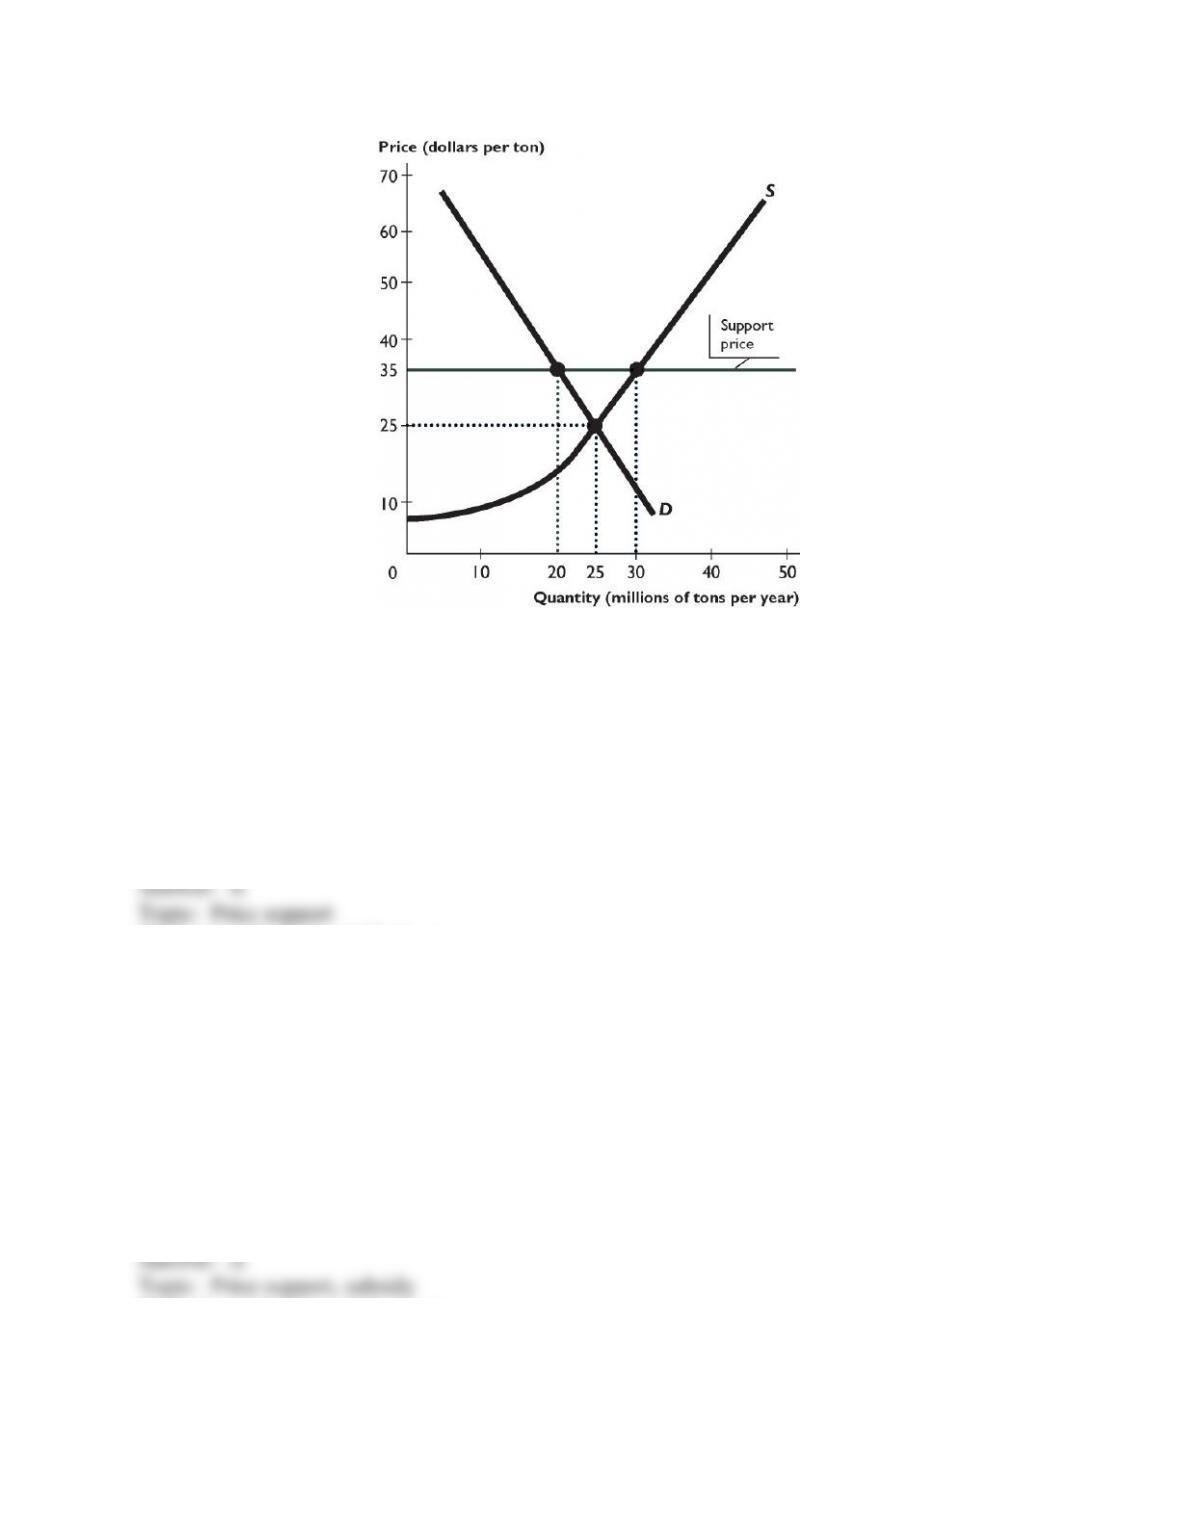
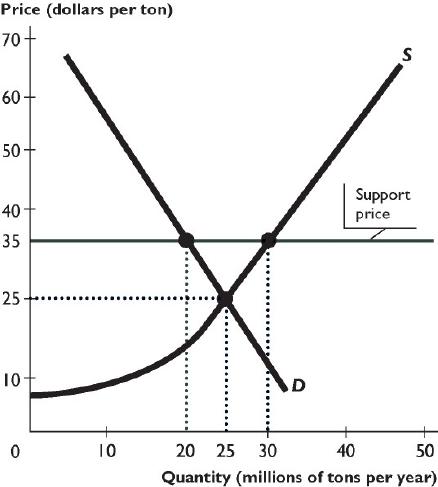
The figure above shows the market for sugar beets. The government intervenes in this market
and sets a support price at $35 a ton.
11) In the figure above, the quantity of sugar beets produced is ________ million tons per year,
and the quantity bought by consumers is ________ million tons per year.
A) 30; 20
B) 20; 30
C) 25; 20
D) 20; 25
E) 25; 25
Skill: Level 2: Using definitions
Section: Checkpoint 7.3
Author: CO
AACSB: Analytical reasoning
12) The figure above shows that to make the price support work, the government buys ________
million tons of sugar beets.
A) 10
B) 20
C) 30
D) 5
E) 15
Skill: Level 2: Using definitions
Section: Checkpoint 7.3
Author: CO
AACSB: Analytical reasoning