21) It is expected that the price of a bushel of wheat will increase in one month. This belief will
result in
A) an increase in the current supply of wheat.
B) a decrease in the current supply of wheat.
C) a decrease in the future supply of wheat.
D) no change in the current or future supply of wheat.
E) an increase in the current quantity supplied of wheat.
22) If the number of companies producing memory chips increases, then the
A) supply of memory chips does not change.
B) supply of memory chips increases.
C) supply of memory chips decreases.
D) quantity of memory chips supplied increases.
E) demand for memory chips increases.
23) An increase in the number of fast-food restaurants
A) raises the price of fast-food meals.
B) increases the demand for fast-food meals.
C) increases the supply of fast-food meals.
D) increases the demand for substitutes for fast-food meals.
E) increases both the demand and supply of fast-food meals.
24) An increase in the number of pineapple growers results in
A) an increase in the quantity of pineapples supplied and no shift in the supply curve of
pineapples.
B) an increase in the supply of pineapples and a rightward shift in the supply curve of
pineapples.
C) an increase in the supply of pineapples and a leftward shift in the supply curve of pineapples.
D) no change in the supply of pineapples and a movement along the supply curve of pineapples.
E) None of the above answers is correct.
25) If the number of sellers decreases, then the supply curve ________ and the supply ________.
A) shifts rightward; increases
B) shifts rightward; decreases
C) shifts leftward; increases
D) shifts leftward; decreases
E) does not shift; does not change but there is a decrease in the quantity supplied
26) Which of the following results in an increase in the supply of a good or service?
A) a fall in the price of the good or service
B) a smaller number of sellers producing the good or service
C) an increase in foreign imports of the good or service
D) higher taxes imposed upon producers of the good or service
E) a rise in the price of the good or service
27) Researchers have found a hybrid of corn that is cheaper to grow. This technological
breakthrough
A) increases the demand for corn.
B) increases the supply of corn.
C) decreases the supply of corn.
D) Both answers A and C are correct.
E) Both answers A and B are correct.
28) Suppose over the next several years the productivity of firms producing electric cars
improves dramatically. The advance in productivity leads to
A) a decrease in the supply of electric cars so that the supply curve shifts leftward.
B) a decrease in the supply of electric cars so that the supply curve shifts rightward.
C) an increase in the supply of electric cars so that the supply curve shifts leftward.
D) an increase in the supply electric cars so that the supply curve shifts rightward.
E) no change in the supply of electric cars, only a change in the quantity supplied of electric cars.
29) Which of the following increases the supply of a good and shifts its supply curve rightward?
A) a smaller number of producers
B) a higher wage paid to workers in the industry
C) a technological advance in how the good is produced
D) an increase in the cost of the resources used to produce the good
E) an increase in the price of the good
30) Which of the following increases the supply of a good?
A) a decrease in the price of a complement in production
B) producers expect higher prices for the good in the future
C) productivity improves
D) prices of inputs used to produce the good rise
E) The number of producers decreases.
31) Advances in productivity increase supply because they
A) increase the price expected in the future.
B) decrease the number of goods available.
C) decrease the cost of production.
D) raise the prices of resources used to produce the good.
E) increase the number of firms producing the good.
32) The number of corn producers increases, so the supply of corn ________ and the supply
curve of corn ________.
A) increases; shifts rightward
B) increases; shifts leftward
C) decrease; shifts rightward
D) decreases; shifts leftward
E) increases; does not shift
33) Which of the following shifts the supply curve for oranges?
A) disastrous weather that destroys about half of this year’s orange crop
B) a newly discovered increase in the nutritional value of oranges
C) an increase in the price of bananas, a substitute in consumption for oranges
D) an increase in income for all orange consumers if oranges are a normal good
E) an increase in the number of orange consumers
34) Because of the high cost of fuel, railroads such as Union Pacific Corp and CSX Corp have
increased the price they charge to haul freight. This change means that the
A) demand curve for hauling freight has shifted leftward.
B) supply curve for hauling freight has shifted leftward.
C) demand curve for hauling freight has shifted rightward.
D) supply curve for hauling freight has shifted rightward.
E) neither the supply curve nor the demand curve for hauling freight has shifted; the only change
is that the price is higher.
35) Which of the following shifts the supply curve of popcorn leftward?
A) a decrease in the price of popcorn
B) an increase in the price of popcorn
C) a technological development in the production of popcorn
D) a decrease in the number of popcorn suppliers
E) a decrease in the cost of producing popcorn
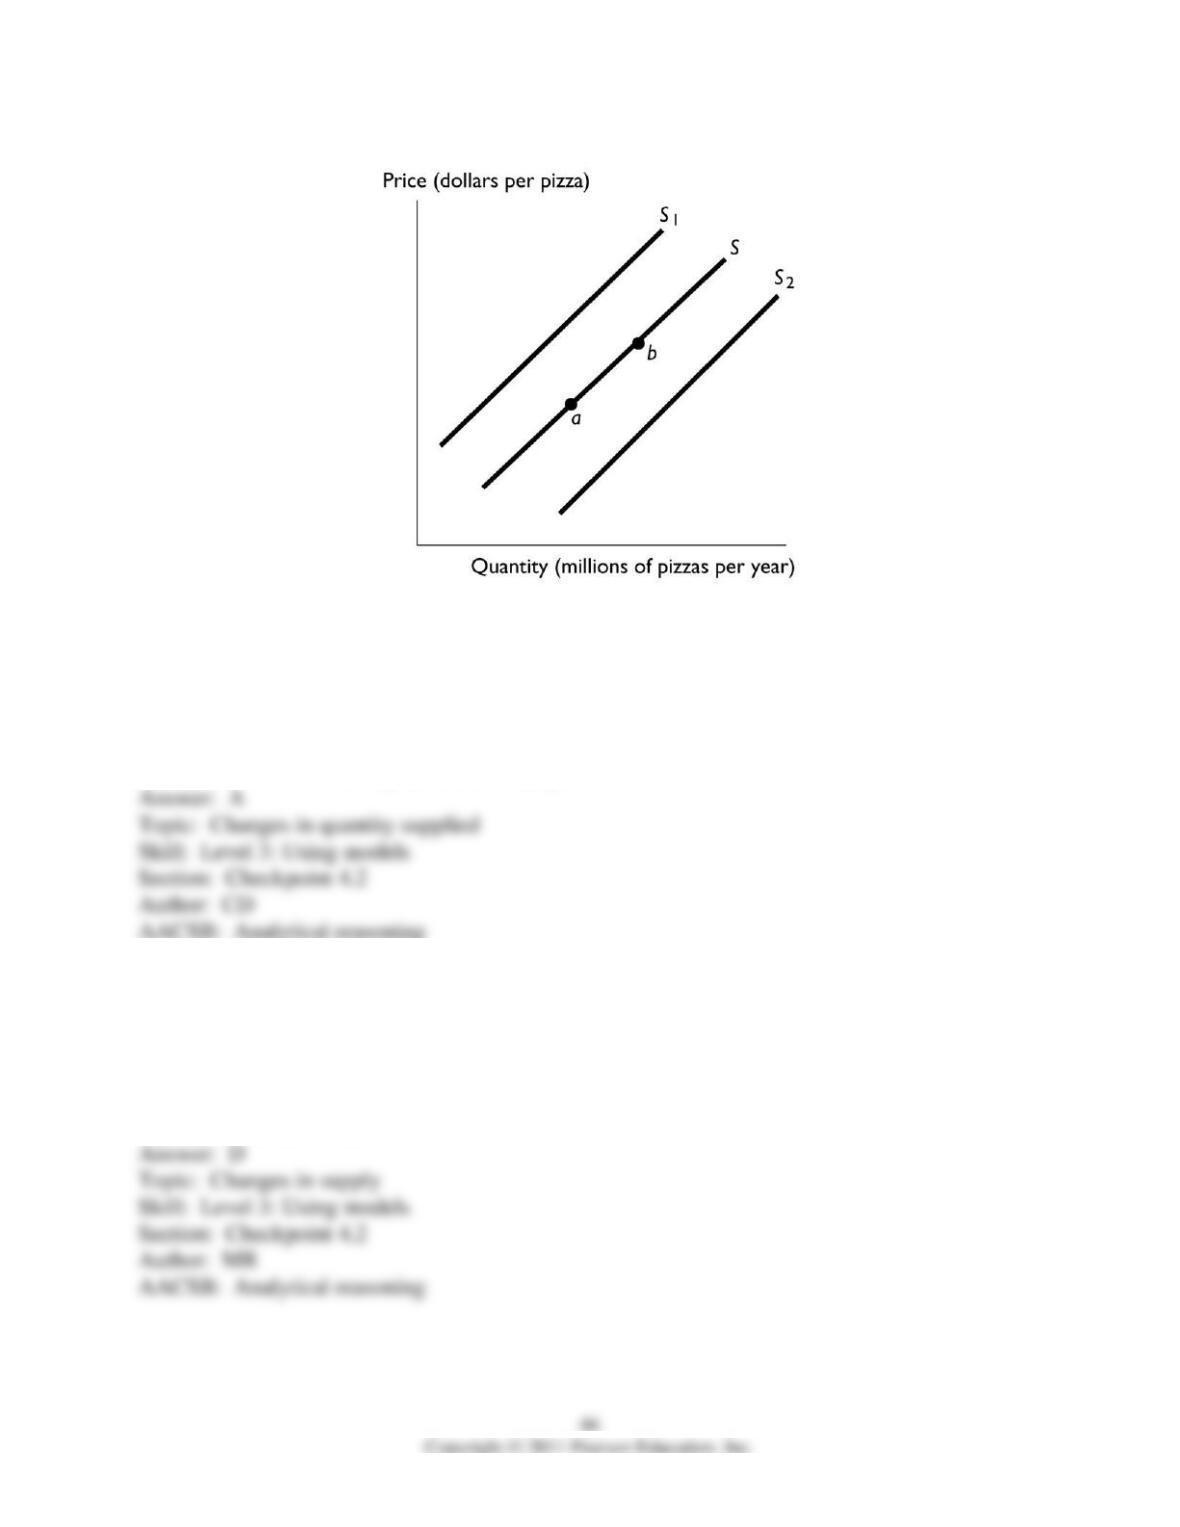
36) In the above figure, the movement from point a to point b reflects
A) an increase in the price of pizza.
B) an increase in the supply of pizza.
C) an increase in the number of producers of pizza.
D) a decrease in the cost of the tomato sauce used to produce pizza.
E) a decrease in income if pizza is a normal good.
37) In the above figure, the shift in the supply curve from S to S1 reflects
A) an increase in the quantity of pizza supplied.
B) a decrease in the quantity of pizza supplied.
C) an increase in the supply of pizza.
D) a decrease in the supply of pizza.
E) None of the above answers is correct.
38) In the above figure, the shift in the supply curve from S to S2 reflects
A) an increase in the quantity of pizza supplied.
B) a decrease in the quantity of pizza supplied.
C) an increase in the supply of pizza.
D) a decrease in the supply of pizza.
E) a decrease in the supply of pizza and a simultaneous decrease in the quantity of pizza
supplied.
39) In the above figure, the shift in the supply curve from S to S2 might reflect
A) a decrease in the cost of the tomato sauce used to produce pizza.
B) a decrease in the number of pizza producers.
C) an increase in the price of a pizza.
D) an increase in income if pizza is a normal good.
E) an increase in the price of a good that is a substitute for consumers.
40) In the above figure, an increase in cost of the cheese used to produce pizza
A) shifts the supply curve from S to S1.
B) shifts the supply curve from S to S2.
C) results in a movement from point a to point b.
D) results in a movement from point b to point a.
E) has no effect.
41) In the above figure, an increase in productivity
A) shifts the supply curve from S to S1.
B) shifts the supply curve from S to S2.
C) results in a movement from point a to point b.
D) results in a movement from point b to point a.
E) has no effect.
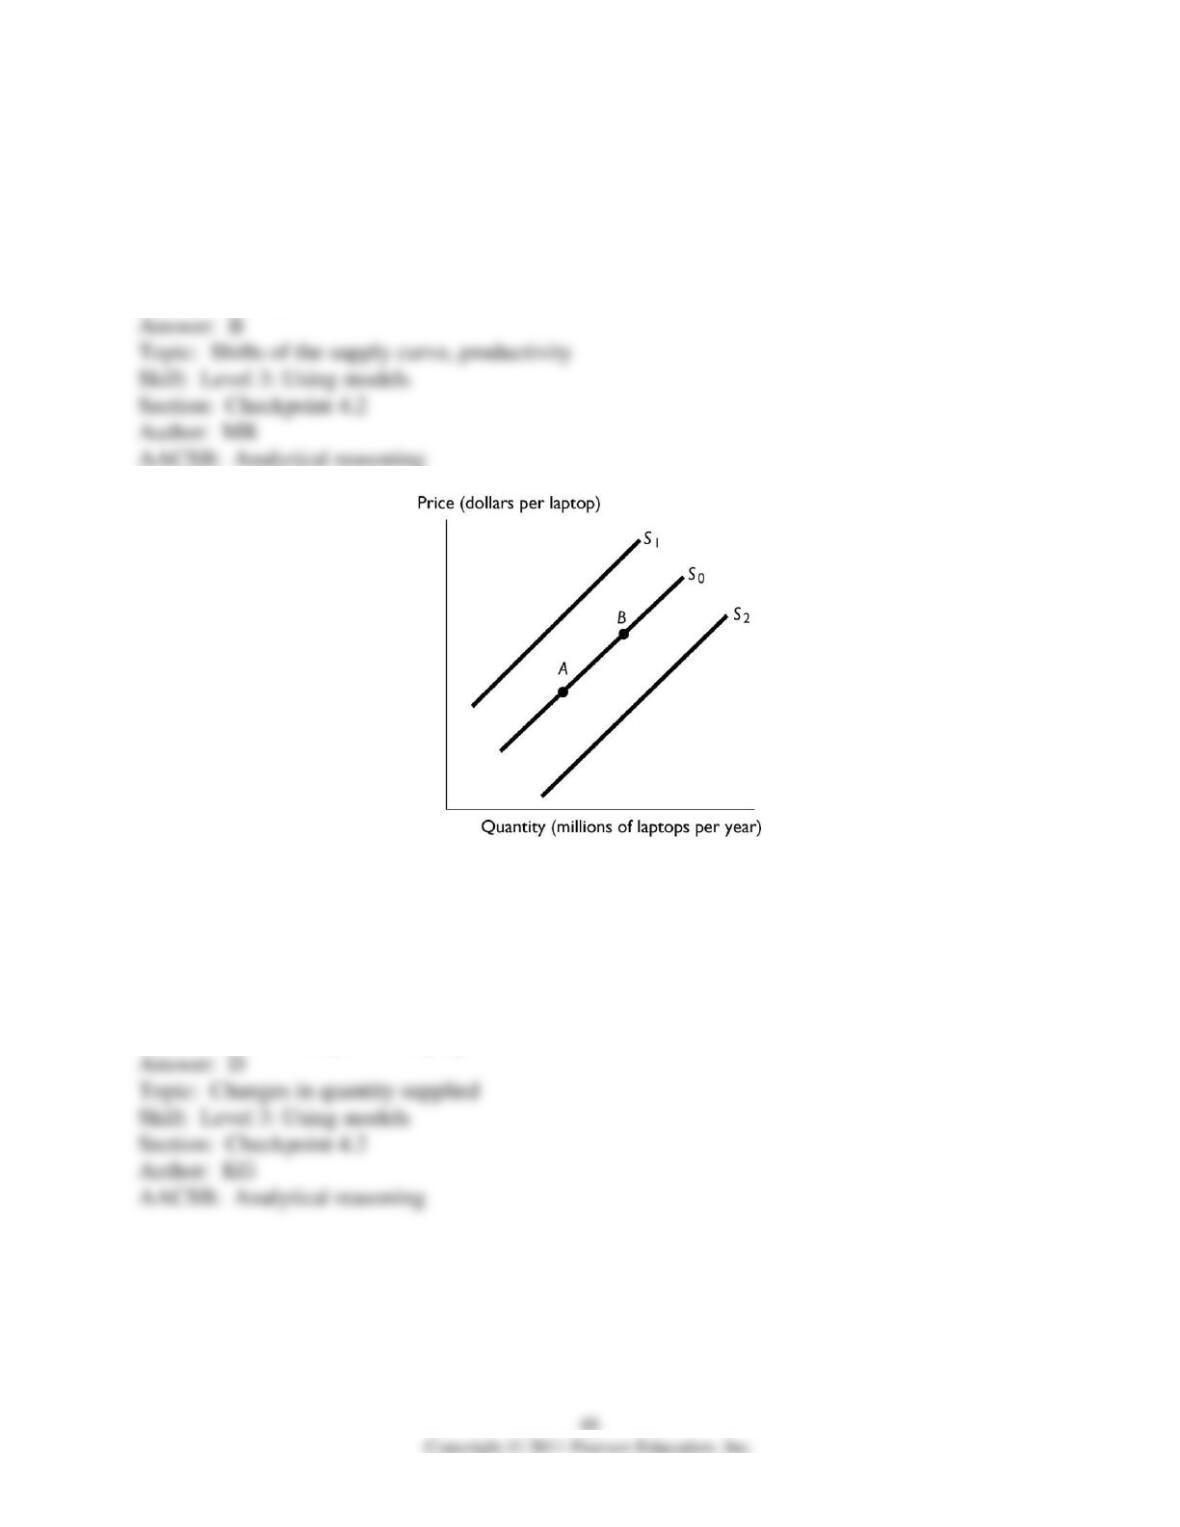
42) The above figure shows the market for laptops. Which of the following causes a movement
from A to B?
A) A decrease in the number of laptop manufactures and sellers.
B) An increase in the productivity of the workers manufacturing laptops.
C) An increase in the cost of hard drives.
D) An increase in the price of laptops.
E) A decrease in the price of laptops.
43) The above figure shows the market for laptops. Which of the following causes a movement
from B to A?
A) An increase in the cost of hard drives.
B) An increase in the productivity of the workers manufacturing laptops.
C) A decrease in the price of laptops.
D) An increase in the price of laptops.
E) An increase in the number of laptop manufactures and sellers.
44) The above figure shows the market for laptops. Which of the following shifts the supply
curve from S0 to S2?
A) An increase in the cost of hard drives.
B) An increase in the productivity of the workers manufacturing laptops.
C) A decrease in the price of laptops.
D) An increase in the price of laptops.
E) A decrease in the number of laptop manufactures and sellers.
45) The above figure shows the market for laptops. Which of the following shifts the supply
curve from S0 to S1?
A) An increase in the cost of hard drives.
B) A decrease in the price of laptops.
C) An increase in the number of laptop manufactures and sellers.
D) An increase in the price of laptops.
E) An increase in the productivity of the workers manufacturing laptops.
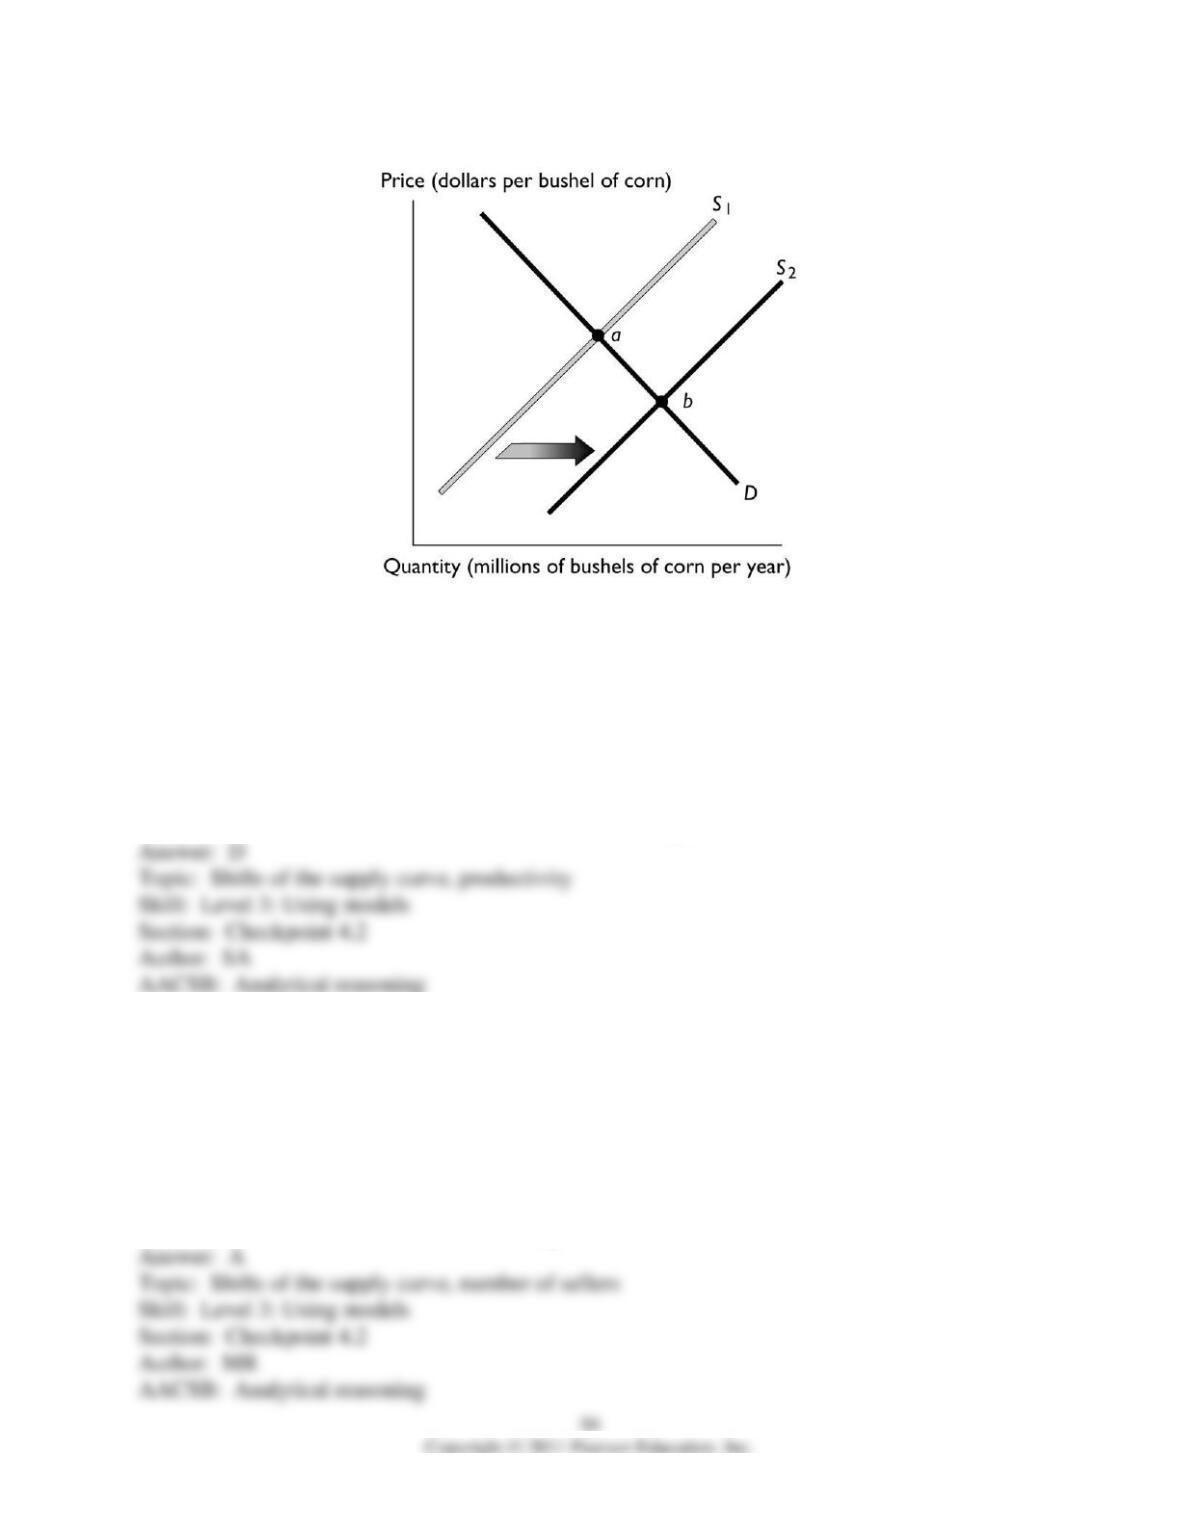
46) The above figure illustrates the market for corn. If point “a” represents the original
equilibrium and point “b” the new equilibrium, which of the following could have caused the
change?
A) an increase in consumers’ preferences for corn
B) an increase in consumers’ income if corn is a normal good
C) an increase in labor costs of producing corn
D) an improvement in the technology of producing corn
E) an increase in consumers’ income if corn is an inferior good
47) The above figure illustrates the market for corn. If point “a” represents the original
equilibrium and point “b” the new equilibrium, which of the following could have caused the
change?
A) an increase in the number of corn growers
B) an increase the price of wheat, a substitute in production for corn
C) an increase in the cost of the fertilizer used to grow the corn
D) a belief among corn farmers that the price of a bushel of corn will be higher next month
E) an increase in income if corn is a normal good
48) The above figure illustrates the market for corn. If point “a” represents the original
equilibrium and point “b” the new equilibrium, which of the following could have caused the
change?
A) a decrease in the number of corn growers
B) a decrease the price of wheat, a substitute in production for corn
C) an increase in the cost of the seed used to grow the corn
D) an decrease in buyers’ incomes if corn is an inferior good
E) an increased belief among buyers that corn is healthy.
49) In the figure above, if point “a” represents the original equilibrium and point “b” the new
equilibrium, then
A) there has been an increase in supply.
B) there has been an increase in demand.
C) there has been a change in the quantity supplied and no change in supply.
D) Both answers B and C are correct.
E) Both answers A and B are correct.
50) Autoworkers negotiate a wage increase. How does this change affect the supply curve of
cars?
A) It shifts the supply curve leftward.
B) It shifts the supply curve rightward.
C) It does not shift the supply curve or create a movement along it.
D) The supply curve will shift but there is not enough information to tell if the change shifts the
supply curve rightward, leftward, or not at all.
E) It creates a movement downward along the supply curve.
51) Which of the following leads to an increase in the quantity supplied but not an increase in
supply?
A) a decrease in the costs of production
B) an increase in the product’s price
C) an advance in the technology used to produce the good
D) an increase in the price of another product that the suppliers can produce
E) an increase in the number of firms producing the good or service
52) The price of salsa rises. How does the increase in the price of salsa affect the supply of salsa?
A) The supply of salsa increases.
B) The supply of salsa decreases.
C) There is no change to either the supply of salsa or the quantity of salsa supplied.
D) There is no change to the supply of salsa but the quantity of salsa supplied increases.
E) There is no change to the supply of salsa but the quantity of salsa supplied decreases.
53) If a higher price for wheat decreases the quantity of corn being produced, which of the
following describes what has occurred?
A) The supply of wheat increased and the supply of corn decreased.
B) The quantity of wheat supplied increased and quantity of corn supplied decreased.
C) The supply of wheat increased and the quantity of corn supplied decreased
D) The quantity of wheat supplied increased and the supply of corn decreased.
E) The supply of wheat decreased and the supply of corn decreased.
54) “Other things remaining the same, if the price of a good rises, the quantity supplied of that
good increases.” This sentence describes a
A) shift of a supply curve.
B) shift of the price curve.
C) movement along a supply curve.
D) movement along the price curve.
E) movement along the quantity curve.
55) The quantity supplied of a good, service, or resource is ________ during a specified period
and at a specified price.
A) the amount that people are able to sell
B) the amount that people are willing to sell
C) the amount that people are able and willing to sell
D) the amount that people are willing and able to buy
E) the amount sold
56) The quantity supplied of a good is
A) the same thing as the quantity demanded at each price.
B) the amount that the people are willing and able to sell during a given time period at a
specified price.
C) equal to the difference between the quantity available and the quantity desired by all
consumers and producers.
D) the amount the firm will sell when it can sell all it wants.
E) is always larger than the quantity demanded at each price.
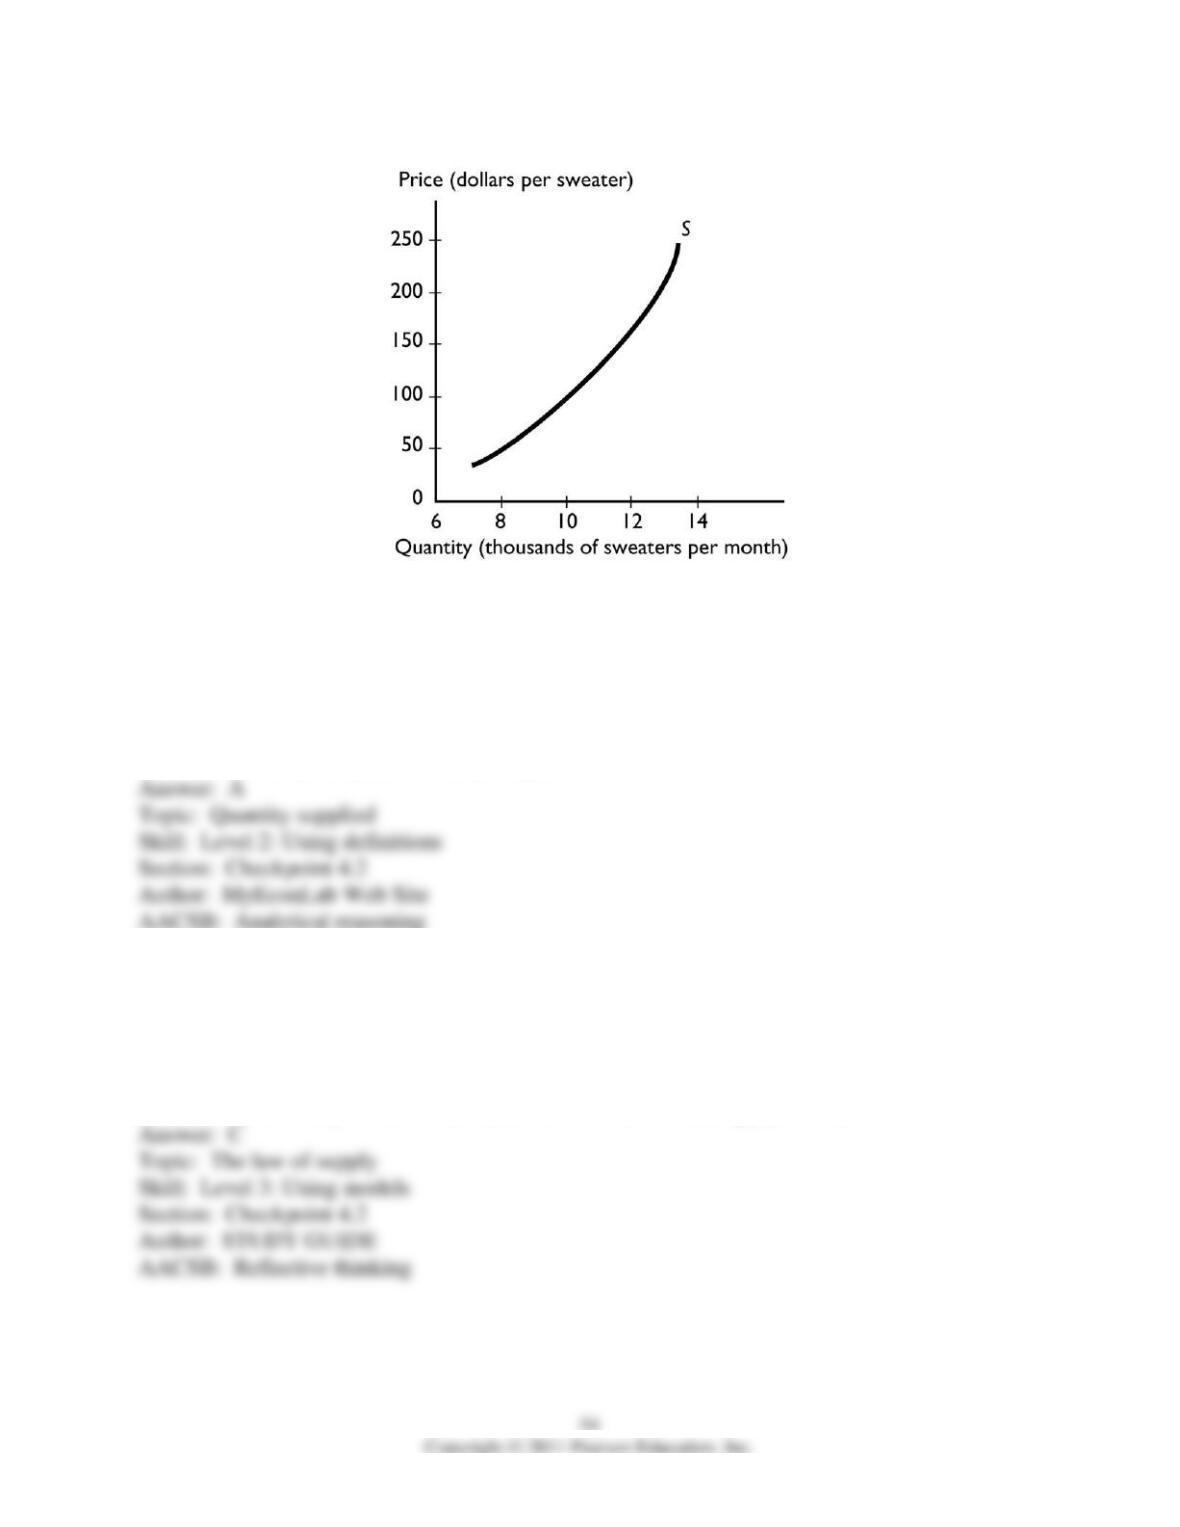
57) The graph illustrates the supply of sweaters. Which of the following events will increase the
quantity supplied of sweaters?
A) a rise in the price of a sweater
B) a rise in the wage rate paid to the workers who make sweaters
C) a rise in the expected future price of a sweater
D) an increase in the number of sellers of sweaters
E) a decrease in the number of sweater buyers
58) Which of the following indicates that the law of supply applies to makers of soda?
A) An increase in the price of a soda leads to an increase in the demand for soda.
B) An increase in the price of a soda leads to an increase in the supply of soda.
C) An increase in the price of a soda leads to an increase in the quantity of soda supplied.
D) A decrease in the price of a soda leads to an increase in the quantity of soda demanded.
E) A decrease in the price of a soda leads to an increase in the supply of soda.
59) One reason supply curves have an upward slope is because
A) increased supply will require increased technology.
B) people will pay a higher price when less is supplied.
C) a higher price brings a greater profit, so firms want to sell more of that good.
D) to have more of the good supplied requires more firms to open.
E) None of the above answers is correct because supply curves have a downward slope.
60) The market supply curve is the ________ of the ________.
A) horizontal sum; individual supply curves
B) vertical sum; individual supply curves
C) horizontal sum; individual supply curves minus the market demand
D) vertical sum; individual supply curves minus the market demand
E) vertical average; of the individual supply curves
61) If the costs to produce pizza increase, which will occur?
A) The supply of pizza will decrease.
B) The quantity of pizzas supplied will increase as sellers try to cover their costs.
C) Pizza will cease to be produced and sold.
D) The demand curve for pizza will shift leftward when the price of a pizza increases.
E) The demand curve for pizza will shift rightward when the price of a pizza increases.
62) A rise in the price of a substitute in production for a good leads to
A) an increase in the supply of that good.
B) a decrease in the supply of that good.
C) no change in the supply of that good; instead there is a change in the quantity supplied.
D) a decrease in the quantity of that good supplied.
E) no change in either the supply or the quantity supplied of the good.
63) Suppose the price of leather used to produce shoes increases. The higher price of leather
________ the supply of shoes and the supply curve of shoes ________.
A) increases; shifts rightward
B) increases; shifts leftward
C) decreases; shifts rightward
D) decreases; shifts leftward
E) does not change; does not shift
64) An increase in the number of producers of bird seed ________ the supply of bird seed and
shifts the supply curve of bird seed ________.
A) increases; rightward
B) increases; leftward
C) decreases; rightward
D) decreases; leftward
E) does not change; rightward
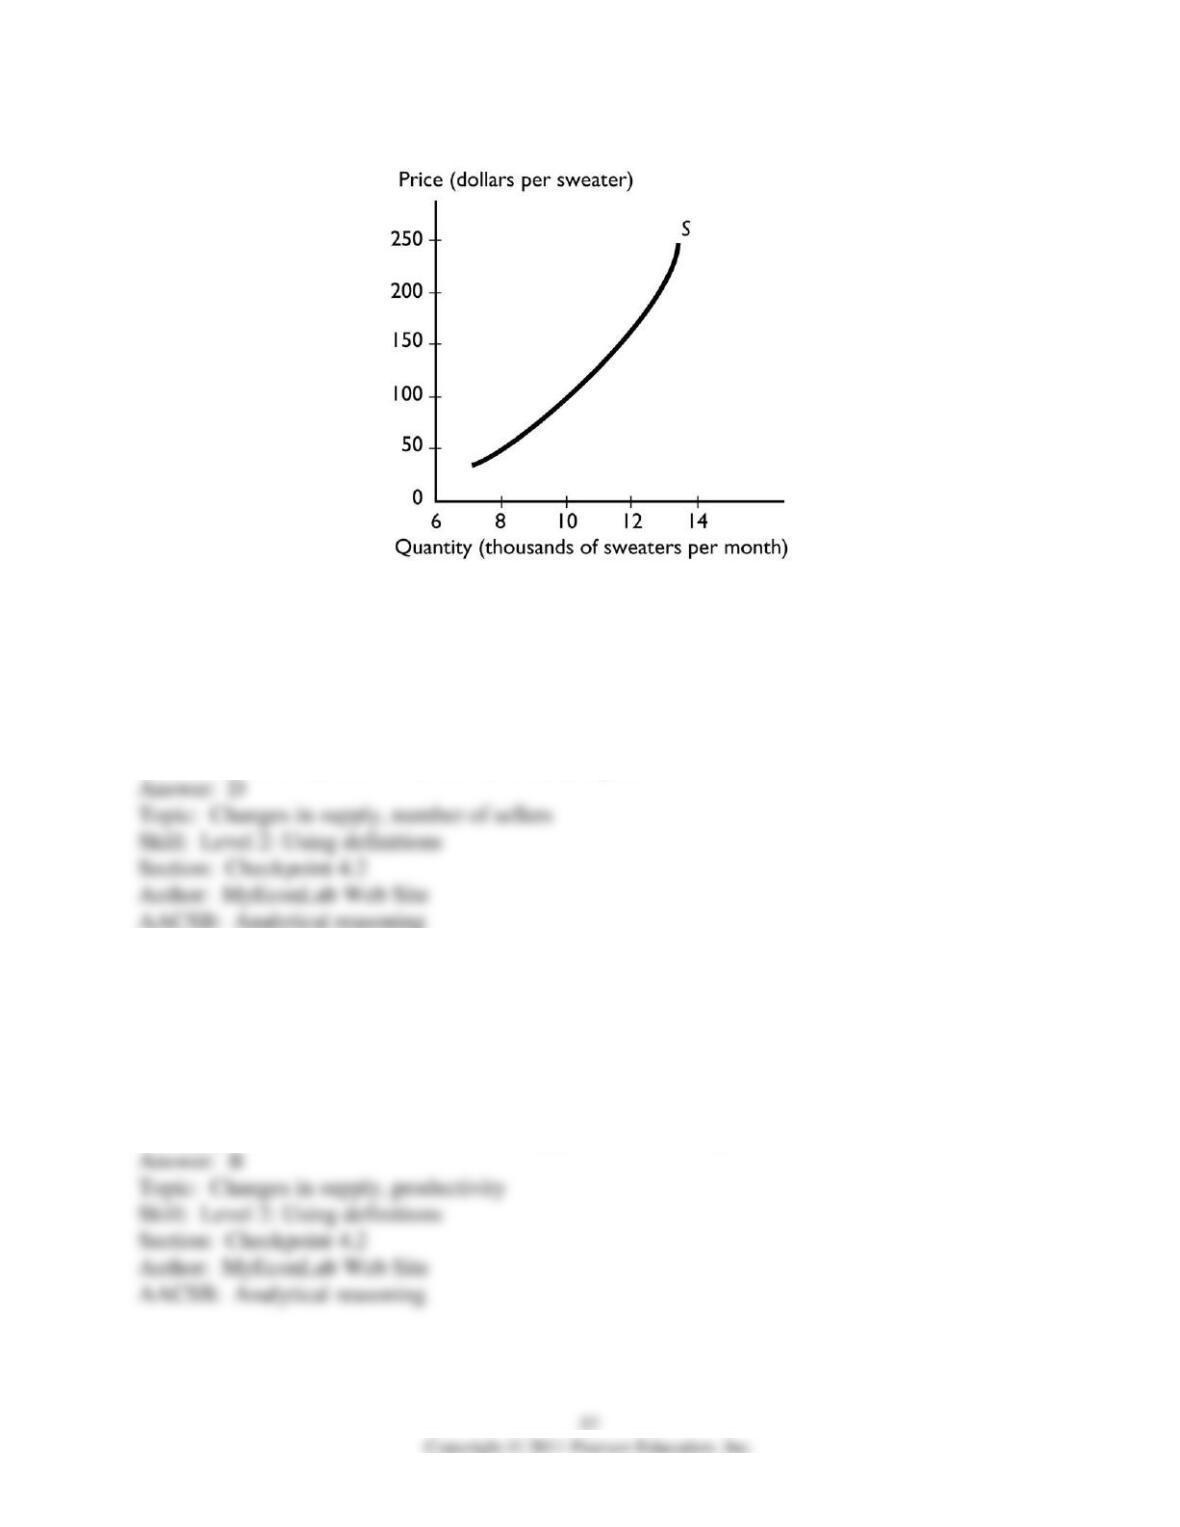
65) The graph illustrates the supply of sweaters. Which of the following events will increase the
supply of sweaters?
A) a rise in the price of a sweater
B) a rise in the wage rate paid to the workers who make sweaters
C) a rise in the expected future price of a sweater
D) an increase in the number of sellers of sweaters
E) an increase in income if sweaters are a normal good
66) The graph illustrates the supply of sweaters. As the technology used to produce sweaters
improves, the
A) supply of sweaters decreases and the demand for sweaters does not change.
B) supply of sweaters increases and the demand for sweaters does not change.
C) quantity of sweaters supplied increases.
D) quantity of sweaters supplied decreases.
E) supply of sweaters increases and the demand for sweaters increases.
67) An increase in the productivity of producing jeans results in
A) the quantity of jeans supplied increasing.
B) the supply of jeans increasing.
C) buyers demanding more jeans because they are now more efficiently produced.
D) buyers demanding fewer jeans because their price will fall, which signals lower quality.
E) some change but the impact on the supply of jeans is impossible to predict.
68) A change in the price of a good ________ its supply curve and ________ a movement along
its supply curve.
A) shifts; causes
B) shifts; does not cause
C) does not shift; causes
D) does not shift; does not cause
E) None of the above because the change in the price might cause either a shift in the supply
curve or a movement along the supply curve depending on the size of the change.
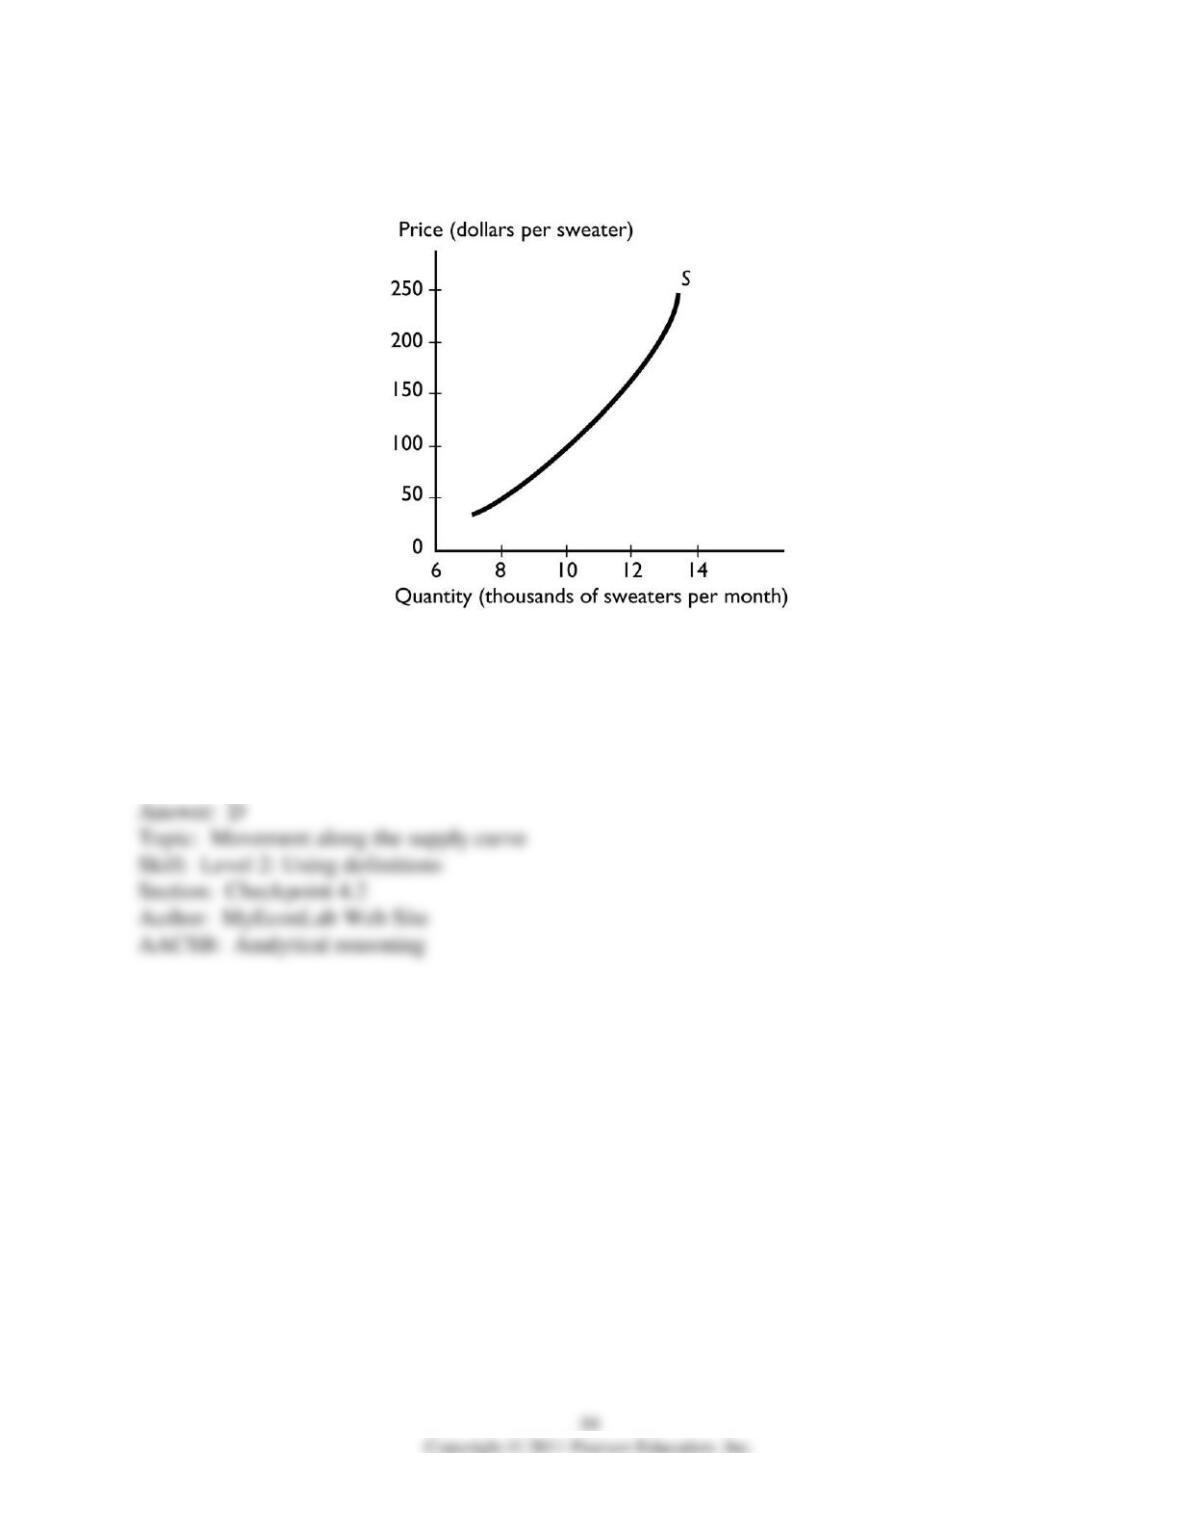
69) The graph illustrates the supply of sweaters. A fall in the price of sweaters brings
A) a movement along the supply curve.
B) a decrease in the quantity supplied of sweaters.
C) a shift of the supply curve.
D) Both answers A and B are correct.
E) Both answers B and C are correct.
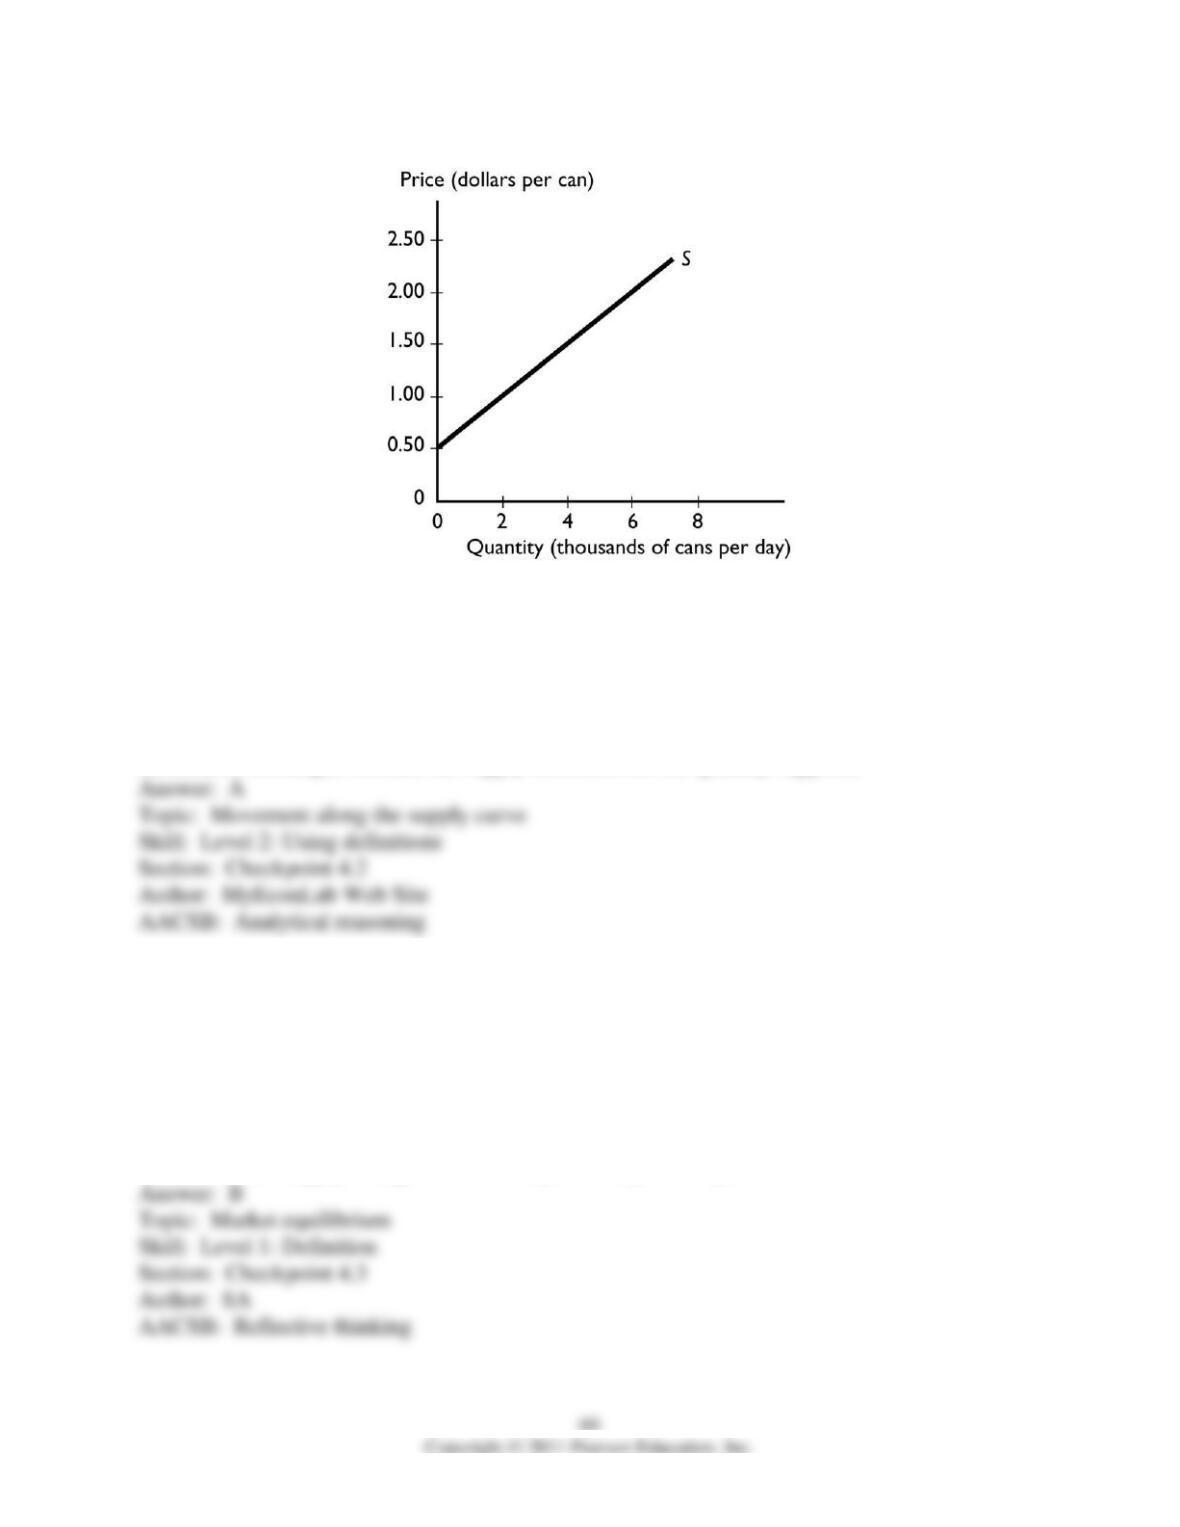
70) The graph illustrates the supply of soda. If the price of soda rises from $0.50 a can to $1.50 a
can, the quantity of soda supplied
A) increases from 0 cans to 4,000 cans a day.
B) decreases from 4,000 cans to 0 cans a day.
C) remains unchanged because the supply increases not the quantity supplied.
D) increases from 0 to 6,000 cans a day.
E) remains unchanged because the supply decreases not the quantity supplied.
4.3 Market Equilibrium
1) Market equilibrium occurs when
A) all markets become equal.
B) the quantity demanded equals the quantity supplied.
C) opposing forces pull demand and supply apart.
D) demand and supply move in opposite direction.
E) demand and supply change so that are equal at all possible prices.