Unlock document.
This document is partially blurred.
Unlock all pages and 1 million more documents.
Get Access
76) The Latin phrase ceteris paribus is best defined as
A) the rational choice is made.
B) benefits are greater than the costs.
C) other things remaining the same.
D) the tendency for the values of two variables to move together in a predictable and related
way.
E) the study of choice.
77) The Latin phrase ceteris paribus means
A) let the buyer beware.
B) other things remaining the same.
C) positive, not normative.
D) normative, not positive.
E) on the margin.
78) Ceteris paribus means
A) variables are correlated.
B) after this, therefore because of this.
C) people must make choices.
D) other things remaining the same.
E) social interest is the same as self interest.
79) Which of the following is an example of ceteris paribus?
A) varying both temperature and the amount of rain to decide how hardy a new plant is
B) holding caloric intake the same as you decide how exercising affects your weight
C) allowing the dosages to change as you investigate how two new drugs compare
D) varying both the options available and the price of PCs to investigate what has happened to
the demand for PCs
E) assuming that correlation does not mean causation
80) Economists try to isolate the effect of one variable at a time. They do so by
A) holding all other relevant factors the same.
B) imagining a real world.
C) assuming that every economic variable changes simultaneously.
D) keeping all variables constant.
E) looking only at decisions made on the margin.
81) "If the price of home heating oil rises, ceteris paribus, people will buy less home heating
oil." This statement is equivalent to which of the following?
A) The relationship between the price of home heating oil and the amount of oil households
purchased are independent of each other.
B) If the price of home heating oil rises and every thing else remains constant, the amount of
home heating oil households purchase will decrease.
C) As the prices for all products including home heating oil rise, people buy less home heating
oil.
D) Because the only way to heat a home is with oil, if the price increases, then households will
purchase less.
E) No matter what else changes, if the price of home heating oil rises, people will buy less home
heating oil.
82) Correlation means
A) "after this, therefore because of this."
B) other things remaining the same.
C) a natural experiment has been conducted.
D) the tendency for the values of two variables to move in a predictable and related way.
E) "on the margin."
83) Correlation means
A) holding everything else constant.
B) after this, therefore because of this.
C) the values of two variables move in a predictable and related way.
D) making statements about how the world should be.
E) the same as causation.
84) The tendency for the values of two variables to move together in a predictable and related
way is
A) ceteris paribus.
B) correlation.
C) part of rational choice.
D) related to marginal cost.
E) an example of thinking on the margin.
85) In examining two variables, we find that as one variable changes, the other changes. These
variables are said to be
A) independent.
B) correlated.
C) statistics.
D) ceteris paribus related.
E) casually related.
86) When economists use the term "correlation," they are referring to
A) cause and effect relationships between variables.
B) how two variables move together in a predictable way.
C) positive economics.
D) normative economics.
E) economic policy.
87) The tendency for the values of two variables to move in a predictable and related way is
known as
A) a natural experiment.
B) a normative relationship.
C) ceteris paribus.
D) correlation.
E) a policy relationship.
88) Opportunity cost is best defined as
A) how much money is paid for something.
B) how much money and time it takes to consume something.
C) the value of the highest-valued alternative that is forgone in making a choice.
D) the total of all other alternatives that are forgone in making a choice.
E) the sunk cost of any decision.
89) John has two hours of free time this evening. He ranked his alternatives, first go to a concert,
second go to a movie, third study for an economics exam, and fourth answer his e-mail. What is
the opportunity cost of attending the concert for John?
A) attending a movie
B) studying for an economics exam
C) answering his e-mail
D) attending a movie, studying for an economics exam, and answering his e-mail
E) going to the concert because that is what John choose to do.
90) Jamie has enough money to buy either a Mountain Dew, or a Pepsi, or a bag of chips. He
chooses to buy the Mountain Dew. The opportunity cost of the Mountain Dew is
A) the Pepsi and the bag of chips.
B) the Pepsi or the bag of chips, whichever the highest-valued alternative forgone.
C) the Mountain Dew.
D) the Pepsi because it is a drink, as is the Mountain Dew.
E) zero because he enjoys the Mountain Dew.
91) Amy can study for an hour or spend that hour sleeping or going out for dinner. If she decides
to study for the hour, the opportunity cost of the hour spent studying is
A) definitely going to sleep.
B) studying since this is the choice she opted for.
C) sleeping or going out for dinner, whichever she would have preferred the most.
D) sleeping and going out for dinner.
E) definitely going out to dinner because she must eat at some time.
92) If there is no scarcity,
A) the opportunity cost of an action would be greater than its sunk cost.
B) an action would have zero opportunity cost.
C) choices are no longer rational.
D) marginal cost of an action is greater than its marginal benefit.
E) all marginal benefits would equal zero.
93) The benefit of an activity is
A) purely objective and measured in dollars.
B) the gain or pleasure that it brings.
C) the value of its sunk cost.
D) measured by what must be given up to get one more unit of the activity.
E) not measurable on the margin.
94) The ________ of something is the gain or pleasure that it brings.
A) opportunity cost
B) benefit
C) marginal cost
D) rational choice
E) rational margin
95) The cost of a one-unit increase in an activity
A) is called the total one-unit cost.
B) is called the marginal cost.
C) decreases as more of the activity is done.
D) is called the marginal benefit/cost.
E) is called the sunk cost.
96) The marginal benefit of an activity is
i. the benefit from a one-unit increase in the activity
ii. the benefit of a small, unimportant activity.
iii. measured by what the person is willing to give up to get one additional unit of the activity.
A) i only
B) ii only
C) iii only
D) i and iii
E) ii and iii
97) The additional benefit of increasing some activity by one-unit is called the
A) marginal benefit.
B) opportunity cost.
C) total benefit.
D) scarcity.
E) sunk benefit.
98) If the marginal benefit of the next slice of pizza exceeds the marginal cost, you will
A) eat the slice of pizza.
B) not eat the slice of pizza.
C) be unable to choose between eating or not eating.
D) eat half the slice.
E) More information is needed about how much the marginal benefit exceeds the marginal cost
to determine if you will or will not eat the slice.
99) When people make rational choices, they
A) behave selfishly.
B) do not consider their emotions.
C) weigh the costs and benefits of their options and act to satisfy their wants.
D) necessarily make a decision in the social interest.
E) are necessarily making the best decision.
100) By donating $1,000 to the Salvation Army, Caroline reduces her taxable income. To
Caroline, the reduction in her taxable income is
A) a marginal benefit.
B) an opportunity cost.
C) an incentive.
D) a marginal cost.
E) the margin.
101) Which of the following is a microeconomic issue?
A) Why has unemployment risen nationwide?
B) Why has economic growth been rapid in China?
C) What is the impact on the quantity of Pepsi purchased if consumers' tastes change in favor of
non-carbonated drinks?
D) Why is the average income lower in Africa than in Latin America?
E) Why did overall production increase within the United States last year?
102) Microeconomics includes the study of
A) how countries decide to fund their budget deficits.
B) the choices that individuals and businesses make.
C) how a nation promotes economic growth.
D) the effect on the national economy of the choices that individuals make.
E) the overall amount of production within the economy.

103) A positive statement
A) must always be right.
B) cannot be tested.
C) might be right or wrong.
D) depends on someone's value judgment.
E) cannot be negative.
104) Which of the following is a positive statement?
A) Taxes should be lower because then people get to keep more of what they earn, so they will
work more.
B) My economics class should last for two terms because it is my favorite class.
C) A 10 percent increase in income leads to a 4 percent increase in the consumption of beef.
D) Given their negative impact on productivity, the government should eliminate labor unions.
E) The class average on this test should be more than 80 percent.
105) Which of the following is NOT a normative economic statement?
A) States should reduce the tax on heating fuel oil during the winter.
B) People over the age of 75 should not be allowed to drive cars.
C) Teenagers are responsible for most driving fatalities.
D) We don't spend enough money on anti-smoking campaigns.
E) The price of gasoline is too high.
106) Which of the following is an example of a normative statement?
A) If cars become more expensive, fewer people will buy them.
B) Car prices should be affordable.
C) If wages increase, firms will fire some workers.
D) Fewer people die in larger cars than in smaller cars.
E) Cars emit pollution.
107) Which of the following statements is the best example of the term ceteris paribus?
A) An economist holds other factors constant when he examines the relationship between tax
rates and tax revenues.
B) More money should be spent on cleaning up the environment.
C) The government budget surplus was $200 billion in 2000 because the economy was growing.
D) An increase in the budget surplus after an increase in tax rates implies that tax rate increases
cause budget surpluses.
E) When studying the effects of a budget deficit, an economist must take account of all the
factors involved.
108) The Latin term "ceteris paribus" means
A) "false unless proven true."
B) "other things remaining the same."
C) "after this, therefore because of this."
D) "what is true of the whole is not necessarily true of the parts."
E) "obviously true."
109) The Latin term ceteris paribus means
A) after this, therefore because of this.
B) other things being equal.
C) what is correct for the part, is not correct for the whole.
D) on the margin.
E) when one variable increases, the other variable decreases.
110) When the Dallas Cowboys score more than 30 points in a game, they win the game. This is
an example of
A) an economic theory.
B) a correlation.
C) ceteris paribus.
D) a normative statement.
E) a statement on the margin.
1.3 Appendix
1) The horizontal axis in a graph
A) measures time on a scatter diagram.
B) measures the quality of a variable.
C) is named the y-axis.
D) is named the x-axis.
E) is called the origin.
2) Most economic graphs have two lines perpendicular to each other. The vertical line is called
the
A) origin.
B) y-axis.
C) x-axis.
D) variable.
E) time axis.
3) The vertical axis in a graph
A) is named the y-axis.
B) is named the x-axis.
C) measures time in a cross-section and time series graph.
D) has no origin.
E) measures time only in a time series graph.
4) Most economic graphs have two lines perpendicular to each other. Where these lines met is
called the
A) origin.
B) y-axis.
C) x-axis.
D) variable.
E) point of beginning.
5) A graph of the value of one variable against the value of another variable is known as a
A) two-dimensional graph.
B) three-dimensional graph.
C) time-series graph.
D) scatter diagram.
E) two-variable graph.
6) A scatter diagram can be used to see
A) if the value of a variable is rising or falling.
B) the value of a variable for different groups in a population.
C) if a relationship exists between two variables.
D) how a variable behaves over time.
E) whether a variable is positively or negatively related to itself.
7) To show how a variable ________, we typically use a ________.
A) relates to another variable; time series graph
B) relates to another variable; pie chart
C) changes over time; time series graph
D) changes over time; cross section graph
E) changes over time; cross time chart
8) Which type of graph is most useful in determining if two variables are correlated?
A) time-series
B) scatter diagram
C) cross-section
D) variable-correlation figure
E) None of the above answers is correct.
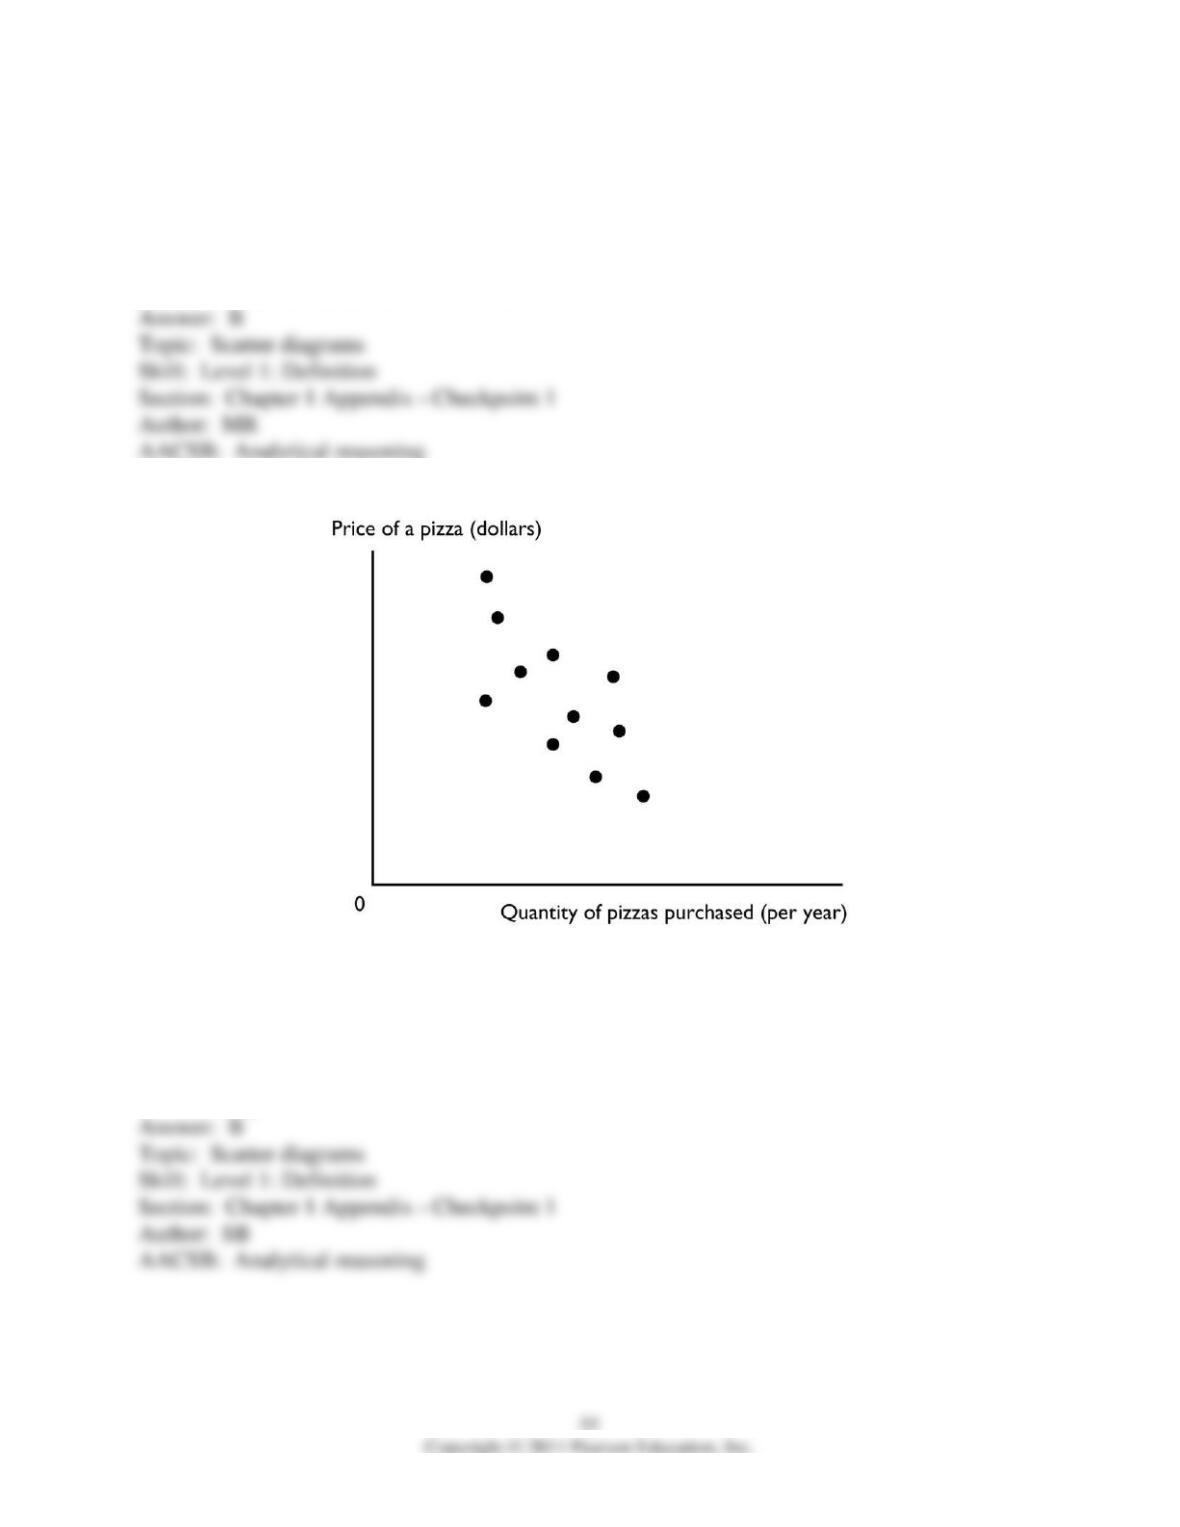
9) The figure above shows a
A) time-series graph.
B) scatter diagram.
C) cross-section graph.
D) slope.
E) trend diagram
10) A time-series graph measures
A) the value of one variable against the value of another variable.
B) the value of an economic variable for different groups in a population at a point in time.
C) time on the x-axis and the variable or variables in which we are interested on the y-axis.
D) time on the y-axis and the variable or variables in which we are interested on the x-axis.
E) time on both the x-axis and y-axis and the variable or variables in which we are interested in
the rest of the figure.
11) A time series graph
A) shows how a variable changes over time.
B) uses bars rather than lines.
C) shows points in a scatter diagram.
D) is similar to a cross-section graph because both can show trends over time.
E) is in the shape of a pie.
12) A steep slope in a time series graph means the variable is
A) high.
B) falling.
C) rising or falling quickly.
D) rising or falling slowly.
E) very close to its trend point.
13) Which type of economic graph reveals trends in data?
A) cross-section graph
B) time-series graph
C) scatter diagram
D) slopes
E) Answers A, B, and C are all correct.
14) A time series graph
A) shows how a certain variable changes over time.
B) uses bars rather than lines.
C) shows points that are scattered.
D) depicts a series of good economic times a nation had.
E) is not useful if the goal is to determine a variable's trend.
15) A time-series graph displays the price of gold. The slope of the line is negative for periods
when the
A) price of gold is falling.
B) price of gold is rising.
C) quantity of gold is falling.
D) price of gold is low and not changing.
E) price of gold fluctuates.
16) A graph shows the wages of factory workers. The slope of the line is positive for periods
when the wage is
A) falling.
B) rising.
C) high and not changing.
D) low and falling.
E) high and falling.
17) A trend is
A) a measure of closeness on a scatter diagram.
B) a general tendency for a variable to rise or fall.
C) the maximum value of a variable.
D) the minimum value of a variable.
E) the difference between the maximum value of a variable and the minimum value of the
variable.
18) A time series graph reveals whether there is a ________ , which represents ________.
A) trend in a variable; a general tendency for the variable to rise or fall
B) relationship between two variables; a cross-section relationship
C) trends in two variables; unrelated variables
D) relationship between two variables; a trend in a variable
E) cross-section relationship; a general tendency for the variables to rise or fall
19) Trend refers to
A) the scale used on the x- and y-axes.
B) increases but not decreases of a variable.
C) decreases but not increases of a variable.
D) a general tendency for a variable to rise or fall.
E) the difference between the maximum value of the variable and the minimum value of the
variable.
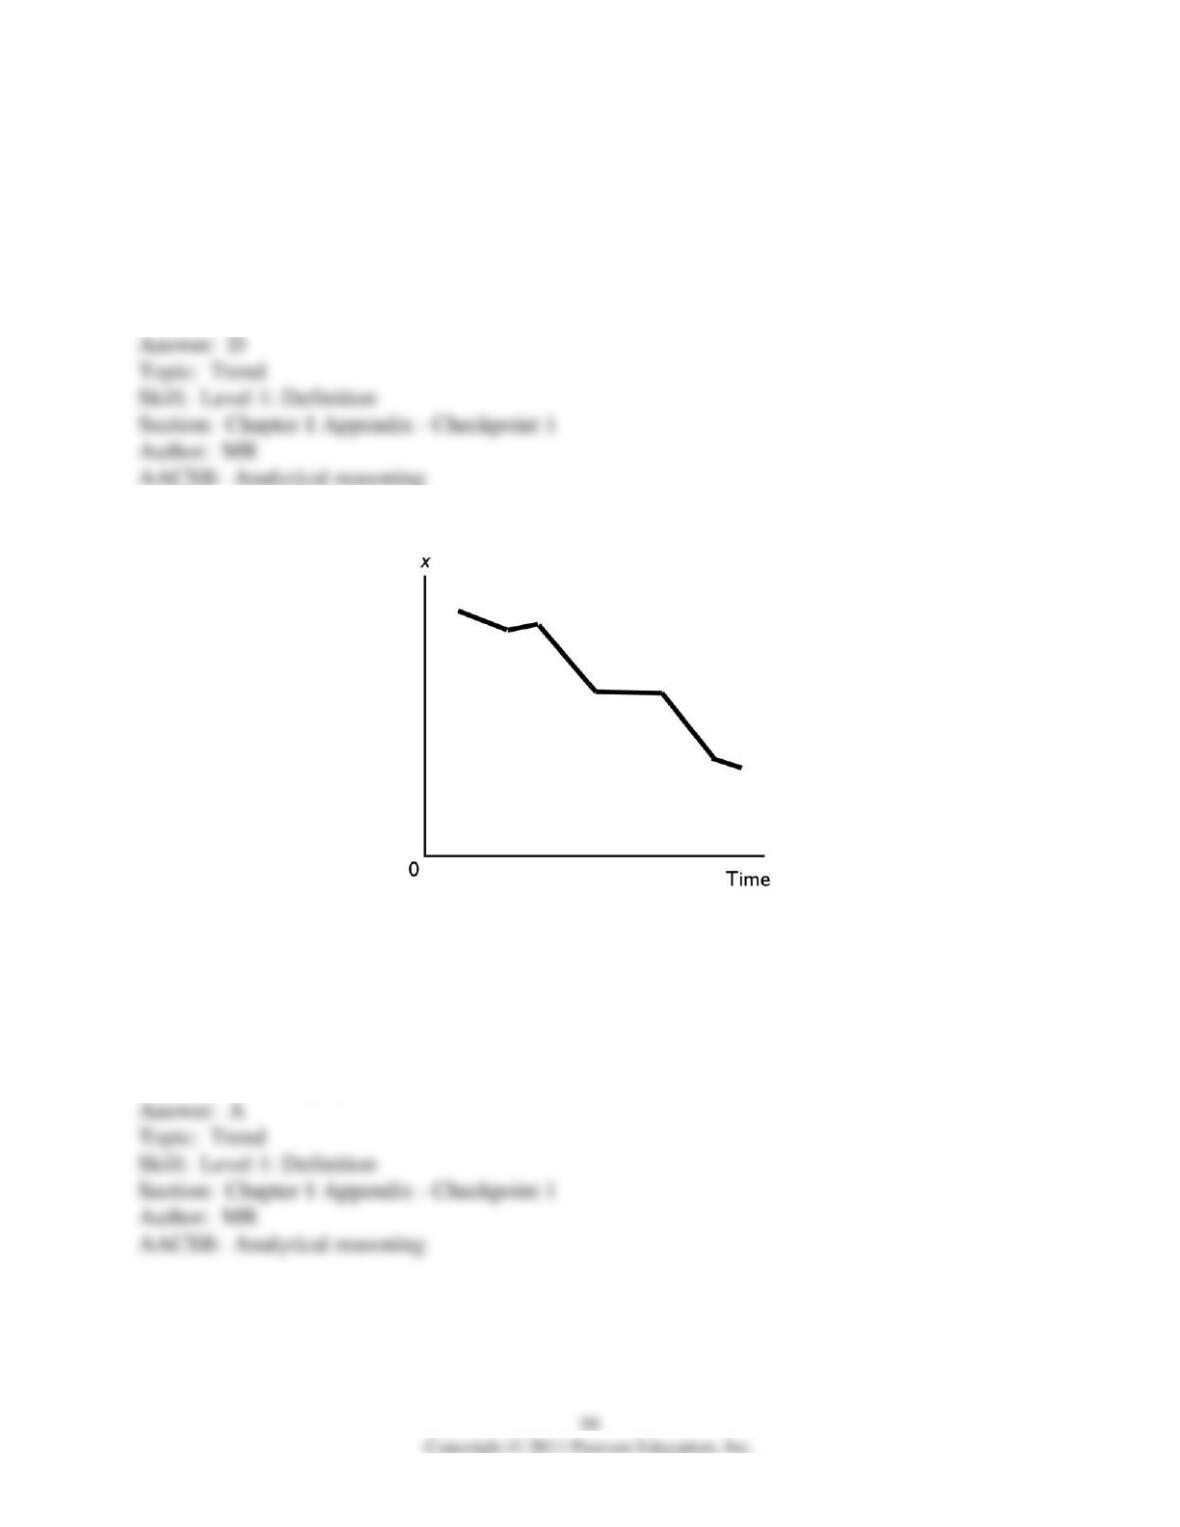
20) In the above figure, the diagram shows
A) a downward trend in x.
B) an upward trend in x.
C) a scatter diagram.
D) a two-variable scatter diagram.
E) a cross-section graph between x and time.
21) A cross-section graph
A) is divided into different sections.
B) shows the values of an economic variable for different groups in a population at a point in
time.
C) measures time on the x-axis and the variable in which we are interested on the y-axis.
D) Both answers A and C are correct.
E) Both answers A and B are correct.
22) A graph that shows the value of an economic variable for different groups in a population at
a given time is called a
A) scatter diagram.
B) times-series graph.
C) pie chart.
D) cross-section graph.
E) fixed-time diagram.
23) A graph shows the average wage of various demographic groups in 2005. The kind of graph
used to show these data would be a
A) scatter diagram.
B) time-series graph.
C) cross-section graph.
D) Venn-diagram.
E) fixed-year figure.


