59) Scooters are a normal good and buyers’ incomes decrease. Which of the figures above best
illustrates how this change affects the demand curve for scooters?
A) Figure A
B) Figure B
C) Figure C
D) Figure D
E) None of the above answers is correct because the decrease in income will affect the supply
curve not the demand curve.
60) Over the next few years more and more people prefer to ride on scooters. Which of the
figures above best illustrates how this change affects the demand curve for scooters?
A) Figure A
B) Figure B
C) Figure C
D) Figure D
E) None of the above answers is correct because the change in tastes will affect the supply curve
not the demand curve.
61) A scooter uses much less gasoline than does a car. Suppose the price of gasoline rises
substantially. Which of the figures above best illustrates how this change affects the demand
curve for scooters?
A) Figure A only
B) Figure B only
C) Figure C only
D) Figure D only
E) Both Figure A and Figure D
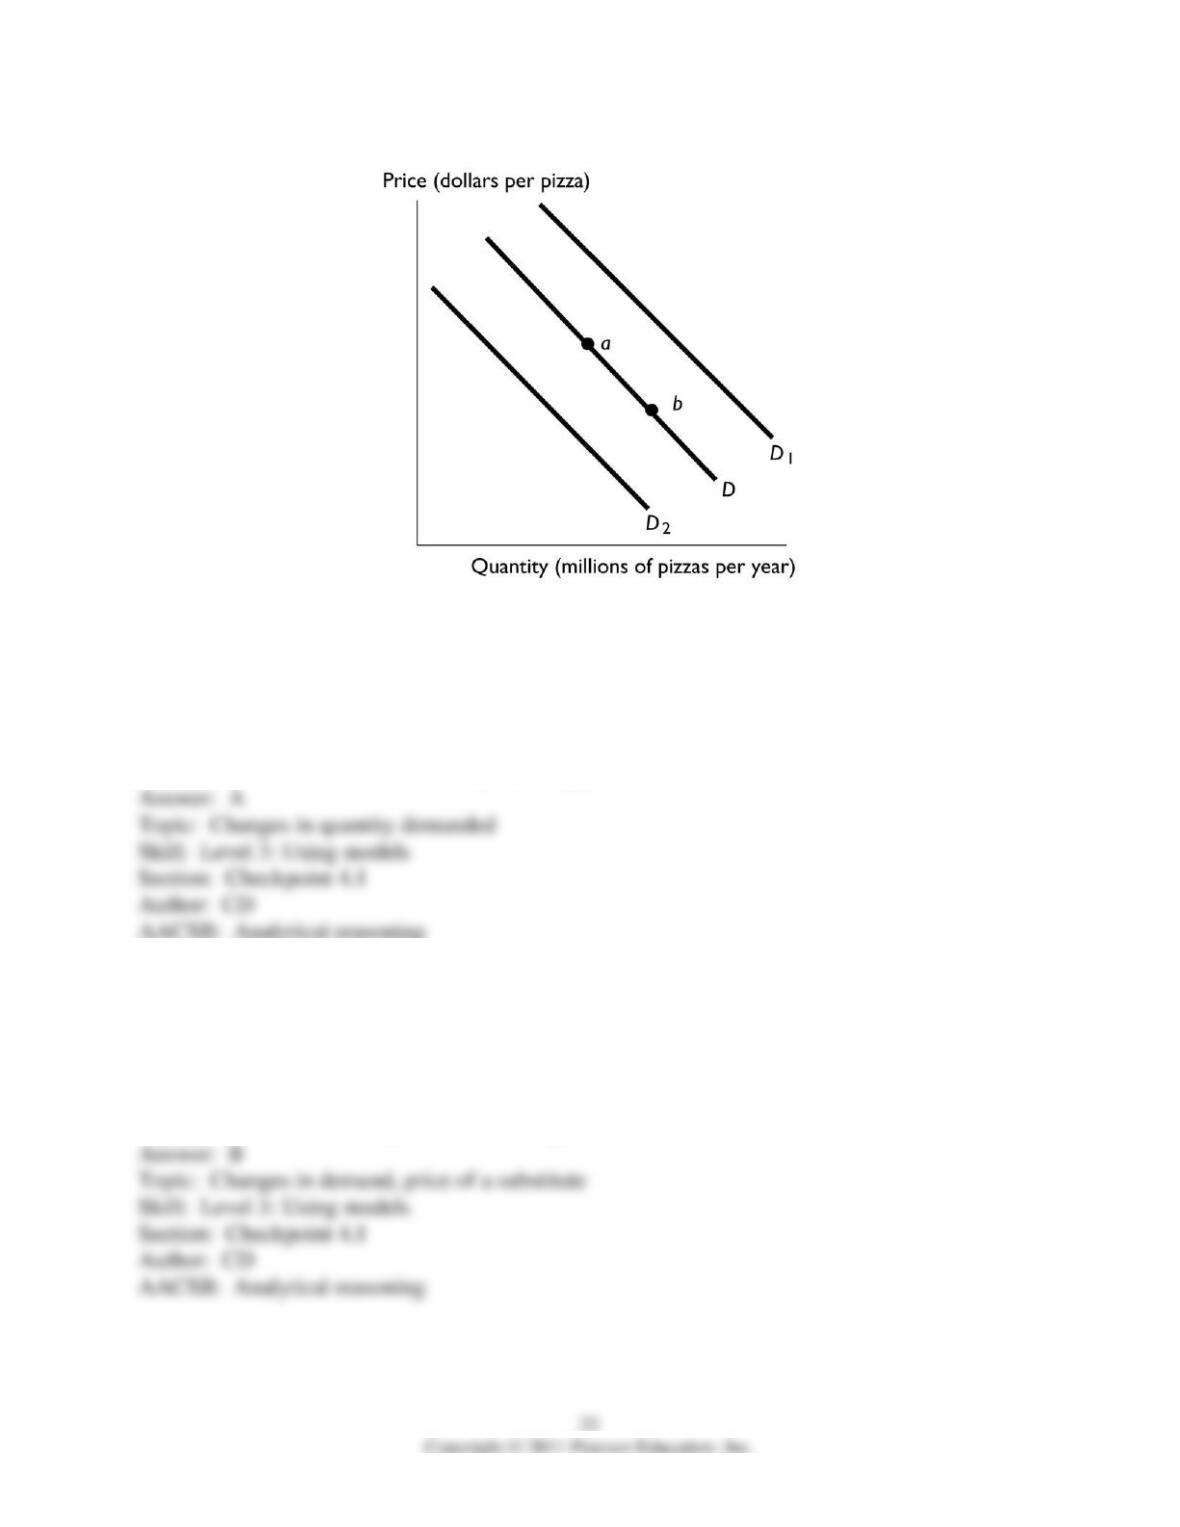
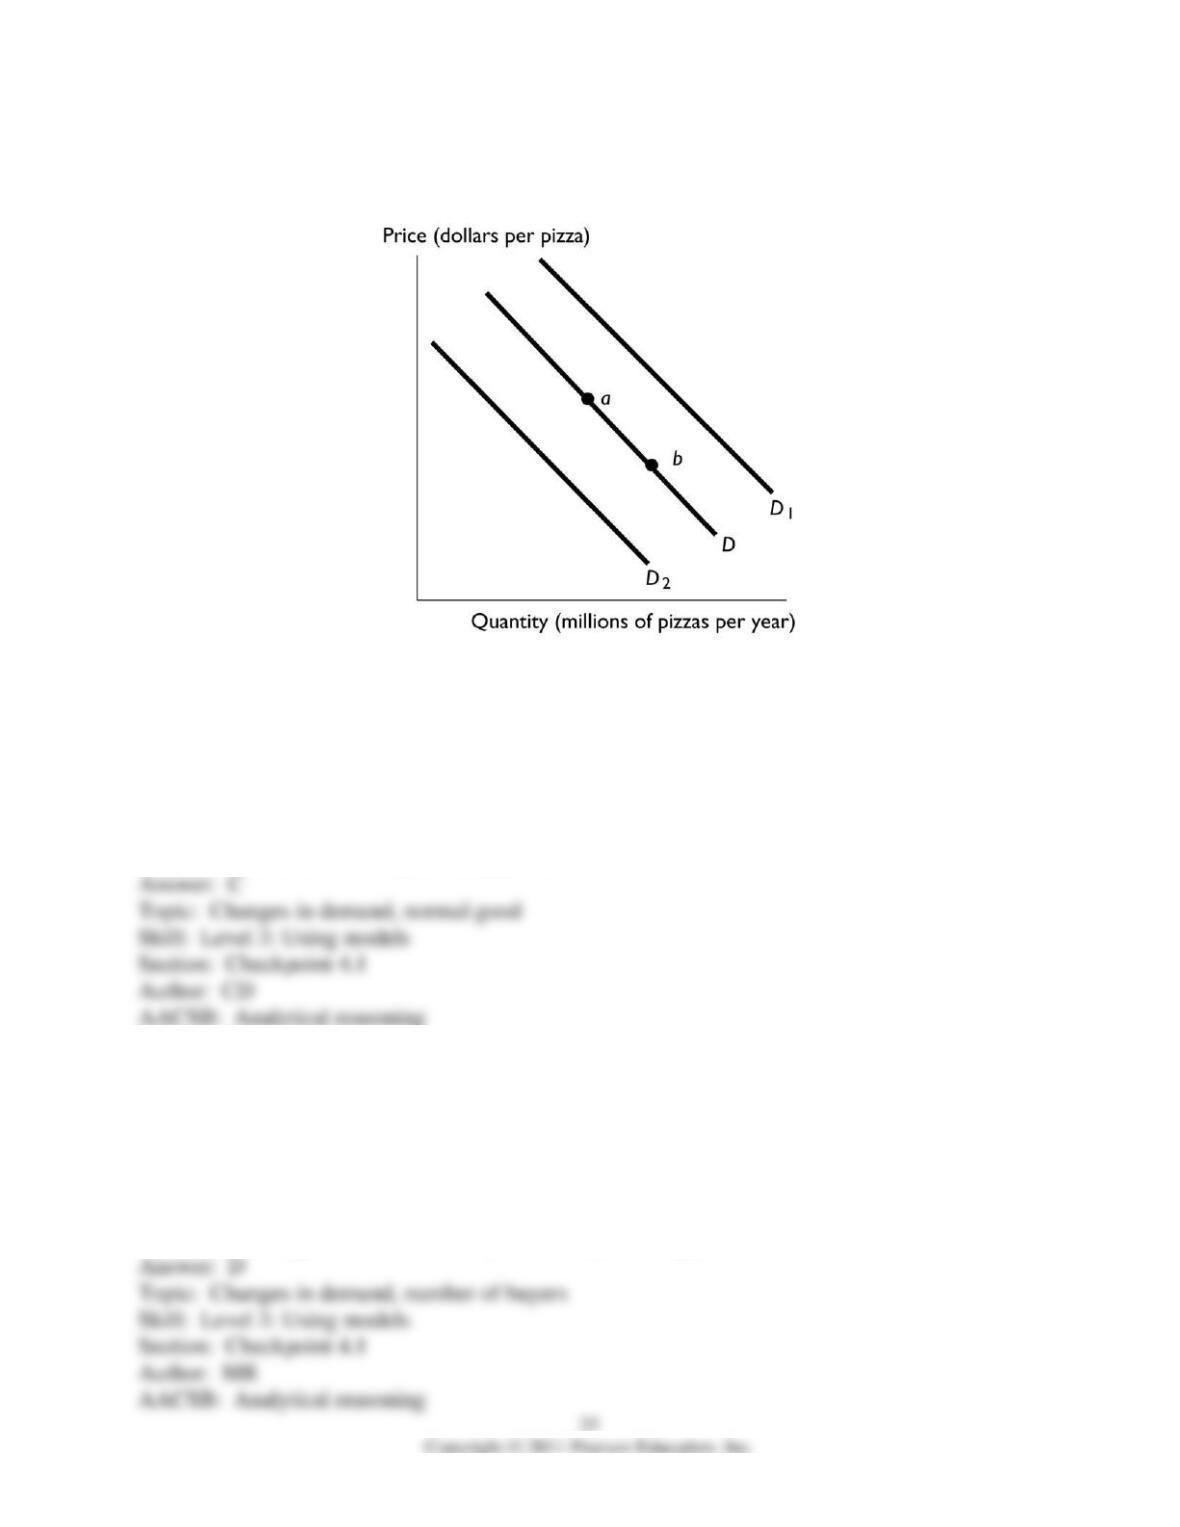
62) In the above figure, the movement from point a to point b reflects
A) a decrease in the price of pizza.
B) an increase in the demand for pizza.
C) an increase in the number of people who eat pizza.
D) an increase in the price of the tomato sauce used to produce pizza.
E) a decrease in the number of firms producing pizza.
63) In the above figure, the shift in the demand curve from D to D1 can be the result of
A) an increase in the price of pizza.
B) an increase in the price of a sub sandwich, a substitute for pizza.
C) an increase in the price of soda, a complement to pizza.
D) a change in quantity demanded.
E) a decrease in income if pizza is a normal good.
64) In the above figure, the shift in the demand curve from D to D2 can be the result of
A) an increase in income if pizza is a normal good.
B) an increase in the price of a sub sandwich, a substitute for pizza.
C) an increase in the price of soda, a complement to pizza.
D) a change in quantity demanded.
E) a decrease in the supply of pizza that raises the price of pizza.
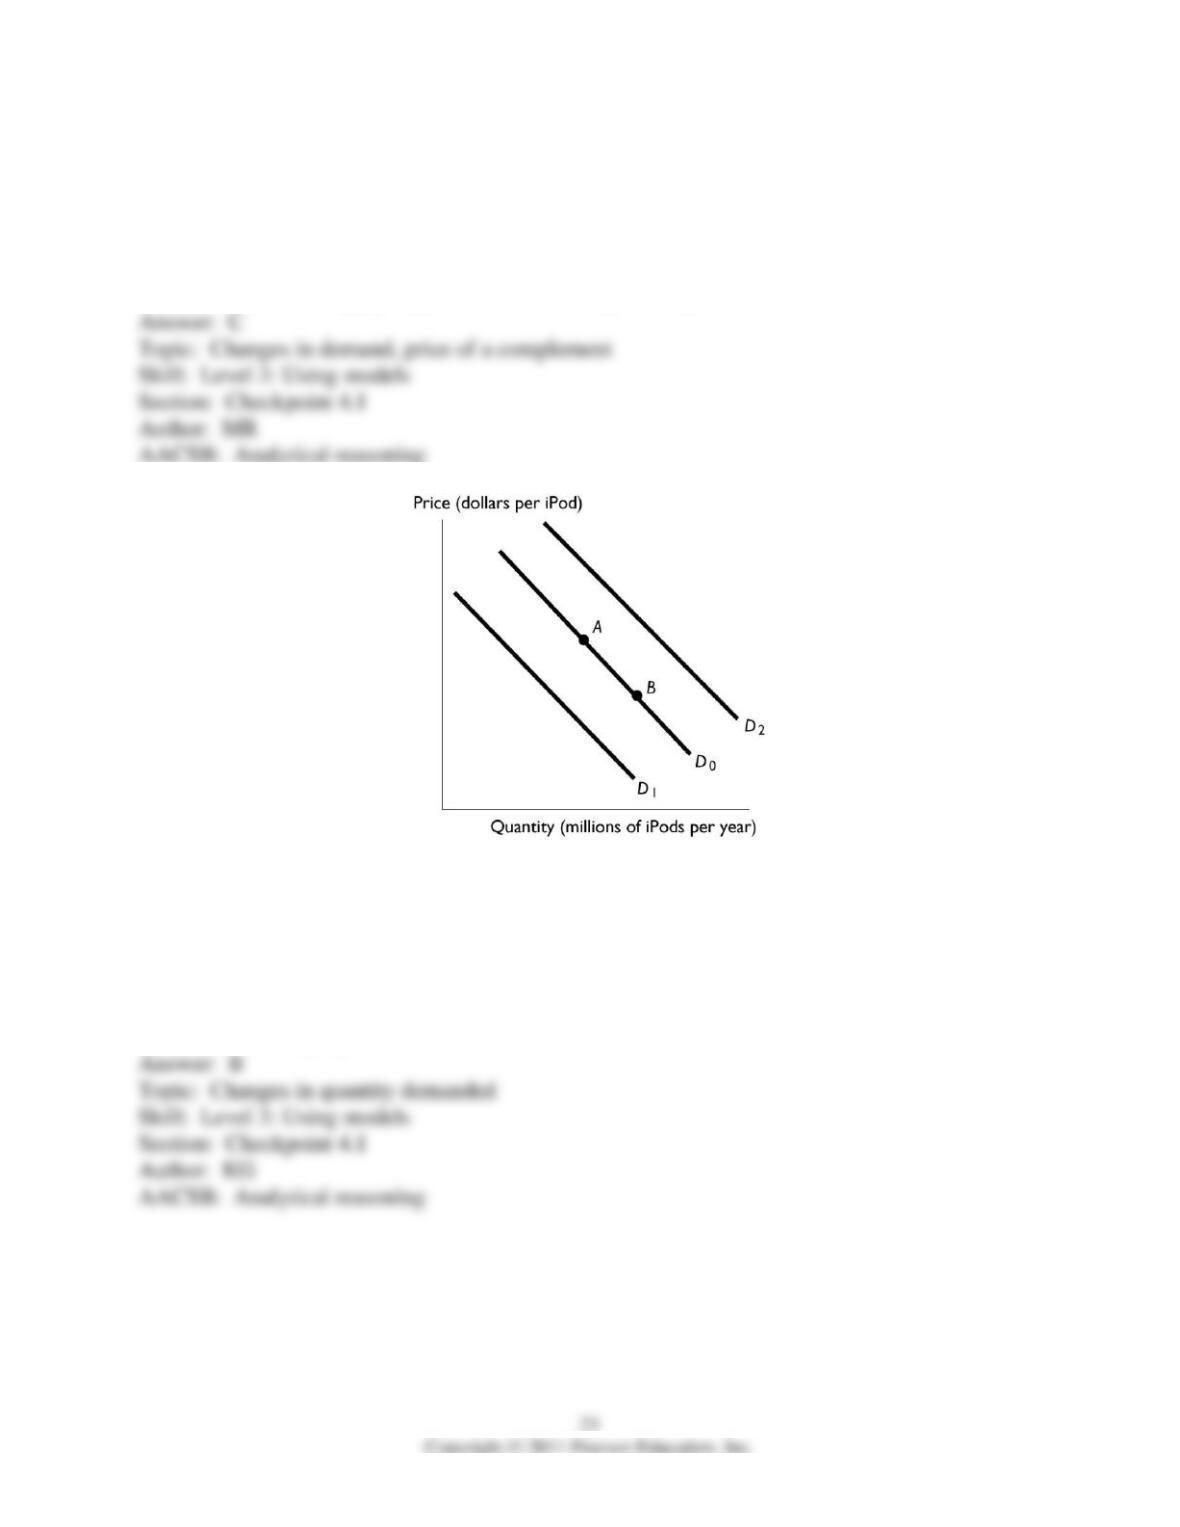
65) The figure above shows the market for iPods. Which of the following creates a movement
from point A to point B?
A) A requirement that all students at universities have an iPod.
B) A decrease in the price of iPods.
C) A decrease in the price of Zunes, a substitute for iPods.
D) An increase in the price of iPods.
E) An increase in people’s incomes.
66) The figure above shows the market for iPods. Which of the following shifts the demand
curve from D0 to D1?
A) A decrease in the price of Zunes, a substitute for iPods.
B) An increase in the price of iPods.
C) A requirement that all students at universities have an iPod.
D) A decrease in the price of iPods.
E) An increase in people’s incomes.
67) The figure above shows the market for iPods. Which of the following shifts the demand
curve from D0 to D2?
A) A decrease in the price of Zunes, a substitute for iPods.
B) An increase in the price of iPods.
C) A requirement that all students at universities have an iPod.
D) A decrease in the price of iPods.
E) A decrease in people’s incomes if iPods are a normal good.
68) Pizza is a normal good. In the above figure, the shift in the demand curve from D to D2 can
be the result of
A) a decrease in the price of soda, a complement to pizza.
B) an increase in the price of hamburgers, a substitute for pizza.
C) a decrease in income.
D) a study that shows that pizza is a very healthy food.
E) an increase in the cost of producing pizza.
69) In the above figure, the shift in the demand curve from D to D1 can be the result of
A) a decrease in income if pizza is a normal good.
B) a decrease in the price of a sub sandwich, a substitute for pizza.
C) an increase in the price of soda, a complement to pizza.
D) an increase in the number of teenagers, all of whom demand more pizza than do other age
groups.
E) new technology that increases the profit from producing pizza.
70) In the above figure, ________ will shift in the demand curve from D to D1.
A) an increase in income if pizza is an inferior good
B) a decrease in the price of a sub sandwich, a substitute for pizza
C) buyers’ expectation that pizza will be less expensive next week
D) a scientific article published that demonstrates eating pizza is good for one’s health
E) a fall in the cost of producing pizza
71) Which of the following brings only an increase in the quantity demanded of a good?
A) a decrease in income, assuming the good is an inferior good
B) a rise in the price of a substitute good
C) a fall in the price of the good itself
D) an expectation that the good’s price will rise in the future
E) a decrease in income, assuming the good is a normal good
72) People consume more soup as temperatures falls. So, as cold weather approaches,
A) the quantity of soup demanded increases.
B) the demand for soup increases.
C) people move closer to their demand curve for soup.
D) people move farther beyond their demand curves.
E) both the demand and the quantity demanded of soup increase.
73) The impact of an increase in the price of a particular good is illustrated as a
A) leftward shift in its demand curve.
B) rightward shift in its demand curve.
C) movement upward and to the left along its demand curve.
D) movement downward and to the right along its demand curve.
E) rightward shift in its demand curve and a movement upward and to the left along its demand
curve.
74) Which of the following events will increase the quantity demanded of bottled water?
A) a fall in the price of soda
B) a rise in the price of a fitness club membership
C) an increase in the number of buyers of bottled water
D) a fall in the price of bottled water
E) a rise in the price of bottled water
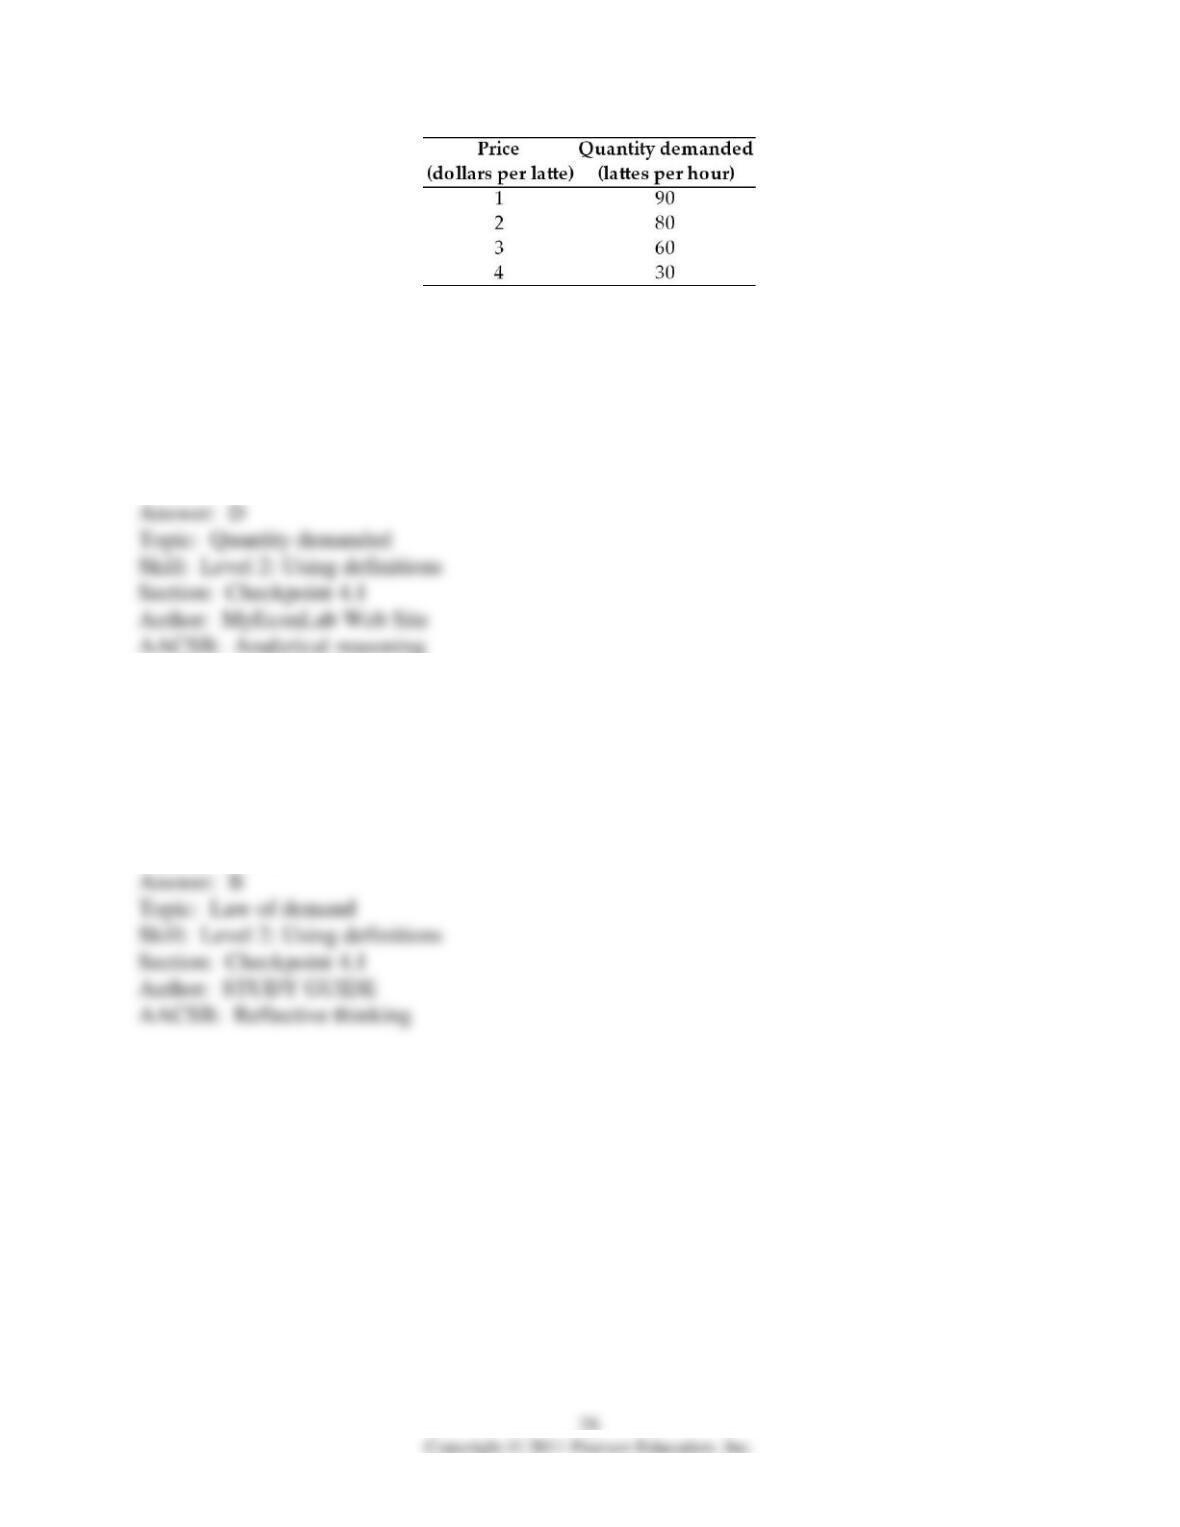
75) The table above gives the demand schedule for lattes at the Bottomless Cup. If the price of a
latte is $3, then the quantity of lattes demanded is ________ an hour.
A) 90
B) 30
C) 80
D) 60
E) 230
76) Other things remaining the same, the quantity of a good or service demanded will increase if
the price of the good or service
A) rises.
B) falls.
C) does not change.
D) rises or does not change.
E) rises or falls.
77) The “law of demand” indicates that if the University of Maine increases tuition, all other
things remaining the same
A) the demand for classes will decrease at the University of Maine.
B) the demand for classes will increase at the University of Maine.
C) the quantity of classes demanded will increase at the University of Maine.
D) the quantity of classes demanded will decrease at the University of Maine.
E) both the demand for and the quantity of classes demanded will decrease at the University of
Maine.
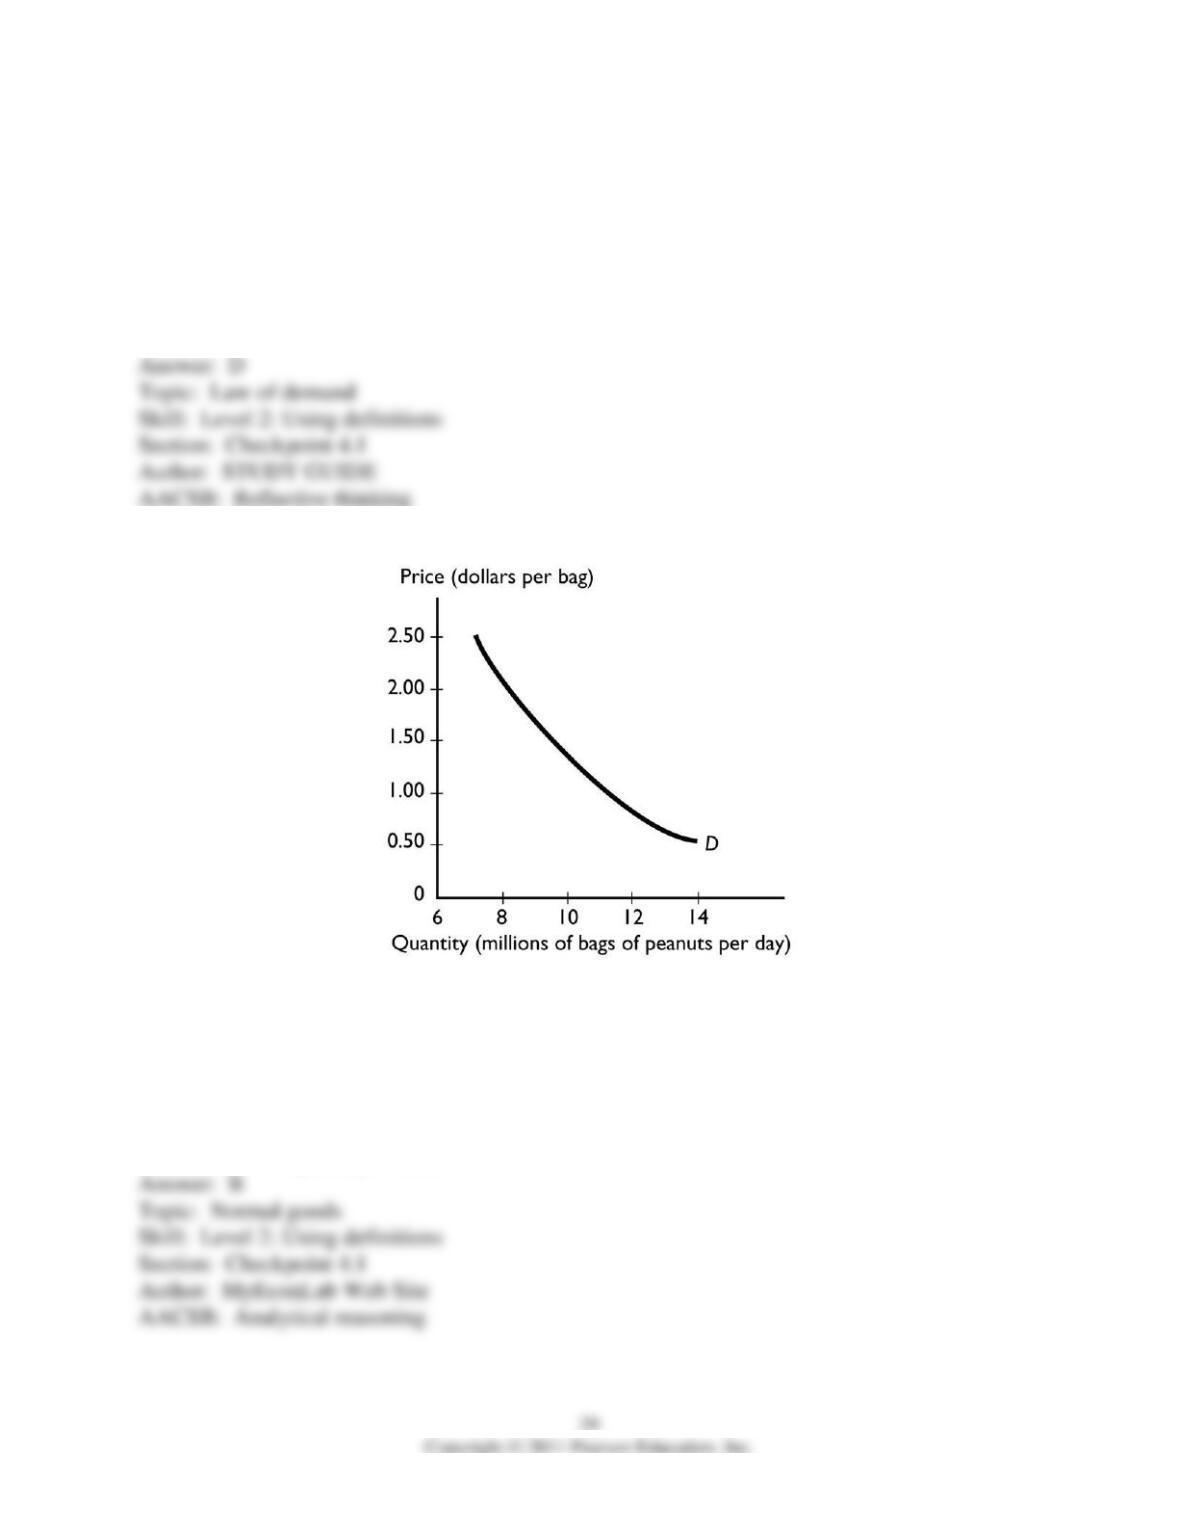
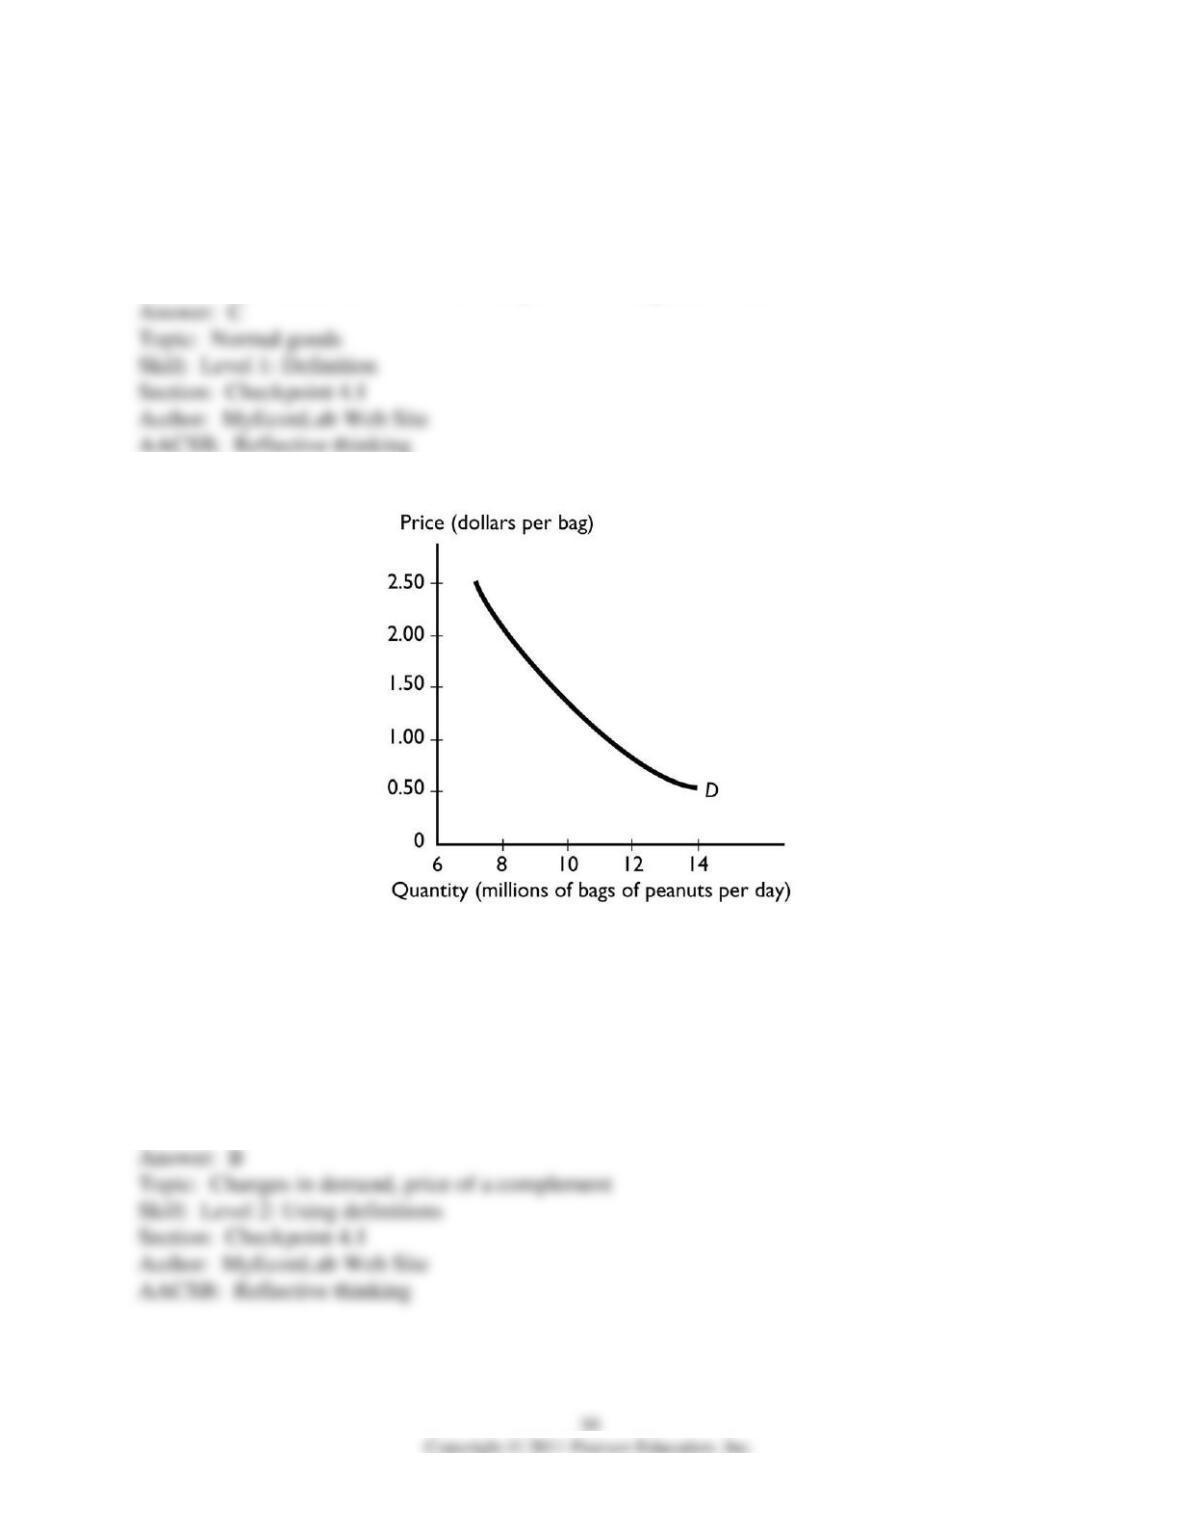
78) The graph illustrates the demand for peanuts. Peanuts are a normal good because the
A) demand curve for peanuts slopes downward.
B) demand for peanuts increases when income increases.
C) demand for peanuts increases when the price of one of its substitutes rises.
D) peanuts have both substitutes and complements.
E) demand curve shows that if the price of peanuts rises, there is a movement along the demand
curve to a lower quantity demanded.
79) A normal good is defined as a good
A) with a downward sloping demand curve.
B) for which demand increases when the price of a substitute rises.
C) for which demand increases when income increases.
D) for which demand increases when the number of demanders increases.
E) for which demand increases when the price of a complement falls.
80) Soda and peanuts are complements. Other influences on buying plans remaining the same, a
rise in the price of soda
A) increases the demand for peanuts.
B) decreases the demand for peanuts.
C) decreases the demand for soda.
D) increases the demand for soda.
E) has no effect on the demand for peanuts, though it does change the quantity demanded of
peanuts.
81) People come to expect that the price of a gallon of gasoline will rise next week. As a result,
A) today’s supply of gasoline increases.
B) today’s demand for gasoline increases.
C) the price of a gallon of gasoline falls today.
D) next week’s supply of gasoline decreases.
E) today’s demand for gasoline and today’s supply of gasoline do not change.
82) One reason the demand for laptop computers might increase is a
A) fall in the price of a laptop computers.
B) fall in price of desktop computers.
C) a change in preferences as laptops have become more portable, with faster processors and
larger hard drives.
D) poor quality performance record for laptop computers.
E) a decrease in income if laptops are a normal good.
83) Teenagers drink more soda than other age groups. If the number of teenagers increases,
everything else remaining the same,
A) market demand for soda increases.
B) market demand for soda decreases.
C) market demand for soda does not change.
D) there is a movement along the market demand curve for soda.
E) None of the above answers is correct because the effect on the demand depends whether the
supply curve shifts rightward, leftward, or not at all.
84) The number of buyers of sport utility vehicles, SUV, decreases sharply. So the
A) demand curve for SUVs shifts leftward.
B) demand curve for SUVs shifts rightward.
C) demand curve for SUVs does not shift nor is there a movement along then demand curve.
D) demand curve for SUVs does not shift but there is a movement downward along it.
E) the supply curve for SUVs shifts rightward.
85) When moving along a demand curve, which of the following changes?
A) the consumers’ incomes
B) the prices of other goods
C) the number of buyers
D) the price of the good
E) the consumers’ preferences
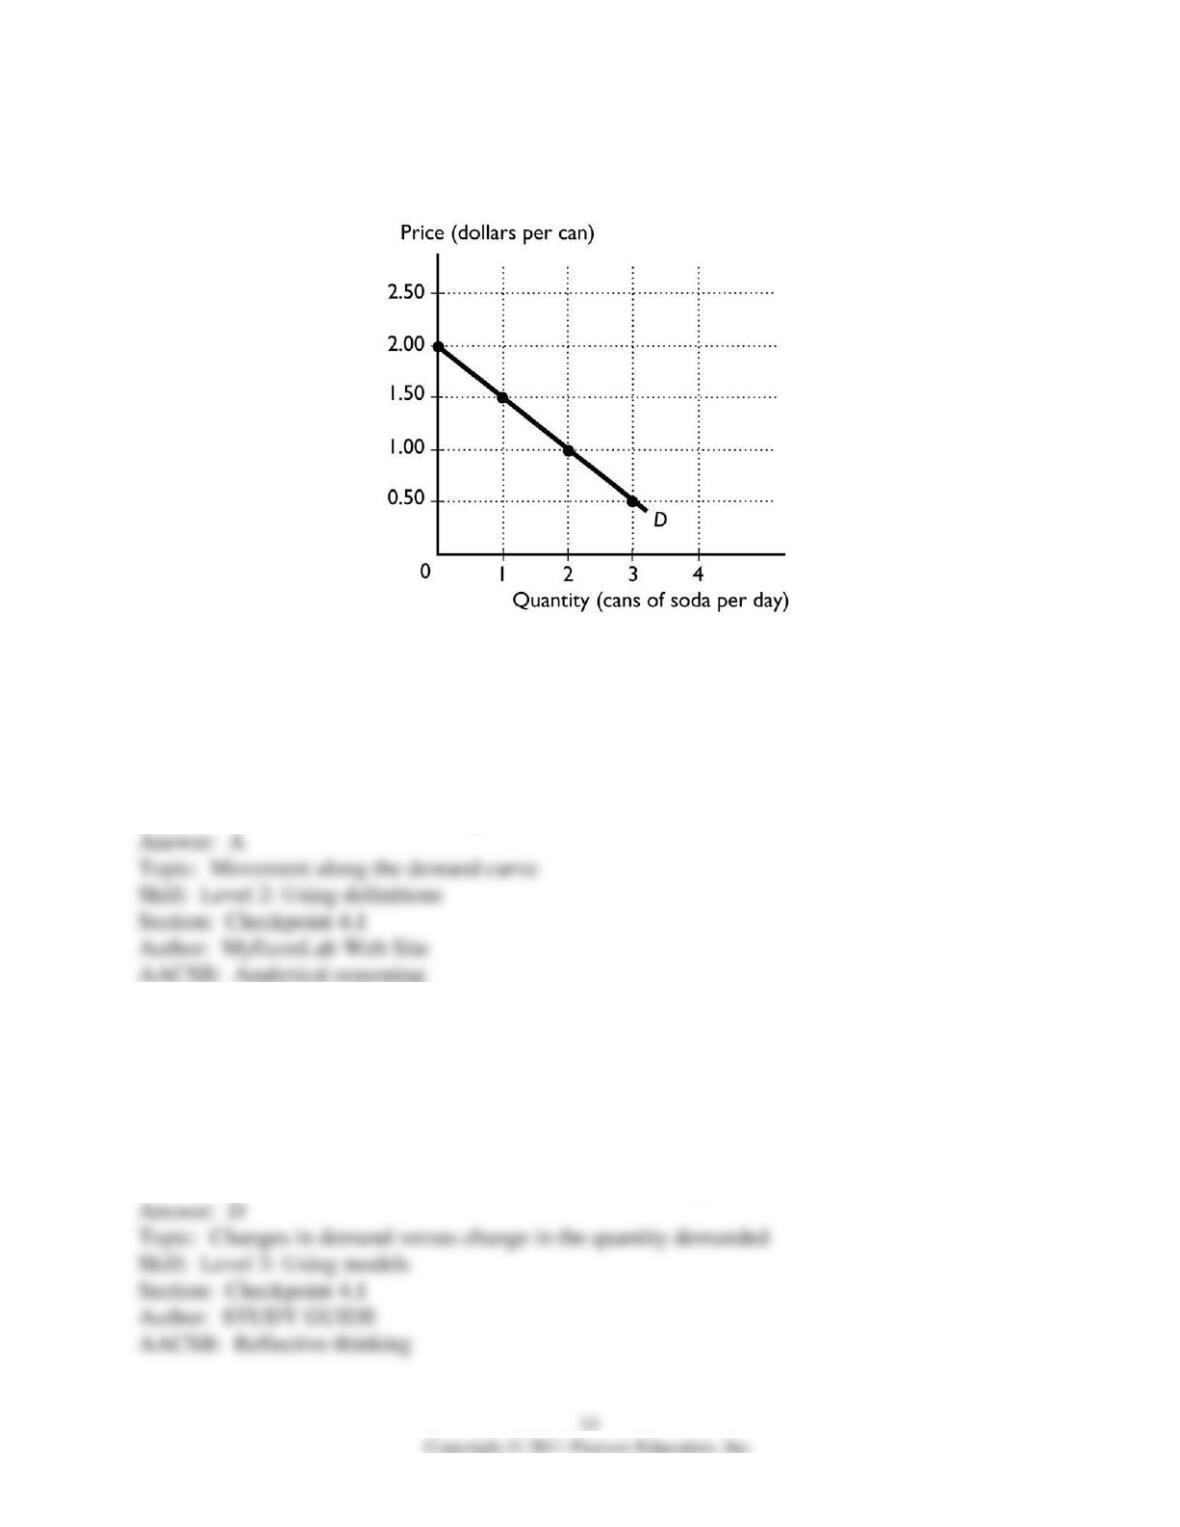
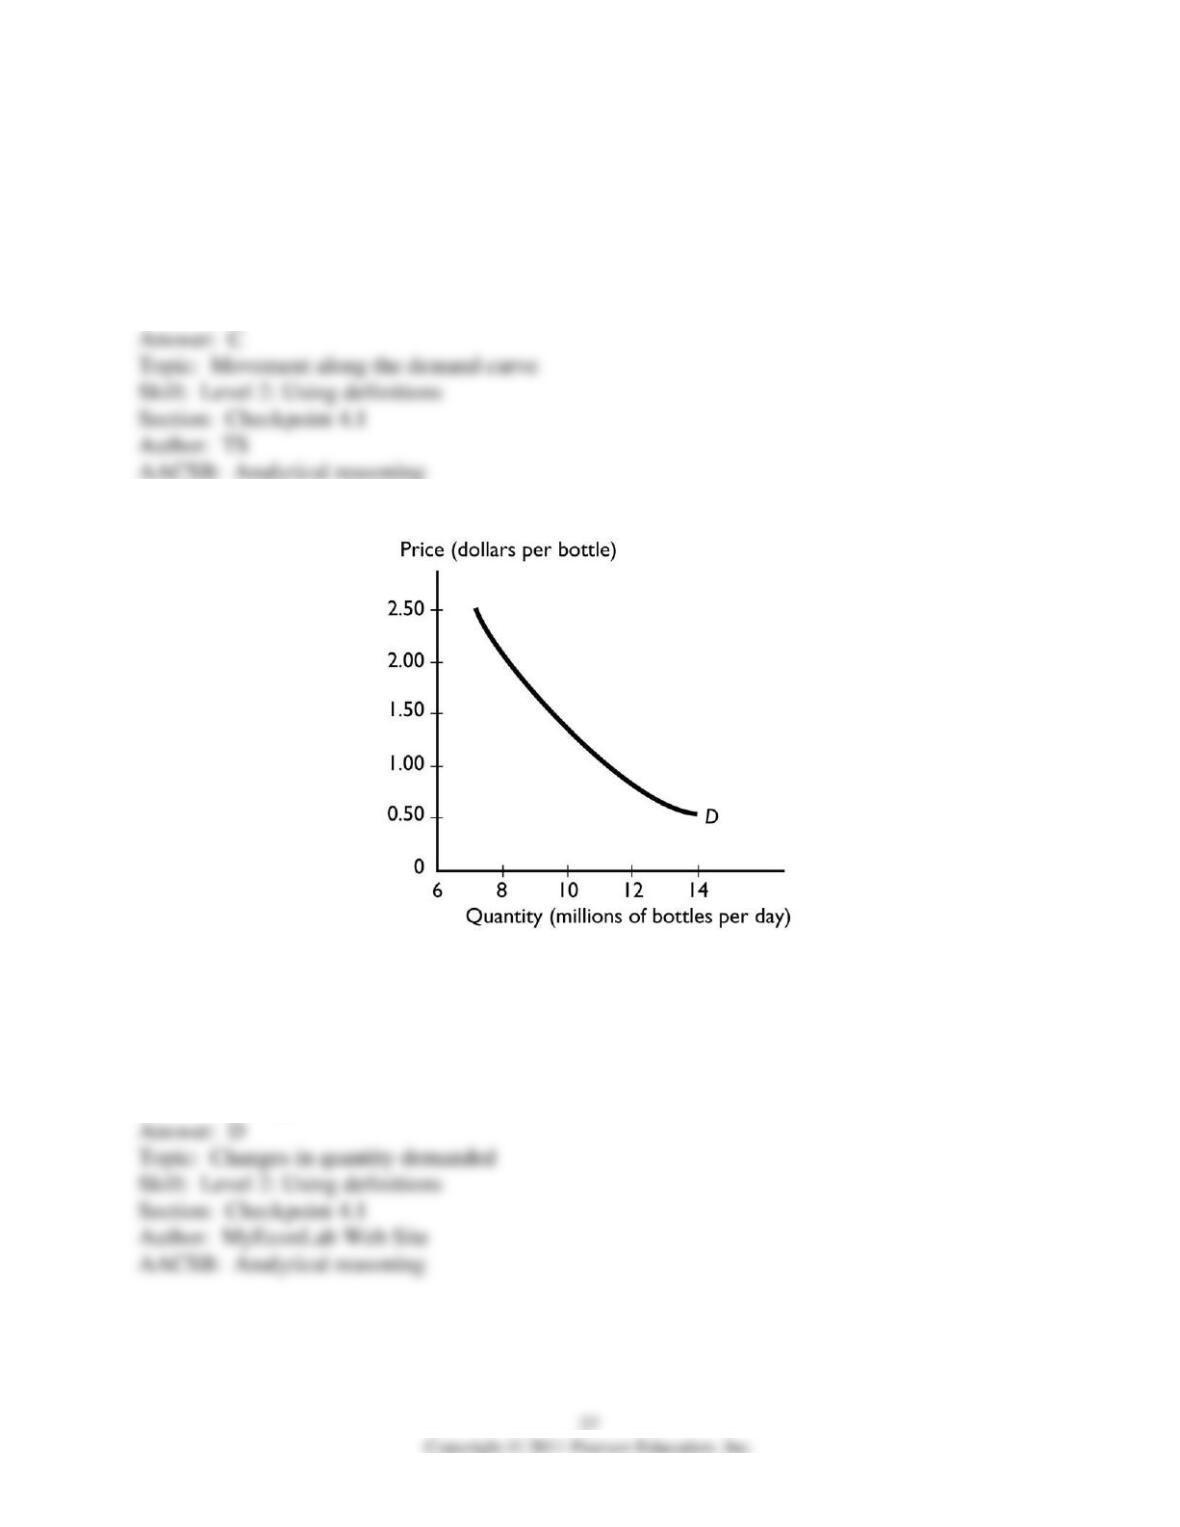
86) The graph illustrates the demand curve for soda. After a rise in the price of a soda from $1.00
a can to $2.00 a can, the quantity of soda demanded
A) decreases from 2 cans to 0 cans a day.
B) increases from 0 cans to 2 cans a day.
C) remains unchanged.
D) decreases from 1 can to 0 cans a day.
E) cannot be determined from the figure because the demand curve will shift to a new curve.
87) Pizza and tacos are substitutes, and the price of a pizza increases. Which of the following
correctly indicates what happens?
A) The demand for pizzas decreases and the demand for tacos increases.
B) The demand for both goods decreases.
C) The quantity of tacos demanded increases and the quantity of pizza demanded decreases.
D) The quantity of pizza demanded decreases and the demand for tacos increases.
E) The demand for each decreases because both are normal goods.
88) If the price of a DVD falls,
i. the demand curve for DVDs will shift rightward.
ii. the demand curve for DVDs will not shift.
iii. there will be a movement along the demand curve for DVDs.
A) i only
B) ii only
C) iii only
D) ii and iii
E) i and iii
4.2 Supply
1) To be part of the supply for a good, a producer must be
A) only able to supply the good.
B) only willing to supply the good.
C) both able and willing to supply the good.
D) both able and willing to supply the good, and have already identified a buyer.
E) both able and willing to supply the good, and have already sold the good.
2) The law of supply states that, other things remaining the same,
A) demand increases when supply increases.
B) if the price of a good increases, firms buy less of it.
C) if the price of a good increases, the quantity supplied increases.
D) as people’s income increase, the supply of goods increases.
E) if the price of a good increases, the supply increases.
3) The law of supply states that other things remaining the same, a decrease in the price of a
kayak leads to
A) a decrease in the supply of kayaks.
B) a decrease in the quantity of kayaks supplied.
C) an increase in the supply of kayaks.
D) an increase in the quantity of kayaks supplied.
E) an increase in the supply of kayaks and a decrease in the quantity of kayaks supplied.
4) Which of the following helps explain why the law of supply exists?
A) Larger outputs result in lower costs of production.
B) The law of increasing opportunity cost.
C) The costs of production remain constant throughout all levels of output.
D) Sellers realize that if the price increases, they make larger profits and do not need to change
their production.
E) The law of demand.
5) The law of supply reflects the fact that
A) people buy more of a good when its price falls.
B) suppliers have an incentive to use their resources in the way that brings the biggest return.
C) higher prices are more attractive to consumers because they signal a higher quality product.
D) businesses can sell more goods at lower prices.
E) the demand curve is downward sloping.
6) The quantity supplied of a good or service is the
A) list of all quantities at different prices, as illustrated by a supply schedule and a supply curve.
B) list of all quantities at different prices, as illustrated by a demand schedule and a demand
curve.
C) one quantity produced at a variety of prices.
D) quantity produced at one price.
7) The supply schedule
A) shows the relationship between the quantity supplied and the price of a good when all other
influences on selling plans remain the same.
B) is a curve showing the relationship between the amount the sellers are willing and able to sell
and the price of that good when all relevant factors change.
C) shows one quantity at one price.
D) is the schedule that suppliers have to keep or else they will be late.
E) shows the relationship between the quantity supplied and the price of a good when all other
influences on selling plans change.
8) A supply curve
A) slopes downward.
B) slopes upward.
C) is a graph of the relationship between quantity supplied of a good and its price.
D) Both answers B and C are correct.
E) Both answers A and C are correct.
9) Which of the following increases the quantity supplied of compact discs but does NOT
increase the supply of compact discs?
A) a decrease in the price of a compact disc
B) an increase in the price of a compact disc
C) a decrease in the number of suppliers of compact discs
D) an increase in the price of the resources used to produce compact discs
E) new technology that lowers the cost of producing compact discs
10) Which of the following increases the supply of a product?
A) lower prices for the resources used to produce the product
B) some producers going bankrupt and leaving the industry
C) a higher price for the product
D) an increase in the expected future price of the product
E) a decrease in productivity.
11) Which of the following does NOT increase the supply of personal computers, that is, does
NOT shift the supply curve of personal computers?
A) an advance in the technology used to produce personal computers
B) an increase in the number of firms producing personal computer
C) a fall in the cost of the components used to assemble personal computers
D) a rise the price of a personal computer
E) a change in the expected future price of a personal computer.
12) Which of the following shifts the supply curve of rutabagas rightward? (A rutabaga is a
potato-like vegetable.)
A) an increase in the price of a rutabaga
B) an exceptionally cold summer that killed much of the rutabaga crop
C) a fall in the price of fertilizer used to grow rutabagas
D) Both answers A and C shift the supply curve of rutabagas rightward.
E) Both answers A and B shift the supply curve of rutabagas rightward.
13) Mulch is shredded wood and is a by-product in the production of lumber. Because these two
goods are produced together, they are
A) complements in production.
B) substitutes in production.
C) inputs into the same production process.
D) not related.
E) normal goods in production.
14) A decrease in the price of a complement in production leads to
A) a decrease in the supply of the good in question.
B) an increase in the supply of the good in question.
C) no change in the supply of the good in question.
D) a decrease in the quantity supplied of the good in question.
E) an increase in the supply of the good in question and a decrease in the quantity supplied of the
good in question.
15) Milk can be used to produce cheese or butter. If the price of a pound of butter rises, what
happens to the supply of cheese?
A) The supply of cheese increases.
B) The supply of cheese decreases.
C) The supply of cheese stays the same and there is no change in the quantity supplied of cheese.
D) The supply of cheese stays the same and there is a decrease in the quantity supplied of cheese.
E) The supply of cheese could increase, decrease, or stay the same depending on what happens to
the supply of butter.
16) Oil refiners can refine a barrel of petroleum so that it yields either more home heating oil or
more diesel fuel. If the price of diesel fuel falls, there is
A) an increase in the supply of home heating oil.
B) a decrease in the supply of home heating oil.
C) an increase in the quantity of home heating oil supplied.
D) a decrease in the quantity of home heating oil supplied.
E) an increase in the demand for home heating oil.
17) Which of the following increases the supply of gasoline?
A) a situation where the quantity of gasoline demanded exceeds the quantity supplied
B) an increase in the price of gasoline
C) a decrease in the price of a resource used to produce gasoline, such as crude oil
D) a decrease in the demand for gas-guzzling, sport utility vehicles
E) an increase in income if gas-guzzling, sport utility vehicles are a normal good
18) The United Auto Workers bargained for higher wages and more benefits for autoworkers. As
a result of the higher wages and increased benefits,
i. the quantity of new automobiles supplied decreases.
ii. the supply of new automobiles decreases.
iii. the supply of new automobiles increases.
A) only i
B) only ii
C) only iii
D) both i and ii
E) Neither i, ii, nor iii is correct.
19) If the automobile worker’s union successfully negotiates a wage increase for its members,
how does the wage hike affect the supply of automobiles?
A) The supply increases.
B) The supply decreases.
C) The quantity supplied increases.
D) The quantity supplied decreases.
E) Both answers B and D are correct.
20) Plywood is used in the construction of houses. If the price of plywood rises, what happens to
the supply of houses?
A) The supply increases so that the supply curve shifts rightward.
B) The supply decreases so that the supply curve shifts leftward.
C) The quantity supplied increases but there is no shift in the supply curve.
D) The quantity supplied decreases but there is no shift in the supply curve.
E) The quantity supplied decreases and the supply curve shifts leftward.