39) Cost
A) is what the buyer pays to get the good.
B) is always equal to the marginal benefit for every unit of a good produced.
C) is what the seller must give up to produce the good.
D) is greater than market price, which results in a profit for firms.
E) means the same thing as price.
40) If a firm is willing to supply the 1,000th unit of a good at a price of $23 or more, we know
that $23 is the
A) highest price the seller hopes to realize for this output.
B) minimum price the seller must receive to produce this unit.
C) average price of all the prices the seller could charge.
D) price that sets the marginal benefit equal to the price.
E) only price for which the seller is willing to sell this unit of the good.
41) A supply curve shows the ________ of producing one more unit of a good or service.
A) producer surplus
B) consumer surplus
C) total benefit
D) marginal cost
E) marginal benefit to the producer
42) The producer surplus on a unit of a good is
A) equal to the marginal benefit from the good minus its price.
B) equal to the price of the good minus the marginal cost of producing it.
C) always equal to consumer surplus.
D) Both answers A and C are correct.
E) Both answers B and C are correct.
43) Suppose you’re willing to tutor a student for $10 an hour. The student pays you $15 an hour.
What is your producer surplus?
A) $5 an hour
B) $10 an hour
C) $15 an hour
D) $25 an hour
E) More than $25 an hour.
44) In a figure that shows a supply curve and a demand curve, producer surplus is the area
A) below the demand curve and above the market price.
B) below the supply curve and above the market price.
C) above the demand curve and below the market price.
D) above the supply curve and below the market price.
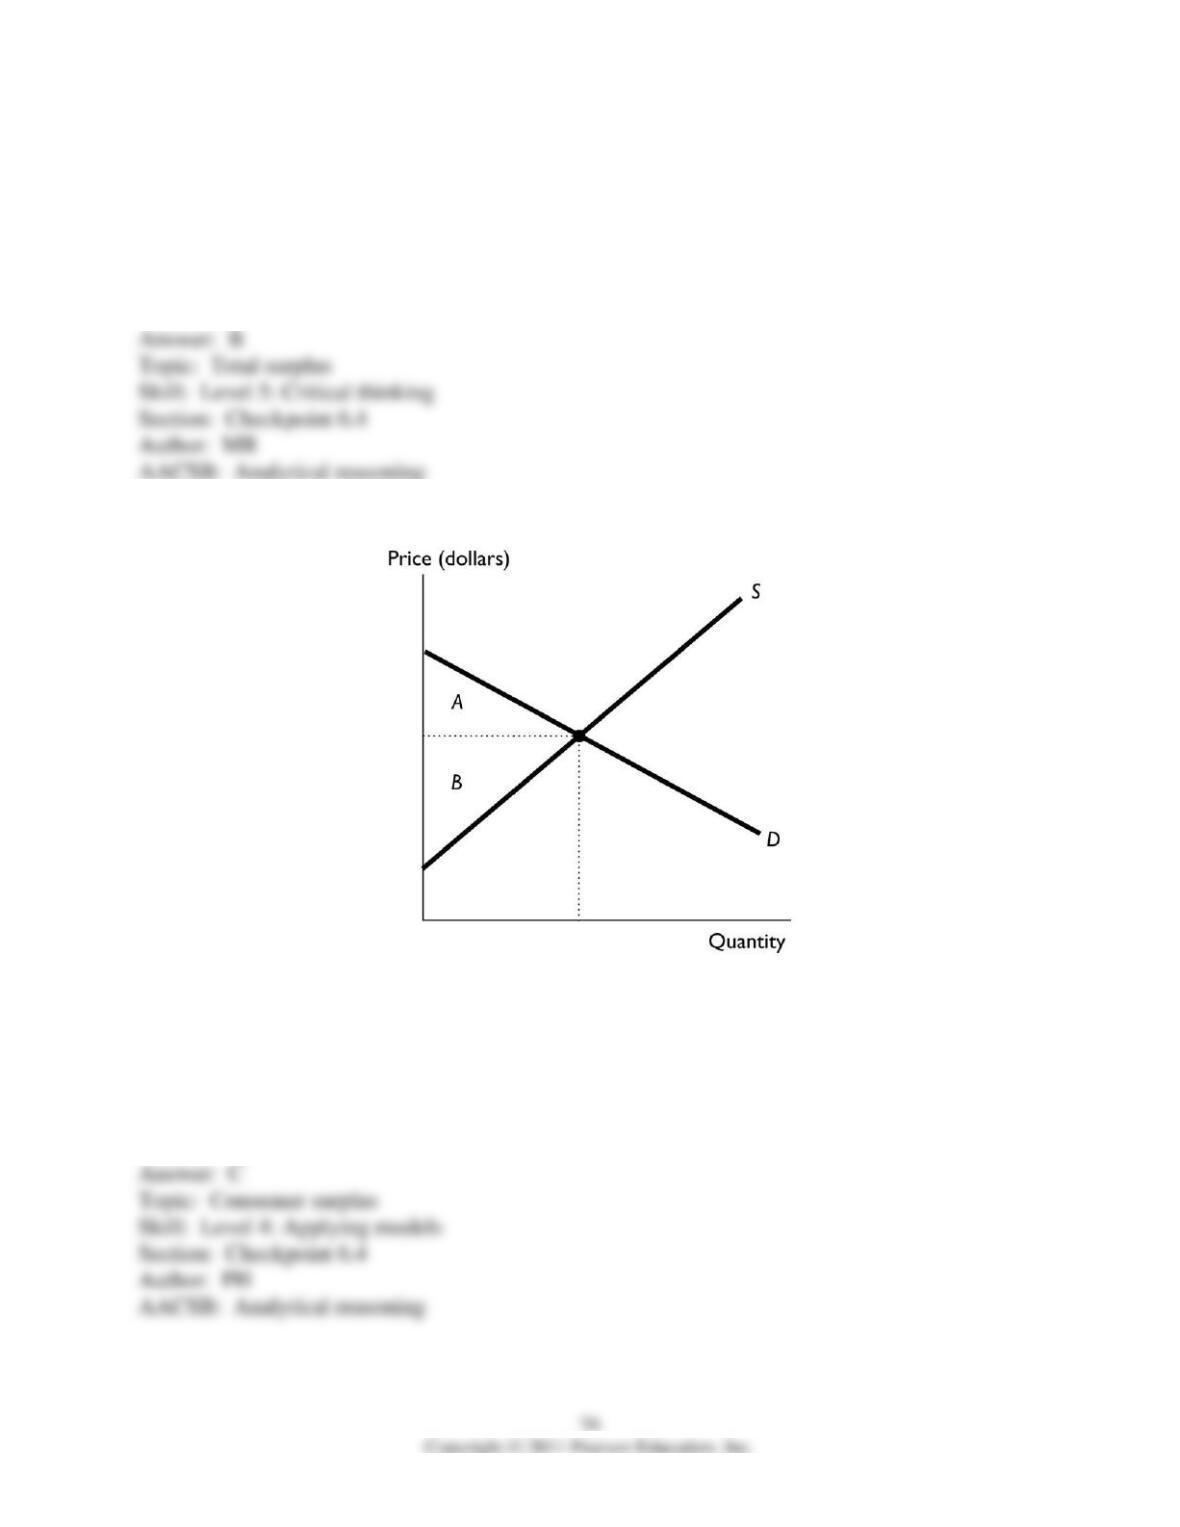
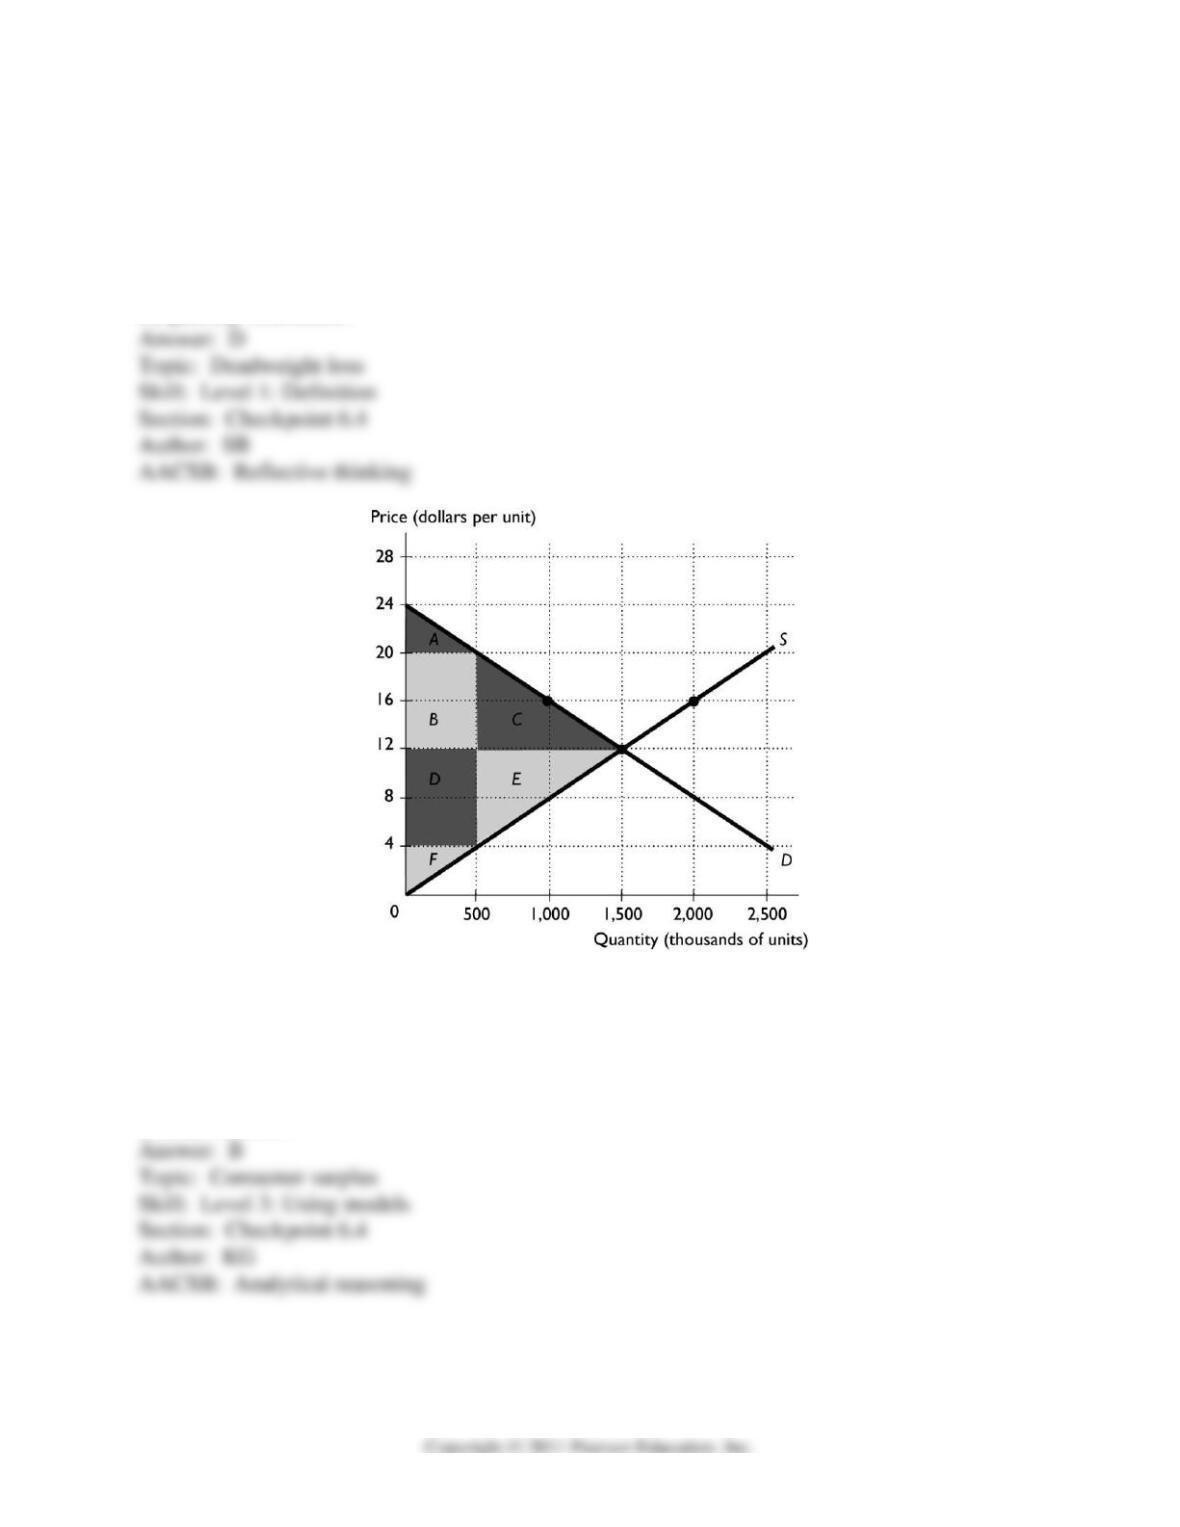
E) between the demand curve and the supply curve.
6.4 Are Markets Efficient?
1) In a competitive market with no externalities,
A) the consumer surplus is equal to zero because of competition.
B) buyers cannot control the price, so the consumer surplus is zero.
C) at the equilibrium price, marginal benefit exceeds marginal cost.
D) at the equilibrium price, marginal benefit equals marginal cost.
E) at the equilibrium price, the total amount of consumer surplus equals the total amount of
producer surplus.
2) A competitive market with no externalities is efficient when it is in equilibrium because
A) total benefit equals total cost.
B) marginal benefit equals marginal cost.
C) consumer surplus equals producer surplus.
D) the sum of consumer surplus plus producer surplus is minimized.
E) the deadweight gain equals its maximum.
3) If marginal benefit is equal to marginal cost, then the
A) producer surplus is equal to the consumer surplus.
B) sum of producer surplus and consumer surplus is as large as possible.
C) sum of producer surplus and consumer surplus equals zero.
D) market has squeezed out total surplus so that it equals zero.
E) deadweight loss is more than zero but less than its maximum.
4) Which of the following occurs when a market is efficient?
A) Consumer surplus equals producer surplus.
B) Consumer surplus is as large as possible.
C) Producer surplus is as large as possible.
D) The sum of consumer surplus and producer surplus is maximized.
E) The marginal benefit exceeds the marginal cost by as much as possible.
5) Efficiency in a market occurs when the production of the good is such that
A) marginal benefit exceeds marginal cost.
B) marginal benefit equals marginal cost.
C) marginal benefit is lower than marginal cost.
D) the marginal cost stops increasing.
E) marginal benefit exceeds marginal cost by the maximum amount possible.
6) At the market equilibrium, when efficiency is attained, the marginal benefit ________ the
marginal cost.
A) is equal to
B) is greater than
C) is less than
D) has no necessary relationship with
E) is equal to the marginal deadweight loss which is equal to
7) If the market for bicycles is efficient, then
A) no more bicycles can be produced.
B) marginal benefit exceeds marginal cost.
C) consumer surplus must be greater than producer surplus.
D) it is not possible to produce more bicycles without sacrificing another, more highly valued
good.
E) consumer surplus must equal producer surplus.
8) When efficiency is attained, the sum of the total amount of consumer surplus and producer
surplus is
A) minimized.
B) maximized.
C) equal to the deadweight loss.
D) undefined.
E) equal to zero.
9) If the marginal benefit of a hot dog is greater than its marginal cost, then to increase
efficiency,
A) more hot dogs should be produced.
B) fewer hot dogs should be produced.
C) nothing should be done if the marginal benefit is greater than the marginal cost by the
maximum amount because in this case the efficient quantity of hot dogs is being produced.
D) production should be halted.
E) More information is needed about the price of a hot dog in order to determine if production
should be increased, decreased, or not changed.
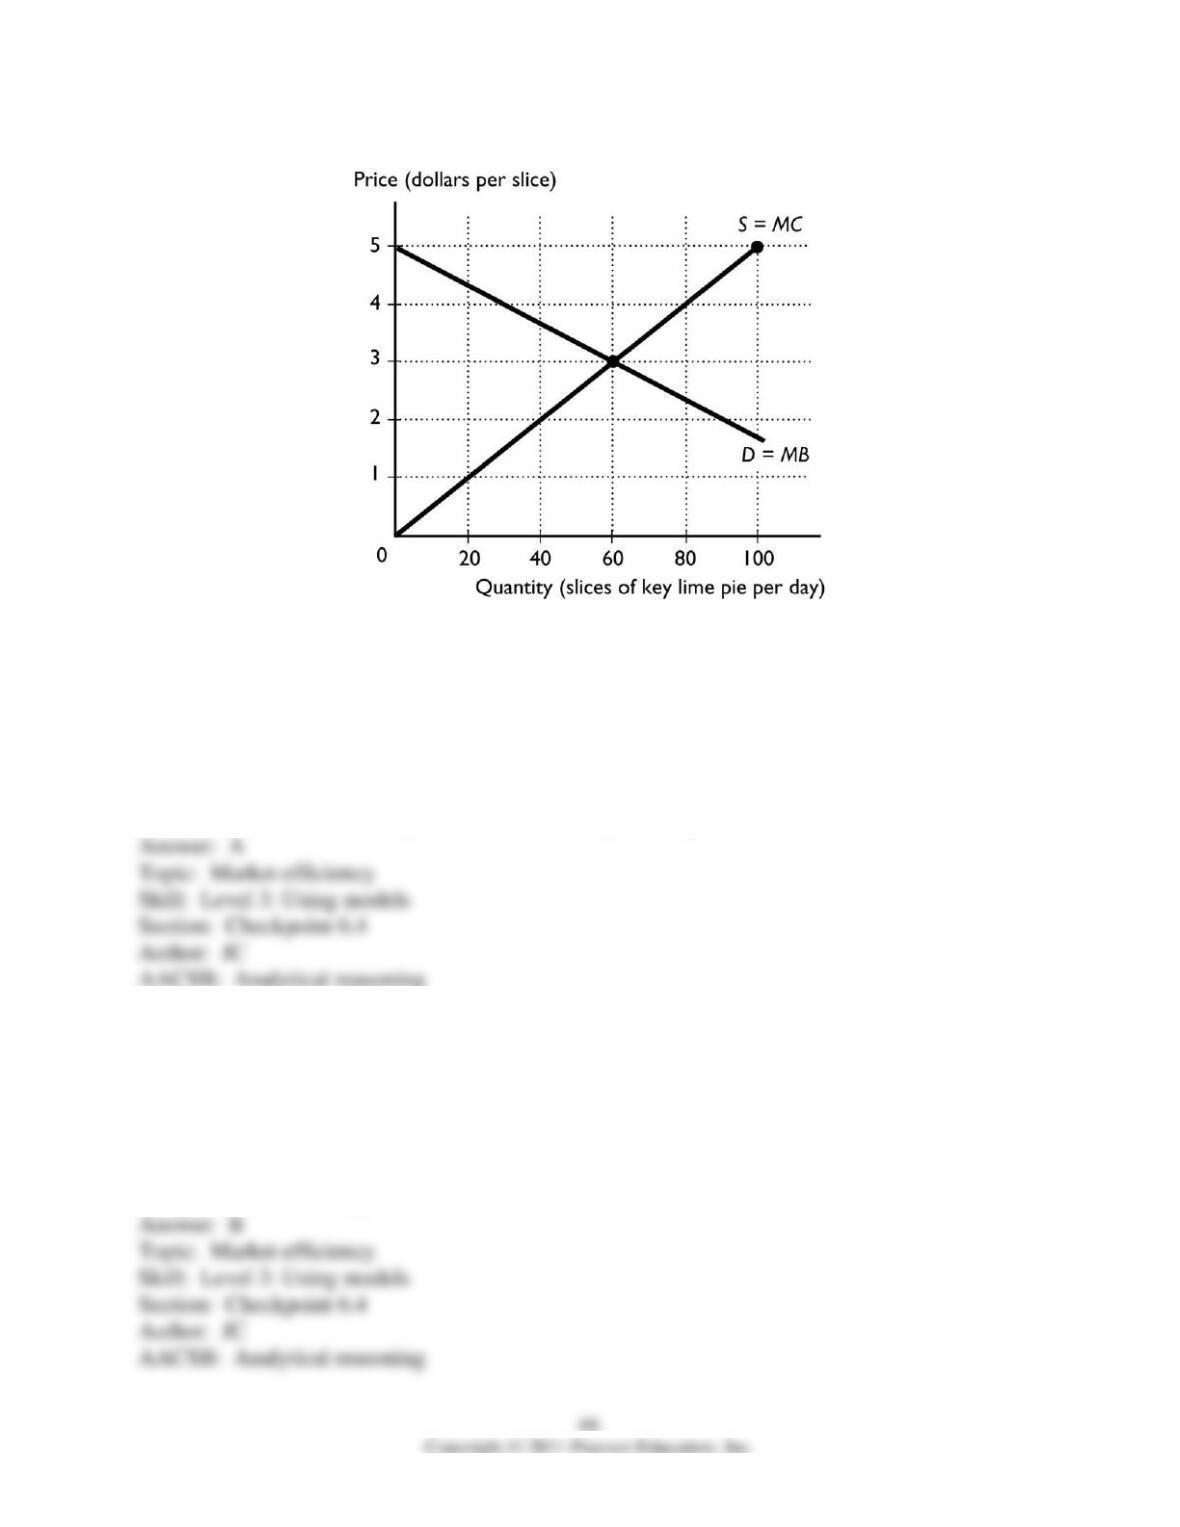
10) The figure above shows the competitive market for slices of key lime pie. If the production is
40 slices per day, someone is willing to buy another slice of pie for
A) more than it costs to produce the slice.
B) less than it costs to produce the slice.
C) an amount equal to the cost of producing the slice.
D) an amount equal to the cost of producing all 40 slices.
E) an amount that is not comparable to the cost of producing the slice.
11) The figure above represents the competitive market for slices of key lime pie. If the
production is 80 slices per day, the cost of the 80th slice is
A) less than anyone is willing to pay for it.
B) more than anyone is willing to pay for it.
C) equal to what someone is willing to pay for it.
D) indeterminant.
E) equal to the deadweight loss from the 80th slice.
12) The figure above represents the competitive market for slices of key lime pie. When 60 slices
are produced, the marginal cost
A) exceeds the marginal benefit.
B) is less than the marginal benefit.
C) equals the marginal benefit.
D) is not defined.
E) equals the deadweight loss on the 60th slice.
13) The figure above represents the competitive market for slices of key lime pie. When the price
equals $3
A) there is a shortage of slices of pie.
B) there is a surplus of slices of pie.
C) the efficient quantity of slices is being produced.
D) the quantity produced is inefficient.
E) the deadweight loss is maximized.
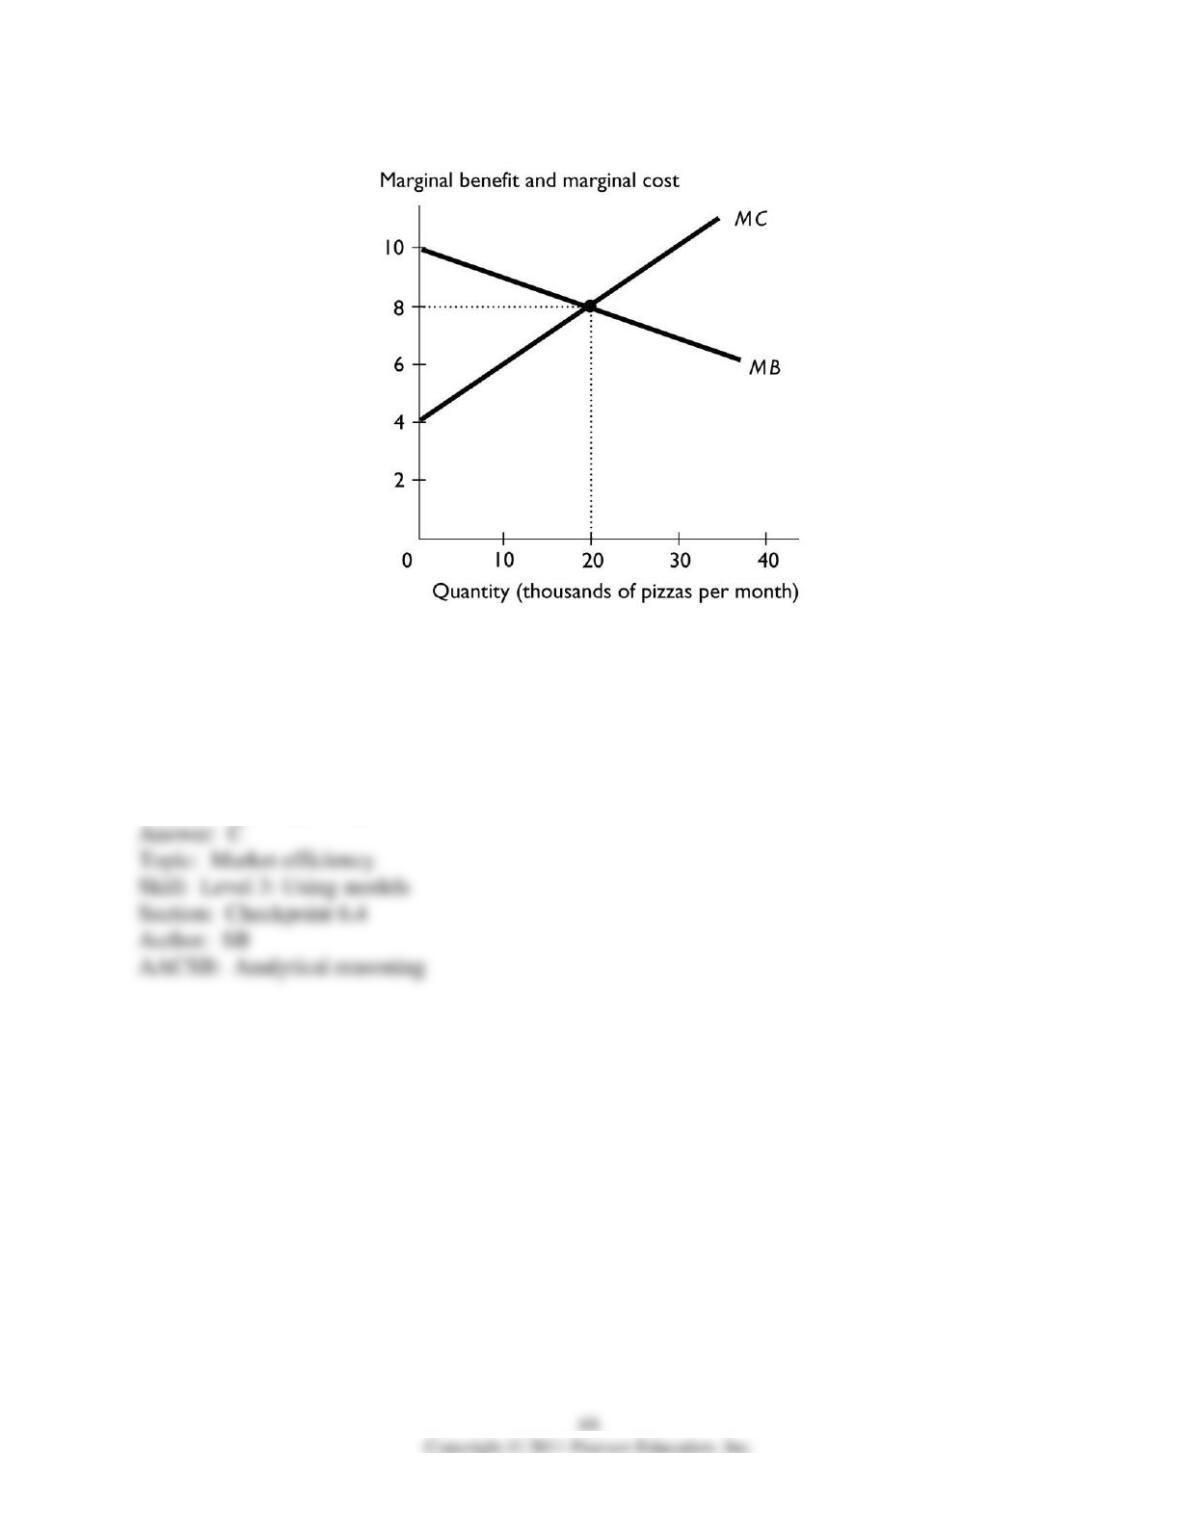
14) The figure above shows the marginal benefit and marginal cost curves for pizza. In the
figure, what is the efficient quantity of pizza?
A) 0 pizzas
B) 10,000 pizzas
C) 20,000 pizzas
D) 30,000 pizzas
E) The efficient quantity cannot be determine without more information.
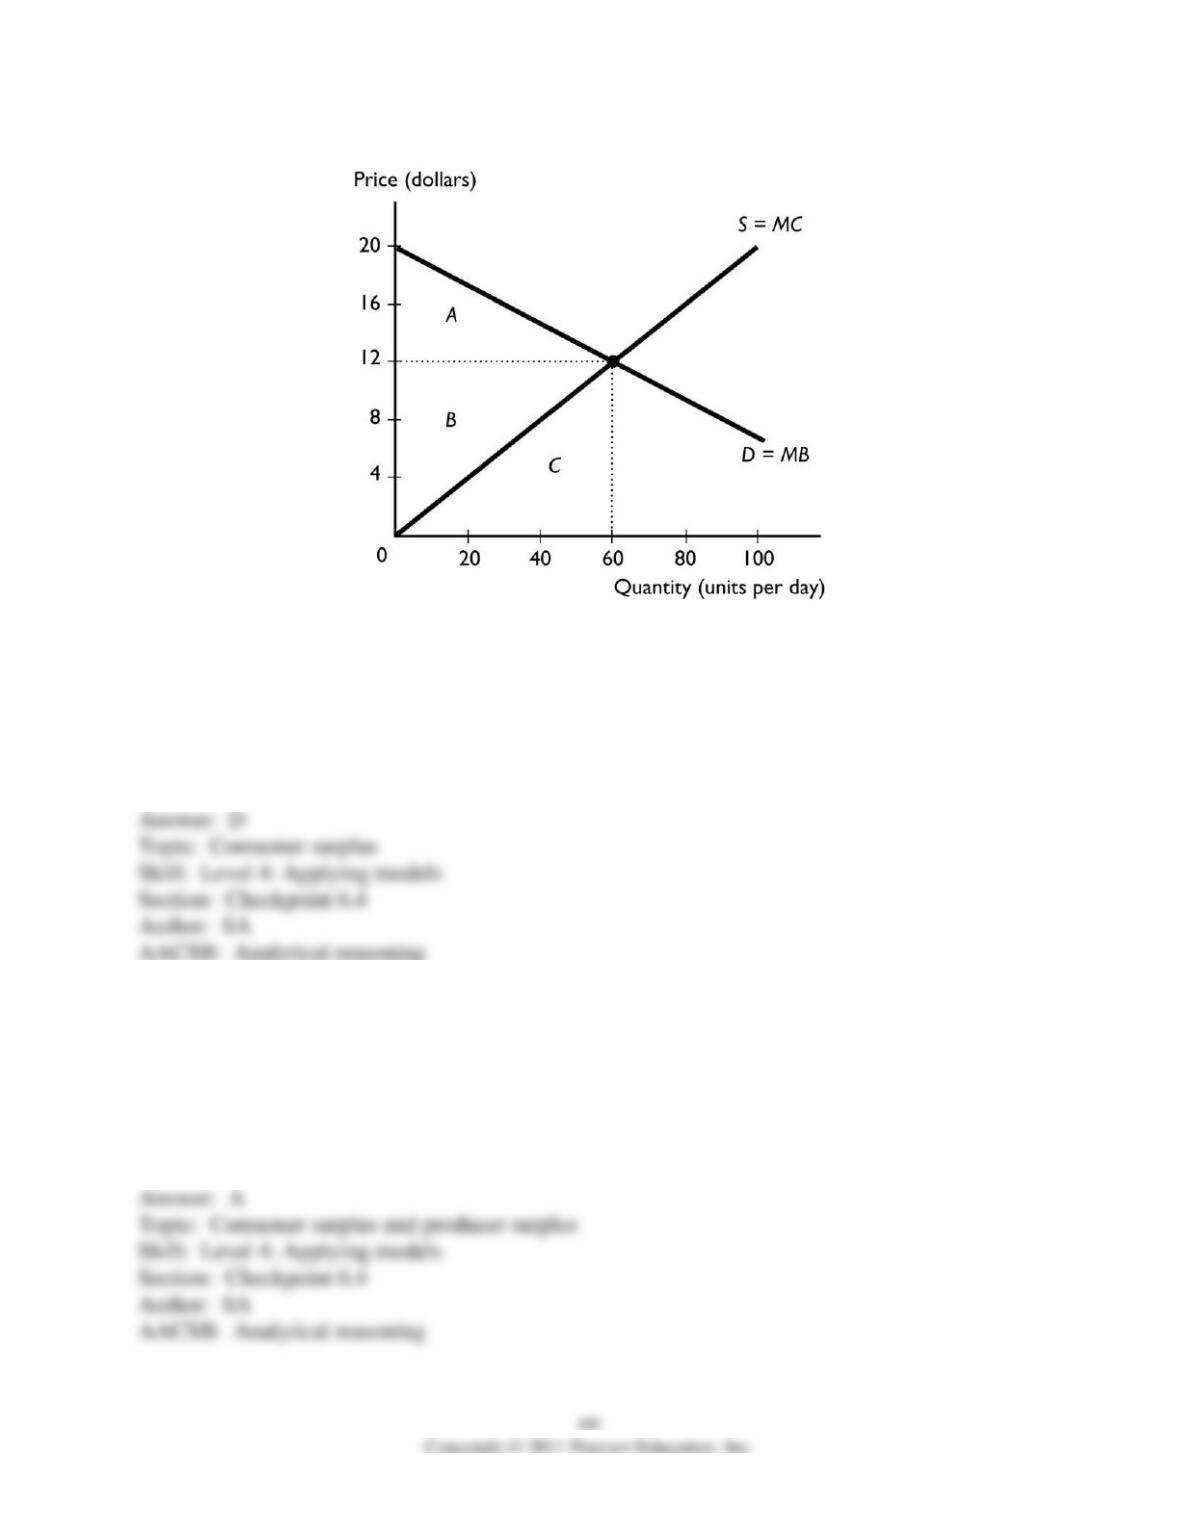
15) In the figure above, if the market price is $12, then the total consumer surplus is
A) $12.
B) $10.
C) minimized.
D) $240.
E) $480.
16) In the figure above, if the market is at equilibrium, then the total consumer surplus equals the
area ________ and the total producer surplus equals the area ________.
A) A; B
B) B; C
C) C; B
D) A; C
E) A + B; C
17) In the figure above, if the market is at equilibrium, the sum of the total consumer surplus and
the total producer surplus is
A) $240.
B) $600.
C) $1,000.
D) $0.
E) $60.
18) In the figure above, suppose the market is at equilibrium. Then area A is the
A) marginal benefit.
B) marginal cost.
C) amount of the consumer surplus.
D) amount of the producer surplus.
E) deadweight loss.
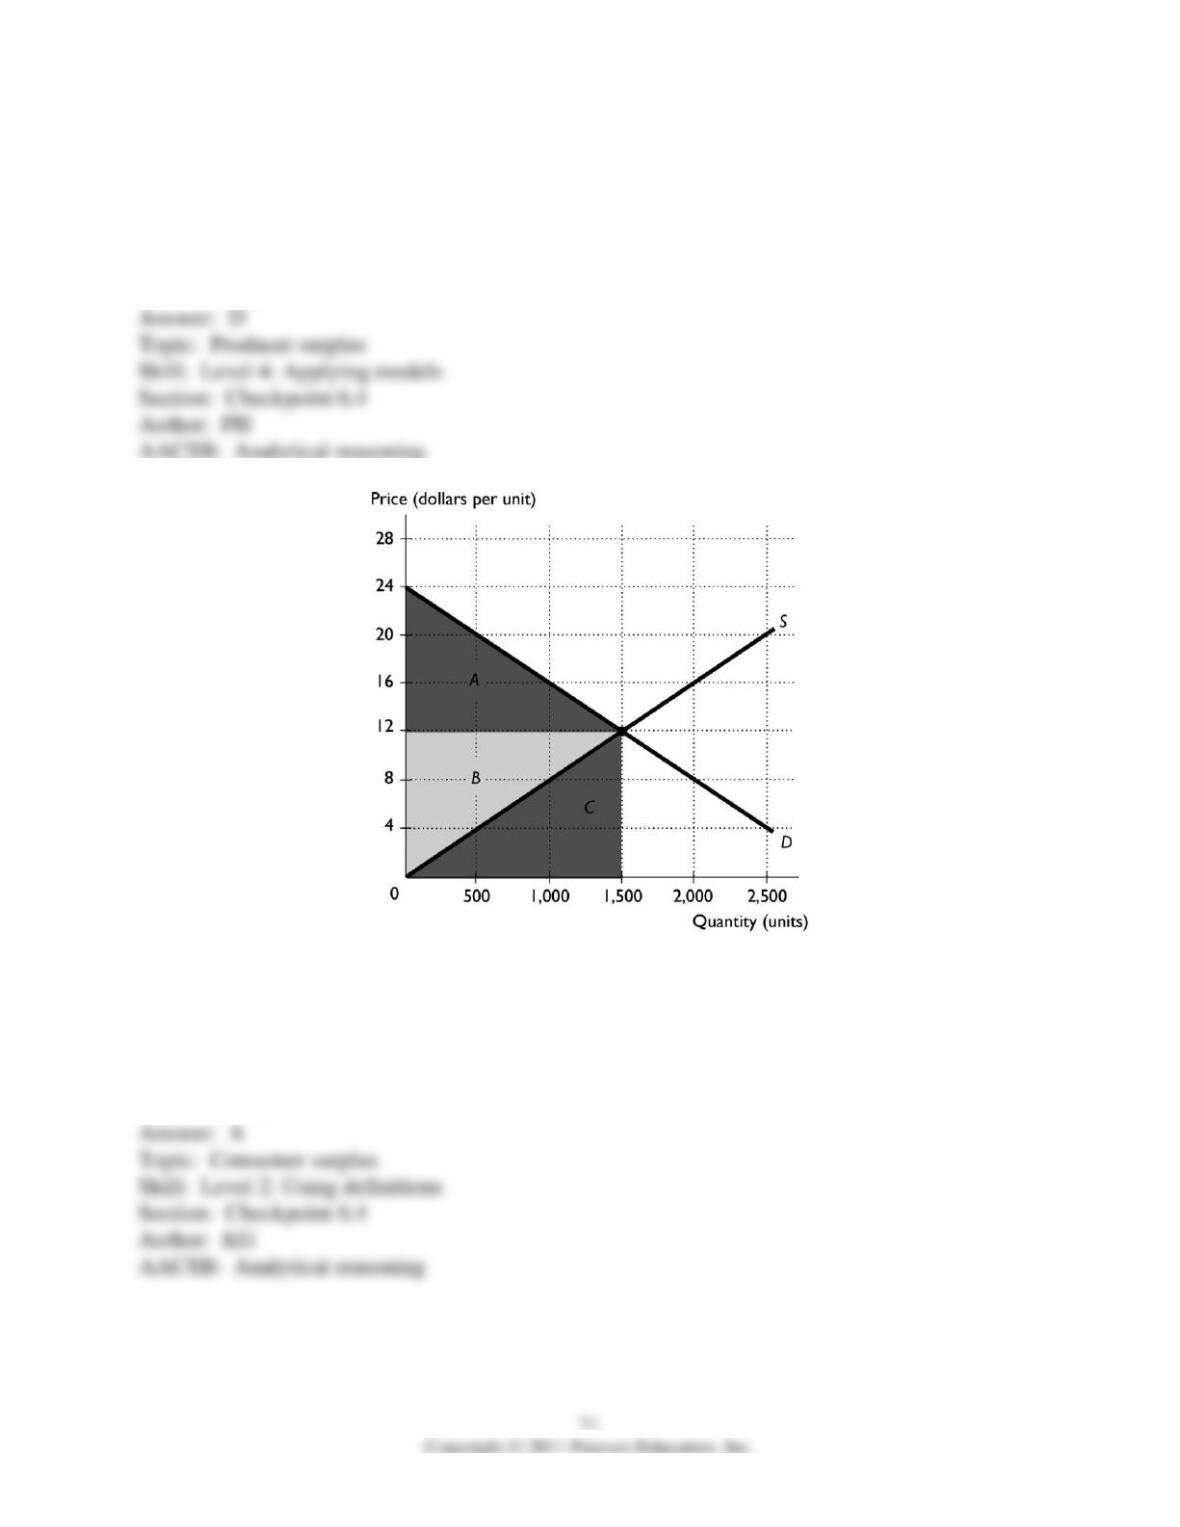
19) In the figure above, suppose the market is at equilibrium. Then area B is the
A) marginal benefit.
B) marginal cost.
C) amount of the consumer surplus.
D) amount of the producer surplus.
E) deadweight loss.
20) In the above figure, the market is at its equilibrium. Area A is equal to
A) consumer surplus.
B) total revenue.
C) marginal benefit.
D) producer surplus.
E) total surplus.
21) In the above figure, the market is at its equilibrium. Area B is equal to
A) consumer surplus.
B) total revenue.
C) marginal benefit.
D) producer surplus.
E) total surplus.
23) The concept of “the invisible hand” suggests that
A) products are produced out of a seller’s sense of charity.
B) when the seller is better off, the buyer is worse off.
C) sellers exploit consumers with high prices.
D) buyers and sellers are self-interested.
E) the command system is the only way of efficiently allocating resources.
24) Adam Smith’s Wealth of Nations, written in 1776, describes the market’s invisible hand
representing the
A) King of England’s control over the colonies.
B) control all governments have in organizing the market.
C) efficiency the market achieves without the interference of governments.
D) inefficiency of markets when governments do not organize them.
E) invisible command system that efficiently allocates resources.
25) What did Adam Smith identify as the source of the invisible hand in 1776?
A) a benevolent central government that decided was best for everyone
B) an individual’s concern for fellow humans
C) an individual’s own self-interest
D) the stock market
E) buyers’ and suppliers’ concerns to obtain and retain good reputations
26) The “invisible hand” refers to the notion that
A) competitive markets send resources to their highest valued uses.
B) government intervention is necessary to ensure efficiency.
C) marginal benefit decreases as more is consumed.
D) marginal cost increases as more is produced.
E) no matter what allocation method is used, the resulting production is efficient.
27) The efficiency of competitive markets happens because
A) of the benevolence of the butcher, the brewer, and the baker.
B) people make environmentally aware purchasing decisions.
C) prices adjust to make buying plans and selling plans compatible.
D) government organizes and monitors production.
E) the U.S. economy uses a command system to allocate resources within the competitive
markets.
28) The concept of “the invisible hand” suggests that to attain efficiency, the government should
A) guide economic activity.
B) set prices.
C) leave prices and output decisions to the competitive market.
D) regulate all production decisions, but not price decisions.
E) make sure that a command system is used to allocate resources.
29) In a competitive market for a private good with no price or quantity regulations, no external
cost nor external benefit, low transactions costs, and no taxes or subsidies,
A) the allocation of resources is planned by the government.
B) production is organized by government organizations.
C) efficiency can be attained in the market with no government intervention.
D) efficiency is usually be achieved by majority rule.
E) efficiency is generally obtained by using a command system.
30) At a competitive equilibrium, if there are no taxes, subsidies, price regulations, quantity
regulations, or externalities
A) the marginal benefit is greater than the marginal cost.
B) resource use is efficient.
C) the marginal benefit is less than the marginal cost.
D) both the marginal benefit and the marginal cost of the last unit produced equal zero.
E) the marginal benefit is greater than the marginal cost by as much as possible.
31) At a competitive market equilibrium, if there are no taxes, subsidies, price regulations,
quantity regulations, or externalities
i. consumer surplus is maximized.
ii. marginal cost equals marginal benefit.
iii. resources are efficiently used.
iv. producer surplus is maximized.
A) ii and iii
B) i and ii
C) i and iv
D) i, ii, iii, and iv
E) ii only
32) When technology increases the supply of a good and lower prices increase the quantity
demanded,
A) the economy is reallocating resources to achieve an efficient allocation.
B) consumer surplus falls.
C) the invisible hand is unnecessary.
D) the marginal benefit of the good increases with the quantity produced.
E) the economy is no longer efficient because the quantity changes.
33) When output is less than the efficient level,
A) consumers are willing to pay more for another unit than it costs to produce the unit.
B) the amount consumers are willing to pay equals the cost of production.
C) the cost of production is greater than the price consumers are willing to pay.
D) the production costs can’t be measured.
E) the marginal cost of producing the good must be greater than the marginal benefit from the
good.
34) When there is underproduction, so that a market produces less than the efficient amount,
A) consumer surplus definitely is larger than when the efficient quantity is produced.
B) the sum of producer surplus and consumer surplus is larger than when the efficient quantity is
produced.
C) there is a deadweight loss.
D) consumers definitely lose and producers definitely gain.
E) consumers definitely gain and producers definitely lose.
35) Overproduction results in
A) external costs.
B) external benefits.
C) deadweight loss.
D) super-efficiency.
E) the marginal benefit of the last unit produced being larger than the marginal cost.
77
36) What do economists call the loss society experiences when the production of a good is less
than the efficient amount?
A) tax
B) subsidy
C) price floor
D) deadweight loss
E) quantity restriction.
37) In the above figure, if the market is in equilibrium, area A + area B + area C equals
A) total surplus.
B) consumer surplus.
C) deadweight loss.
D) producer surplus.
E) total revenue.

38) In the above figure, if the market quantity is restricted to 500,000 and the price is allowed to
rise to set the quantity demanded equal to the quantity supplied, then the producer surplus is
equal to
A) area D + area F.
B) area C + area E.
C) area A + area B + area C.
D) area A + area B.
E) area B + area D + area F.
39) In the above figure, if the quantity is restricted to 500,000 and the price is allowed to rise to
set the quantity demanded equal to the quantity supplied, then area C + area E is equal to
A) deadweight loss.
B) consumer surplus.
C) total surplus.
D) producer surplus.
E) total revenue.
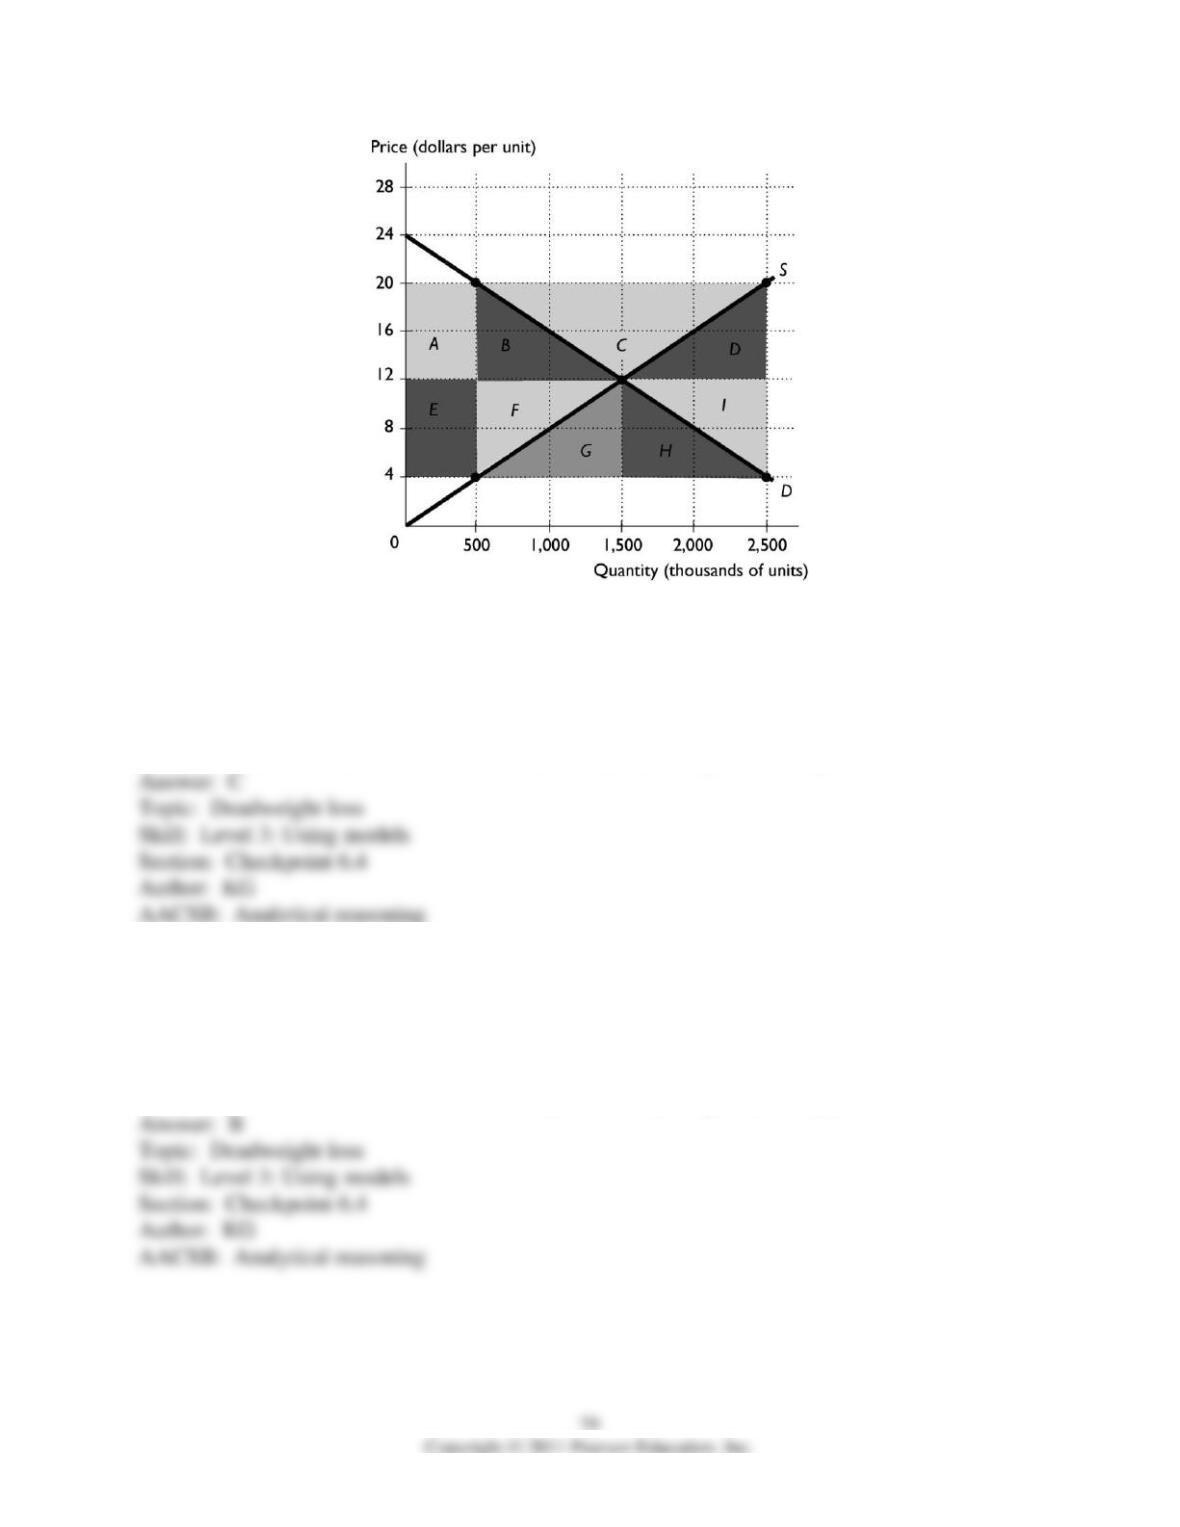
40) In the above figure, if the quantity is equal to 500,000 units, the deadweight loss is equal to
A) area C.
B) area D + area I.
C) area B + area F.
D) area G + area H.
E) None of the above answers is correct because the deadweight loss is equal to zero.
41) In the above figure, if the quantity is equal to 2,500,000 units, the deadweight loss is equal to
A) area B + area F.
B) area D + area I.
C) area C.
D) area G + area H.
E) None of the above answers is correct because the deadweight loss is equal to zero.
42) In the above figure, if the quantity is equal to 1,500,000 units, the deadweight is equal to
A) area A + area B.
B) area C.
C) area B + area F.
D) area G + area H.
E) None of the above answers is correct because the deadweight loss is equal to zero.
43) Which of the following leads to a deadweight loss?
i. overproduction
ii. underproduction
iii. taxes
iv. monopoly
A) ii only
B) iii and iv
C) i and ii
D) i, ii, iii, and iv
E) i, ii, and iii
44) Which of the following government policies ensures market efficiency?
A) subsidy
B) tax
C) price regulations
D) quantity regulations
E) None of the above answers is correct.