
1
Copyright © 2011 Pearson Education, Inc.
Foundations of Microeconomics, 5e (Bade/Parkin)
Chapter 1 Getting Started
1.1 Definition and Questions
1) Scarcity exists because
A) human wants exceed the resources available to satisfy them.
B) some individuals have low income.
C) the costs of production are high.
D) some people make bad economic decisions.
E) people take too much leisure time.
Skill: Level 1: Definition
Section: Checkpoint 1.1
Author: TS
AACSB: Reflective thinking
2) Scarcity
A) is the inability to satisfy all our wants.
B) leads to higher prices.
C) applies only to people living in poverty.
D) is not something that affects very rich people.
E) used to exist everywhere but has been eliminated in advanced economies.
Skill: Level 1: Definition
Section: Checkpoint 1.1
Author: SA
AACSB: Reflective thinking
3) Scarcity requires that we
A) produce efficiently.
B) learn to limit our wants.
C) have the most rapid economic growth possible.
D) have unlimited resources.
E) make choices about what goods and services to produce.
Skill: Level 1: Definition
Section: Checkpoint 1.1
Author: PH
AACSB: Reflective thinking

2
Copyright © 2011 Pearson Education, Inc.
4) Scarcity means that
A) what we can produce with our resources is greater than our material wants.
B) resources are unlimited.
C) wants are greater than what we can produce with out resources.
D) governments must make up for shortages in resources.
E) choices made in self-interest cannot be the same as those made in the social interest.
Skill: Level 1: Definition
Section: Checkpoint 1.1
Author: PH
AACSB: Reflective thinking
5) Because human wants are insatiable and unlimited while available resources are limited,
people are said to face the problem of
A) scarcity.
B) why to produce.
C) macroeconomics.
D) microeconomics.
E) social interest versus self-interest.
Skill: Level 1: Definition
Section: Checkpoint 1.1
Author: PH
AACSB: Reflective thinking
6) Which of the following statements best describes the study of economics? Economics studies
how
A) to organize production so that scarcity does not occur.
B) firms make profits.
C) we make choices in the face of scarcity.
D) to create incentives so that scarcity does not exist.
E) businesses reach decisions.
Skill: Level 1: Definition
Section: Checkpoint 1.1
Author: CD
AACSB: Reflective thinking

3
Copyright © 2011 Pearson Education, Inc.
7) Scarcity forces people to
A) choose among available alternatives.
B) cheat and steal.
C) be unwilling to help others.
D) live at a low standard of living.
E) consume as much as they can as quickly as they can.
Skill: Level 2: Using definitions
Section: Checkpoint 1.1
Author: TS
AACSB: Reflective thinking
8) Scarcity means we must
A) consume less.
B) produce less.
C) make choices.
D) earn more.
E) work more.
Skill: Level 1: Definition
Section: Checkpoint 1.1
Author: SB
AACSB: Reflective thinking
9) What is the reason that all economic issues and problems occur?
A) All nations use some form of money to buy and sell goods and services.
B) Humans are always wasteful and inefficient in production and consumption.
C) Powerful governments are able to control production and consumption.
D) Human wants exceed the resources available to satisfy them.
E) People seek only their own self-interest.
Skill: Level 2: Using definitions
Section: Checkpoint 1.1
Author: TS
AACSB: Reflective thinking

4
Copyright © 2011 Pearson Education, Inc.
10) The study of economics is best described as a study of
A) the factors that influence the stock and bond markets.
B) capitalism.
C) the choices made in producing goods and services.
D) coping with scarcity, and choices made as a result of scarcity in a society.
E) how people earn a living.
Skill: Level 1: Definition
Section: Checkpoint 1.1
Author: PH
AACSB: Reflective thinking
11) Which of the following statements best describes the study of economics? Economics studies
how
A) to organize production so that scarcity does not occur.
B) firms make profits.
C) we make choices in the face of scarcity.
D) to create incentives so that scarcity does not exist.
E) businesses reach decisions.
Skill: Level 1: Definition
Section: Checkpoint 1.1
Author: CD
AACSB: Reflective thinking
12) Which of the following best defines economics?
A) Economics teaches how to limit our wants.
B) Economics studies how to choose the best alternative when coping with scarcity.
C) Economics helps you earn as much money as possible.
D) Economics analyzes all aspects of human behavior in general.
E) Economics is concerned with prices and quantities of goods and services, both at the
individual level and at the industry level.
Skill: Level 1: Definition
Section: Checkpoint 1.1
Author: TS
AACSB: Reflective thinking

5
Copyright © 2011 Pearson Education, Inc.
13) Economics is the social science that studies
A) the real reasons people buy goods and services.
B) the psychology of individuals and businesses.
C) whether a nation has enough natural resources.
D) how people make choices to cope with scarcity.
E) how choices made in the social interest could eliminate scarcity.
Skill: Level 1: Definition
Section: Checkpoint 1.1
Author: SA
AACSB: Reflective thinking
14) Economics is defined as the social science that studies
A) how a person can get everything he or she wants.
B) the reason money exists.
C) the way to eliminate choices in our decisions.
D) the choices that societies, and the people and institutions that make up societies, make in
dealing with the issue of scarcity.
E) how choices made in the social interest must conflict with choices made in the self-interest.
Skill: Level 1: Definition
Section: Checkpoint 1.1
Author: JC
AACSB: Reflective thinking
15) When you make the decision to spend your time attending class, which economic question
are you answering?
A) What?
B) How?
C) For whom?
D) Why?
E) Social interest
Skill: Level 2: Using definitions
Section: Checkpoint 1.1
Author: SB
AACSB: Reflective thinking

6
Copyright © 2011 Pearson Education, Inc.
16) Of the three major economic questions, which of the following is the best example of a
“What?” question?
A) Should automobiles be produced using workers or robots?
B) Should higher-income or lower-income people buy SUVs?
C) Should we make faster microprocessors or pest-resistant corn?
D) Should migrant workers or domestic workers be used to pick grapes?
E) What should doctors be paid?
Skill: Level 2: Using definitions
Section: Checkpoint 1.1
Author: SA
AACSB: Reflective thinking
17) When Ford decides to increase production of hybrid cars, it directly answers the ________
question.
A) what
B) how
C) for whom
D) where
E) why
Skill: Level 2: Using definitions
Section: Checkpoint 1.1
Author: CD
AACSB: Reflective thinking
18) When Delta decides to quit flying to Lithuania, it directly answers the ________ question.
A) what
B) why
C) for whom
D) how
E) when
Skill: Level 2: Using definitions
Section: Checkpoint 1.1
Author: CD
AACSB: Reflective thinking

7
Copyright © 2011 Pearson Education, Inc.
19) The question of “What goods and services get produced?” most closely relates to which of
the following issues?
A) the distribution of goods and services in the economy
B) producing goods and services in the least costly manner
C) building a missile defense system, or putting a computer in every elementary school
classroom
D) obtaining specialized training to increase one’s income
E) taxing high income workers to give payments to poor households
Skill: Level 3: Using models
Section: Checkpoint 1.1
Author: PH
AACSB: Reflective thinking
20) When a home builder decides to computerize all of its production schedule, it directly
answers the ________ question.
A) for whom
B) what
C) where
D) how
E) why
Skill: Level 2: Using definitions
Section: Checkpoint 1.1
Author: CD
AACSB: Reflective thinking
21) When Fresh Express Salads decides to mechanically pick all of its lettuce, it directly answers
the ________ question.
A) what
B) how
C) for whom
D) where
E) when
Skill: Level 2: Using definitions
Section: Checkpoint 1.1
Author: CD
AACSB: Reflective thinking

8
Copyright © 2011 Pearson Education, Inc.
22) When the power company decides to use manpower to bury its lines, it directly answers the
________ question.
A) what
B) for whom
C) how
D) why
E) when
Skill: Level 2: Using definitions
Section: Checkpoint 1.1
Author: CD
AACSB: Reflective thinking
23) The question of “How are goods and services produced?” most closely addresses which of
the following issues?
A) Should Ford build SUV’s or luxury cars?
B) Should Ford use expensive industrial robots or inexpensive Mexican autoworkers to produce
SUV’s?
C) Should contractors building residential housing or shopping malls?
D) Is income distributed fairly in the United States?
E) Why are Christmas trees popular only in December?
Skill: Level 2: Using definitions
Section: Checkpoint 1.1
Author: PH
AACSB: Reflective thinking
24) Of the three major economic questions, which of the following is the best example of a
“How?” question?
A) Should we produce more heavy fleece coats?
B) Should we collect tolls on turnpikes using human toll collectors or mechanized toll machines?
C) Should we build log homes or build factories from bricks?
D) Should we spend more on health care?
E) Should we eat more oatmeal?
Skill: Level 2: Using definitions
Section: Checkpoint 1.1
Author: SA
AACSB: Reflective thinking
9
Copyright © 2011 Pearson Education, Inc.
25) Which economic question depends on the incomes that people earn and the prices they pay
for goods and services?
A) What?
B) How?
C) For whom?
D) Why?
E) Where?
Skill: Level 1: Definition
Section: Checkpoint 1.1
Author: SB
AACSB: Reflective thinking
26) When the federal government decides to pay senators more than it pays soldiers, it answers
the ________ question.
A) why
B) how
C) for whom
D) what
E) where
Skill: Level 2: Using definitions
Section: Checkpoint 1.1
Author: CD
AACSB: Reflective thinking
27) When a third string professional quarterback earns more than a police officer, society
answers the ________ question.
A) for whom
B) what
C) how
D) why
E) social interest vs. self-interest
Skill: Level 2: Using definitions
Section: Checkpoint 1.1
Author: CD
AACSB: Reflective thinking

10
Copyright © 2011 Pearson Education, Inc.
28) When unskilled teens earn less than college graduates, society answers the ________
question.
A) how
B) what
C) for whom
D) why
E) social interest versus self-interest
Skill: Level 2: Using definitions
Section: Checkpoint 1.1
Author: CD
AACSB: Reflective thinking
29) Canada has nationalized health care, so that everyone, regardless of their ability to pay, has
some access to health care. Based on this observation, Canada has decided that “everyone,
regardless of their ability to pay” is the answer to what microeconomic question?
A) What type of health care will be produced and in what quantity?
B) How will health care be produced?
C) For whom will health care be produced?
D) Why will we offer health care?
E) Must we offer health care?
Skill: Level 3: Using models
Section: Checkpoint 1.1
Author: JC
AACSB: Analytical reasoning
30) Choices that are best for the individuals that make them are choices in pursuit of
A) the social interest.
B) efficiency.
C) incentives.
D) self interest.
E) equity.
Skill: Level 1: Definition
Section: Checkpoint 1.1
Author: KG
AACSB: Reflective thinking

11
Copyright © 2011 Pearson Education, Inc.
31) Self interest
A) reflects choices that are best for society as a whole.
B) reflects choices that are best for the individual who makes them.
C) has nothing to do with determining what goods are produced.
D) occurs only when wants exceed available resources.
E) cannot be used to determine how goods are produced.
Skill: Level 1: Definition
Section: Checkpoint 1.1
Author: KG
AACSB: Reflective thinking
32) Choices that are best for the society as a whole are choices in pursuit of
A) answering the “how” question.
B) the social interest.
C) self interest.
D) incentives.
E) answering the “for whom” question.
Skill: Level 1: Definition
Section: Checkpoint 1.1
Author: KG
AACSB: Reflective thinking
33) The characteristic from which all economic problems arise is
A) political decisions.
B) providing a minimal standard of living for every person.
C) how to make a profit.
D) hunger.
E) scarcity.
Skill: Level 2: Using definitions
Section: Checkpoint 1.1
Author: STUDY GUIDE
AACSB: Reflective thinking

12
Copyright © 2011 Pearson Education, Inc.
34) All economic questions and problems arise from
A) the fact that society has more than it needs.
B) turmoil in the stock market.
C) the unequal distribution of income.
D) a society’s wants exceeding what its scarce resources can produce.
E) the difference between self-interest and social interest.
Skill: Level 1: Definition
Section: Checkpoint 1.1
Author: MyEconLab Web Site
AACSB: Reflective thinking
35) Scarcity results from the fact that
A) people’s wants exceed the resources available to satisfy them.
B) not all goals are desirable.
C) we cannot answer the major economic questions.
D) choices made in self-interest rare not always in the social interest.
E) the population keeps growing.
Skill: Level 1: Definition
Section: Checkpoint 1.1
Author: STUDY GUIDE
AACSB: Reflective thinking
36) To economists, scarcity means that
A) limited wants cannot be satisfied by the unlimited resources.
B) a person looking for work is not able to find work.
C) the number of people without jobs rises when economic times are bad.
D) there can never be answers to the what, how or for whom questions.
E) unlimited wants cannot be satisfied by the limited resources.
Skill: Level 1: Definition
Section: Checkpoint 1.1
Author: STUDY GUIDE
AACSB: Reflective thinking

13
Copyright © 2011 Pearson Education, Inc.
37) Which of the following statements is true regarding scarcity?
A) Scarcity affects poorer countries only.
B) An economy experiences scarcity only when the incomes of its citizens decline.
C) Poor people experience scarcity more often than do rich people.
D) All citizens in a wealthy economy experience scarcity.
E) Scarcity could be overcome if people would make all choices in the social interest.
Skill: Level 2: Using definitions
Section: Checkpoint 1.1
Author: MyEconLab Web Site
AACSB: Reflective thinking
38) People must make choices because
A) most people enjoy shopping.
B) of scarcity.
C) there are many goods available.
D) the question “What goods and services are produced?” is not adequately answered.
E) making choices is in the social interest.
Skill: Level 2: Using definitions
Section: Checkpoint 1.1
Author: MyEconLab Web Site
AACSB: Reflective thinking
39) The question “Should we produce LCD televisions or computer monitors?” is an example of
a ________ question.
A) what
B) how
C) for whom
D) where
E) why
Skill: Level 2: Using definitions
Section: Checkpoint 1.1
Author: STUDY GUIDE
AACSB: Reflective thinking

14
Copyright © 2011 Pearson Education, Inc.
40) When Ferrari decides to produce 1,200 360 Modenas each year, Ferrari is answering the
________ question.
A) for whom
B) how
C) what
D) why
E) scarcity
Skill: Level 2: Using definitions
Section: Checkpoint 1.1
Author: MyEconLab Web Site
AACSB: Reflective thinking
41) Whether a company produces fishing rods mostly by hand or using high-tech machinery is a
question of
A) for whom will goods be produced.
B) when will the goods be produced.
C) where will the goods be produced.
D) how will the goods be produced.
E) why will the goods be produced.
Skill: Level 2: Using definitions
Section: Checkpoint 1.1
Author: MyEconLab Web Site
AACSB: Reflective thinking
42) When a landscaping company decides to use drafting software and computers instead of
hiring designers to draw design plans by hand, it is answering the ________ question.
A) how
B) what
C) for whom
D) opportunity cost
E) why
Skill: Level 2: Using definitions
Section: Checkpoint 1.1
Author: MyEconLab Web Site
AACSB: Reflective thinking

15
Copyright © 2011 Pearson Education, Inc.
43) The question “Should we produce houses using bricks or wood?” is an example of a
________ question.
A) what
B) how
C) for whom
D) where
E) why
Skill: Level 2: Using definitions
Section: Checkpoint 1.1
Author: STUDY GUIDE
AACSB: Reflective thinking
44) The question “Should economics majors or sociology majors earn more after they graduate?”
is an example of a ________ question.
A) what
B) how
C) for whom
D) where
E) why
Skill: Level 2: Using definitions
Section: Checkpoint 1.1
Author: STUDY GUIDE
AACSB: Reflective thinking
45) If a decision is made and it is the best choice for society, the decision is said to be
A) a valid economic choice.
B) made in self-interest.
C) made in social interest.
D) consist with scarcity.
E) a want-maximizing choice.
Skill: Level 2: Using definitions
Section: Checkpoint 1.1
Author: STUDY GUIDE
AACSB: Reflective thinking

16
Copyright © 2011 Pearson Education, Inc.
1.2 The Economic Way of Thinking
1) Which is not a core economic idea?
A) People make rational choices by comparing costs and benefits.
B) Efficiency and equity are important goals for an economy.
C) Cost is what you must give up to get something.
D) A rational choice is made on the margin.
E) Choices respond to incentives.
Skill: Level 1: Definition
Section: Checkpoint 1.2
Author: KG
AACSB: Reflective thinking
2) Rational choice
A) is a choice that uses the available resources to best achieve the objective of the person making
the choice.
B) is always efficient.
C) is what you must give up get what you want.
D) is made by comparing different incentives.
E) provides the answer to only the “how” question.
Skill: Level 1: Definition
Section: Checkpoint 1.2
Author: KG
AACSB: Reflective thinking
3) A rational choice is one that
A) always turns out for the best for the decision maker.
B) creates no costs for the decision maker.
C) must be made with perfect information.
D) uses the available resources to most effectively satisfy the wants of the person making the
choice.
E) is made in the social interest rather than the self-interest.
Skill: Level 1: Definition
Section: Checkpoint 1.2
Author: JC
AACSB: Reflective thinking

17
Copyright © 2011 Pearson Education, Inc.
4) What is NOT true about rational choice?
A) It can result in different decisions for different individuals.
B) It involves comparing costs and benefits.
C) It might turn out not to have been the best choice after the event.
D) It is a choice that uses the available resources to best achieve the objective of the person
making the choice.
E) It is the same for all individuals.
Skill: Level 1: Definition
Section: Checkpoint 1.2
Author: KG
AACSB: Reflective thinking
5) In economics, cost is ________, and benefit is ________.
A) what you must give up to get something; what you are willing to give up to get it
B) what you are willing to give up to get it; what you must give up to get something
C) the amount of money that you pay for something; the amount of money that someone else is
willing to pay you
D) what you are willing to pay on the margin; what the government pays you when you are
unemployed or retired
E) the amount of money that you pay on the margin; the amount of money that you receive on
the margin
Skill: Level 1: Definition
Section: Checkpoint 1.2
Author: CO
AACSB: Reflective thinking
6) An opportunity cost is
A) the dollar amount that is paid.
B) anything the decision maker believes costs to be.
C) the benefits of the highest-valued alternative forgone.
D) whatever is paid out and cannot be reduced or reversed.
E) another term for all the sunk costs.
Skill: Level 1: Definition
Section: Checkpoint 1.2
Author: TS
AACSB: Reflective thinking

18
Copyright © 2011 Pearson Education, Inc.
7) Economists measure opportunity cost
A) only when it is on the margin.
B) as the highest-valued alternative forgone.
C) as the sum of all forgone opportunities.
D) in time.
E) as equal to the sum of all the sunk costs.
Skill: Level 1: Definition
Section: Checkpoint 1.2
Author: SB
AACSB: Reflective thinking
8) The opportunity cost of a decision is measured in terms of
A) time.
B) the price of the alternative we choose.
C) the next best thing given up.
D) the price of a new opportunity that arises.
E) sunk cost.
Skill: Level 2: Using definitions
Section: Checkpoint 1.2
Author: PH
AACSB: Reflective thinking
9) You have chosen to take a trip during spring break. If you had not gone, you would either
have worked at a temporary job or studied for exams. The opportunity cost of your trip is
A) the wages you would have earned from working.
B) the lower grade earned by not studying.
C) the wages you would have earned from working and the lower grade earned by not studying.
D) the value of the trip.
E) We cannot determine what the opportunity cost is without knowing which alternative,
working or studying, you would have preferred.
Skill: Level 2: Using definitions
Section: Checkpoint 1.2
Author: CD
AACSB: Reflective thinking

19
Copyright © 2011 Pearson Education, Inc.
10) If Jessie studies economics for two hours instead of going to the movies with her friends,
then
A) the benefit of studying is the missed movie.
B) the opportunity cost of studying is the missed movie.
C) Jesse definitely is making a rational choice.
D) Jessie is ignoring a sunk cost.
E) Jessie is not responding to any incentives.
Skill: Level 2: Using definitions
Section: Checkpoint 1.2
Author: KG
AACSB: Reflective thinking
11) The value of the highest-valued alternative that a person must give up when making a
decision is known as the ________ cost.
A) direct
B) benefit’s
C) opportunity
D) explicit
E) sunk
Skill: Level 1: Definition
Section: Checkpoint 1.2
Author: SA
AACSB: Reflective thinking
12) Ali decides to attend the one-hour review session for microeconomics instead of working at
his job. His job pays him $10 per hour. Ali’s opportunity cost of attending the review session is
A) the $10 he could have earned at his job.
B) the value of the session minus the $10 he could have earned at his job.
C) nothing, because the review session does not cost anything.
D) equal to the benefit he gets from the review session.
E) the one-hour review session.
Skill: Level 2: Using definitions
Section: Checkpoint 1.2
Author: SA
AACSB: Analytical reasoning

20
Copyright © 2011 Pearson Education, Inc.
13) In 2003, Michael Jordan decided to retire from professional basketball. Which of the
following was an opportunity cost of his decision?
A) the lost salary from playing one more year
B) the time he could spend with his family while retired
C) the avoidance of pain and injury from playing one more year
D) the value of new employment opportunities that would await him
E) Both answers A and B are correct.
Skill: Level 2: Using definitions
Section: Checkpoint 1.2
Author: JC
AACSB: Reflective thinking
14) In order to study one more hour of economics, you must give up one hour of tennis. The hour
of tennis is
A) the benefit of spending the hour studying.
B) the cost of spending the hour studying.
C) a sunk cost.
D) a sunk benefit.
E) the incentive to study.
Skill: Level 2: Using definitions
Section: Checkpoint 1.2
Author: SB
AACSB: Reflective thinking
15) Suppose that, instead of taking this test, you could either have worked and earned income or
partied and had a pleasurable time. Your opportunity cost of taking the test is the
A) forgone work.
B) forgone party.
C) forgone working and partying.
D) forgone working or partying, depending on which was your next best choice.
E) test because you are taking it.
Skill: Level 2: Using definitions
Section: Checkpoint 1.2
Author: SB
AACSB: Reflective thinking

21
Copyright © 2011 Pearson Education, Inc.
16) Suppose you have tickets to a hockey game. The tickets cannot be refunded or resold. In
deciding whether or not to attend the game, the cost of the tickets is
A) a marginal benefit of choosing to attend.
B) a marginal cost of choosing to attend.
C) a sunk cost.
D) an opportunity cost of missing the game.
E) an incentive.
Skill: Level 2: Using definitions
Section: Checkpoint 1.2
Author: SB
AACSB: Reflective thinking
17) Which of the following is an example of a sunk cost?
A) after you start watching a movie, the $8 you paid for the ticket
B) the $100,000 a shoe factory will pay for the leather it uses to make shoes
C) the electricity purchased by a horse breeder
D) the $10 being spent on gasoline purchased by a traveling salesperson
E) the $6,000 Tommy’s insurance company pays him after an accident.
Skill: Level 2: Using definitions
Section: Checkpoint 1.2
Author: JC
AACSB: Reflective thinking
18) A cost that is previously incurred and irreversible is known as ________ cost.
A) a sunk
B) a benefit’s
C) an opportunity
D) an explicit
E) marginal
Skill: Level 1: Definition
Section: Checkpoint 1.2
Author: JC
AACSB: Reflective thinking

22
Copyright © 2011 Pearson Education, Inc.
19) Suppose you paid $400 tuition for a three-credit course. After the official withdrawal date
has elapsed, you decide to drop the course but you cannot get back your $400. At this time, the
$400 is
A) the benefit of earning three credits.
B) an expenditure made on the margin.
C) a sunk cost.
D) the opportunity cost of the course.
E) the marginal cost of the course.
Skill: Level 3: Using models
Section: Checkpoint 1.2
Author: SA
AACSB: Reflective thinking
20) The benefit from a good or service that you purchase is measured by
A) the dollar amount that is paid for the good or service.
B) the dollar amount you can get by selling the good or service.
C) what you are willing to give up to obtain the good or service.
D) how strong the incentives were that lead to buying the good or service.
E) None of the above answers is correct because there is no way to measure the benefit you
receive from purchasing a good or service.
Skill: Level 1: Definition
Section: Checkpoint 1.2
Author: TS
AACSB: Reflective thinking
21) Suppose you take a trip during Spring Break. To determine the benefit of taking the trip, you
A) calculate the opportunity cost of the trip.
B) measure what you are willing to give up to take the trip.
C) determine the sunk cost of taking the trip.
D) calculate the value of the next best alternative foregone.
E) must measure what the trip is worth to you and then subtract the cost of the trip.
Skill: Level 1: Definition
Section: Checkpoint 1.2
Author: CD
AACSB: Reflective thinking

23
Copyright © 2011 Pearson Education, Inc.
22) The cost of a one-unit increase in an activity is called the
A) opportunity benefit.
B) sunk cost.
C) marginal cost.
D) marginal benefit.
E) margin.
Skill: Level 1: Definition
Section: Checkpoint 1.2
Author: JC
AACSB: Reflective thinking
23) The opportunity cost of a one-unit increase in an activity
A) is greater than the marginal benefit.
B) is called sunk cost.
C) decreases as you do more of it.
D) is called marginal cost.
E) is measured by what the person is willing to give up to get one more unit of the activity.
Skill: Level 1: Definition
Section: Checkpoint 1.2
Author: CD
AACSB: Reflective thinking
24) The marginal cost of an activity is a measure of ________ the activity.
A) what is forgone with every one unit increase in
B) the total cost of
C) the benefit derived from every one unit decrease in
D) the benefit derived from every one unit increase in
E) sunk cost of
Skill: Level 2: Using definitions
Section: Checkpoint 1.2
Author: PH
AACSB: Reflective thinking

24
Copyright © 2011 Pearson Education, Inc.
25) Mothers Against Drunk Drivers (MADD) campaigned to increase the legal penalties of
drunk driving. This successful campaign ________ of drunk driving.
A) increased the marginal benefit
B) decreased the marginal benefit
C) increased the marginal cost
D) decreased the marginal cost
E) increased the sunk cost
Skill: Level 2: Using definitions
Section: Checkpoint 1.2
Author: SB
AACSB: Reflective thinking
26) The marginal cost of an activity ________ as you do more of it.
A) increases
B) decreases
C) doesn’t change
D) changes only if the marginal benefit of the activity does not change
E) changes only if the marginal benefit of the activity changes
Skill: Level 1: Definition
Section: Checkpoint 1.2
Author: SB
AACSB: Reflective thinking
27) The benefit of a one-unit increase in an activity
A) is called marginal cost.
B) is always greater than the opportunity cost of that activity.
C) decreases as you do more of it.
D) is measured by what you must give up.
E) is called “sunk benefit.”
Skill: Level 1: Definition
Section: Checkpoint 1.2
Author: CD
AACSB: Reflective thinking

25
Copyright © 2011 Pearson Education, Inc.
28) Huey has eaten two hamburgers and is considering a third. The marginal benefit in his
decision is the pleasure from consuming
A) the two previous hamburgers.
B) all three hamburgers.
C) just the third hamburger.
D) just the second hamburger.
E) the third hamburger minus the pleasure from consuming zero hamburgers.
Skill: Level 2: Using definitions
Section: Checkpoint 1.2
Author: SB
AACSB: Analytical reasoning
29) What typically happens to benefits as the amount of an activity is increased?
A) Total benefits remain constant.
B) Marginal benefit increases.
C) Marginal benefit remains constant.
D) Marginal benefit decreases.
E) The marginal benefit changes only if the marginal cost changes.
Skill: Level 1: Definition
Section: Checkpoint 1.2
Author: TS
AACSB: Reflective thinking
30) Suppose you eat two hamburgers for lunch. The marginal benefit of the first burger is
________ of the second burger.
A) larger than the marginal benefit
B) smaller than the marginal benefit
C) equal to the marginal benefit
D) not related to the marginal benefit
E) equal to the marginal cost and the marginal benefit
Skill: Level 2: Using definitions
Section: Checkpoint 1.2
Author: SB
AACSB: Analytical reasoning

26
Copyright © 2011 Pearson Education, Inc.
31) A choice made by comparing all relevant alternatives systematically and incrementally is
A) an opportunity cost.
B) a choice on the margin.
C) a benefit.
D) a sunk cost.
E) a choice made in the social interest.
Skill: Level 1: Definition
Section: Checkpoint 1.2
Author: JC
AACSB: Reflective thinking
32) Making choices on the margin means
A) scribbling on the edges of your notebook paper.
B) comparing all relevant alternatives systematically and incrementally.
C) making a decision based on emotions.
D) making decisions in the largest possible increments.
E) taking account of all marginal benefits, all opportunity costs, and all sunk costs.
Skill: Level 1: Definition
Section: Checkpoint 1.2
Author: SB
AACSB: Reflective thinking
33) Decision making on the margin involves
A) comparing the marginal cost and marginal benefits when making a decision.
B) comparing the total cost and the total benefit when making a decision.
C) eliminating the additional cost when making a decision.
D) determining the total benefits of a decision.
E) comparing the benefits from the social interest to the benefits from the person’s self-interest.
Skill: Level 2: Using definitions
Section: Checkpoint 1.2
Author: PH
AACSB: Reflective thinking

27
Copyright © 2011 Pearson Education, Inc.
34) In making your decision whether to take a trip during Spring Break, you compare all the
other activities you could undertake. As a result, you
A) are making a choice on the margin.
B) incur a sunk cost.
C) are not making a rational choice.
D) do not face an opportunity cost.
E) must have made a choice in the social interest.
Skill: Level 2: Using definitions
Section: Checkpoint 1.2
Author: CD
AACSB: Reflective thinking
35) To make a rational choice, a person
A) compares the extra benefits of one more unit to the extra costs of one more unit.
B) adds the total benefits and the total costs and then compares the two totals.
C) adds the total benefits to determine if the total is large enough.
D) adds the total costs to determine if the total is small enough.
E) takes account of all benefits and all opportunity costs, including both marginal costs and sunk
costs.
Skill: Level 2: Using definitions
Section: Checkpoint 1.2
Author: TS
AACSB: Reflective thinking
36) In order to determine whether to major in economics, a rational individual compares the
________ of the decision.
A) marginal benefit and marginal cost
B) opportunity cost and the sunk cost
C) positive benefits and normative costs
D) normative benefits and positive costs
E) self-interest and social-interest
Skill: Level 2: Using definitions
Section: Checkpoint 1.4
Author: MR
AACSB: Reflective thinking

28
Copyright © 2011 Pearson Education, Inc.
37) In order to make a rational choice, people must
A) only know what they want.
B) be able to afford the choice decided upon.
C) decide quickly without wasting time.
D) compare marginal costs and marginal benefits.
E) determine what is in the social interest.
Skill: Level 2: Using definitions
Section: Checkpoint 1.2
Author: TS
AACSB: Reflective thinking
38) Instead of studying for an additional two hours for the economics final, Leann decides to
watch a movie. Leann is making
A) a decision that does not involve an opportunity cost.
B) a rational decision if her marginal cost from the movie is greater than her marginal benefit.
C) a rational decision if her marginal benefit from the movie is greater than her marginal cost.
D) an irrational decision because studying is more important than watching a movie.
E) a decision that is not on the margin because she will see the entire movie.
Skill: Level 2: Using definitions
Section: Checkpoint 1.2
Author: SA
AACSB: Reflective thinking
39) When Gabriel made a rational choice to spend his entire allowance on candy bars, he did so
by comparing the
A) benefits of the candy bars to the desires he had for the candy bars.
B) marginal benefits of the candy bars to the marginal costs of the candy bars.
C) opportunity costs of the candy bars to the scarcity of the candy bars.
D) benefits of the candy bars to the scarcity candy bars.
E) self-interest to the social interest.
Skill: Level 2: Using definitions
Section: Checkpoint 1.2
Author: JC
AACSB: Reflective thinking

29
Copyright © 2011 Pearson Education, Inc.
40) Going skiing will cost Adam $80 a day. He also loses $40 per day in wages because he has
to take time off from work. Adam still decides to go skiing.
A) His decision is rational if Adam’s marginal benefit of spending a day skiing is greater than his
marginal cost.
B) The $80 price of skiing is a sunk cost and so did not affect Adam’s decision.
C) He loses a total of $120 per day, so his decision is irrational.
D) Adam’s lost $40 per day in wages is a sunk cost and so did not affect his decision.
E) Adam is definitely making a decision that is in the social interest.
Skill: Level 1: Definition
Section: Checkpoint 1.2
Author: SA
AACSB: Reflective thinking
41) The decision to go to graduate school is a rational one for a college student if the
A) cost is not too great.
B) marginal cost exceeds the marginal benefit of graduate school.
C) marginal benefit of graduate school exceeds the marginal cost.
D) opportunity cost of graduate school equals zero.
E) student carefully compared the benefits of this decision to the sunk costs of the decision.
Skill: Level 1: Definition
Section: Checkpoint 1.3
Author: JC
AACSB: Reflective thinking
42) An incentive is
A) an inducement to take a particular action.
B) the marginal cost of some course of action.
C) the marginal benefit of some course of action.
D) the net gain of some course of action.
E) a constraint that society imposes on those who make self-interested choices.
Skill: Level 1: Definition
Section: Checkpoint 1.2
Author: JC
AACSB: Reflective thinking

30
Copyright © 2011 Pearson Education, Inc.
43) An incentive is
A) a reward or a penalty that encourages or discourages an action.
B) when people make rational choices by comparing costs and benefits.
C) what you must give up to get something.
D) a choice is made on the margin.
E) a good or service that satisfies wants.
Skill: Level 1: Definition
Section: Checkpoint 1.2
Author: KG
AACSB: Reflective thinking
44) A change in a marginal benefit or cost will
A) increase consumption.
B) decrease production.
C) cause an individual to make a rational choice.
D) increase sunk costs.
E) change incentives.
Skill: Level 2: Using definitions
Section: Checkpoint 1.2
Author: KG
AACSB: Reflective thinking
45) Proponents of cuts in income tax rates argue that when income tax rates are cut, workers
have an incentive to increase their work hours. This argument is based on the assumption that
A) workers are irrational.
B) workers make decisions based on the marginal benefit of each hour worked compared to the
marginal cost of work.
C) the opportunity cost of working is negative.
D) the marginal cost of each additional work hour is not important to most workers.
E) workers make decisions based on the social interest.
Skill: Level 2: Using definitions
Section: Checkpoint 1.2
Author: JC
AACSB: Reflective thinking

31
Copyright © 2011 Pearson Education, Inc.
46) Your economics professor offers 10 points extra credit if you attend a review session before
your next exam. This extra credit is an example of
A) a decrease in marginal benefit to attend the review session.
B) an increase in marginal cost to attend the review session.
C) a rational choice.
D) an incentive to attend the review session.
E) a sunk cost.
Skill: Level 2: Using definitions
Section: Checkpoint 1.2
Author: KG
AACSB: Reflective thinking
47) If the marginal benefit of getting a college degree rises, rational people will
A) attend college in greater numbers.
B) drop out of college.
C) not change their behavior.
D) require that college get easier.
E) raise the marginal cost of attending college.
Skill: Level 2: Using definitions
Section: Checkpoint 1.2
Author: SB
AACSB: Reflective thinking
48) The study of the choices of one individual or business is called
A) macroeconomics.
B) microeconomics.
C) scarcity.
D) finance.
E) ceteris paribus.
Skill: Level 1: Definition
Section: Checkpoint 1.1
Author: SB
AACSB: Reflective thinking

32
Copyright © 2011 Pearson Education, Inc.
49) Microeconomics includes the study of the
A) aggregate effects on the national economy.
B) recessions and inflation in the global economy.
C) choices made by individuals and businesses.
D) reasons why the government changes interest rates.
E) nationwide unemployment rate.
Skill: Level 1: Definition
Section: Checkpoint 1.2
Author: JC
AACSB: Reflective thinking
50) The primary focus of microeconomics is
A) to examine the operation of the entire (aggregate) economy.
B) to examine the behavior and operation of the individual units or sectors that make up the
economy.
C) our government’s monetary policy.
D) the levels of employment and inflation.
E) to study how we managed to eliminate scarcity.
Skill: Level 1: Definition
Section: Checkpoint 1.2
Author: PH
AACSB: Reflective thinking
51) Which of the following is a microeconomic issue?
A) The price of gasoline increases in the United States this year.
B) The Brazilian economy experiences rapid economic growth.
C) The unemployment rate soars in Spain.
D) Inflation skyrockets in Russia.
E) The U.S. government cuts taxes to combat a recession.
Skill: Level 2: Using definitions
Section: Checkpoint 1.2
Author: JC
AACSB: Reflective thinking

33
Copyright © 2011 Pearson Education, Inc.
52) Which of the following is a microeconomic issue?
A) Growth in the U.S. economy slowed.
B) Increased federal government expenditures have lowered the unemployment rate.
C) The inflation rate fell this year.
D) The quantity of wheat grown in the United States increases this year.
E) The U.S. government cuts taxes to combat a recession.
Skill: Level 2: Using definitions
Section: Checkpoint 1.2
Author: MR
AACSB: Reflective thinking
53) Which of the following is a microeconomic topic?
i. K-Mart’s decision to close stores that are not making a profit
ii. Home Depot’s choice to hire more full-time employees because its sales increased
iii. Delta Airlines changes its fares
A) i only.
B) ii only.
C) i and iii.
D) ii and iii.
E) i, ii, and iii.
Skill: Level 2: Using definitions
Section: Checkpoint 1.2
Author: CD
AACSB: Reflective thinking
54) Which of the following is a microeconomic topic?
A) Northwest Airlines analyzes the benefits of adding one more flight to Salt Lake City.
B) Unemployment soars as taxes increase.
C) The government leaves interest rates unchanged as the economy improves.
D) Germany’s government increases taxes to avoid a budget deficit.
E) Chinese economic growth slows.
Skill: Level 2: Using definitions
Section: Checkpoint 1.2
Author: CD
AACSB: Reflective thinking

34
Copyright © 2011 Pearson Education, Inc.
55) Macroeconomics is the study of
A) the actions of individual consumers.
B) national or global economies.
C) the actions of individual businesses.
D) the government.
E) how ceteris paribus affects causation.
Skill: Level 1: Definition
Section: Checkpoint 1.1
Author: SB
AACSB: Reflective thinking
56) Which of the following BEST describes macroeconomics?
A) It analyzes the aggregate effects on the national economy of the choices made by individuals,
firms, and governments.
B) It studies the choices that individuals and businesses make when coping with scarcity.
C) It examines how the choices that individuals affect governments.
D) It never uses the ceteris paribus assumption.
E) Proving causation is never a problem for macroeconomics.
Skill: Level 1: Definition
Section: Checkpoint 1.1
Author: TS
AACSB: Reflective thinking
57) Which of the following is a topic studied in macroeconomics?
A) The pricing decisions in the computer hardware industry
B) The effect on economic growth if the government raises taxes
C) How the wheat industry determines how much wheat to grow
D) The impact of labor unions on wages
E) The impact of higher prices for gasoline on the number of SUVs people buy
Skill: Level 2: Using definitions
Section: Checkpoint 1.2
Author: PH
AACSB: Reflective thinking

35
Copyright © 2011 Pearson Education, Inc.
58) Which of the following is a macroeconomic topic?
A) The federal government’s decision to spend more on environmental protection
B) The county government’s decision to increase the sales tax for your county
C) Why did production and jobs expand rapidly in 2004?
D) General Motors decides what prices to set for their new models.
E) The effect of floods in the growing areas on the price and quantity of wheat.
Skill: Level 2: Using definitions
Section: Checkpoint 1.2
Author: CD
AACSB: Reflective thinking
59) Which of the following is a macroeconomic topic?
A) The growth of the amount of money that Americans are borrowing from the rest of the world.
B) The government’s choice to sue Microsoft for acting like a monopoly
C) How your local phone company decides to set its fee structure
D) How you decide whether to take out a loan to finance your college education
E) Whether Honda will make more gasoline powered cars or more hybrid powered cars
Skill: Level 2: Using definitions
Section: Checkpoint 1.2
Author: CD
AACSB: Reflective thinking
60) Which of the following is a macroeconomic issue?
A) The price of a ticket to Walt Disney World in Orlando is increased.
B) The National Football League signs a new television contract.
C) The number of jobs and production in Zimbabwe increase.
D) The Iowa corn harvest is smaller than normal.
E) Utilities are required to install more anti-pollution devices.
Skill: Level 2: Using definitions
Section: Checkpoint 1.2
Author: JC
AACSB: Reflective thinking

36
Copyright © 2011 Pearson Education, Inc.
61) A positive statement
i. makes a statement about how the world operates.
ii. is a true statement.
iii. can be tested against the facts.
A) i and ii
B) i and iii
C) ii and iii
D) i, ii and iii
E) i only
Skill: Level 1: Definition
Section: Checkpoint 1.2
Author: CD
AACSB: Reflective thinking
62) Which of the following is a positive statement?
A) An increase in college tuition is not fair to students.
B) A recession leads to higher enrollments at universities.
C) University bookstore prices are too high.
D) Parking tickets on campus impose an excessive fee.
E) The school needs more parking for students.
Skill: Level 2: Using definitions
Section: Checkpoint 1.2
Author: CD
AACSB: Reflective thinking
63) The statement that “increases in the tax on gasoline increase the price of gasoline” is an
example of a
A) normative statement.
B) positive statement.
C) macroeconomic statement.
D) ceteris paribus statement.
E) marginal statement.
Skill: Level 2: Using definitions
Section: Checkpoint 1.2
Author: JC
AACSB: Reflective thinking

37
Copyright © 2011 Pearson Education, Inc.
64) “Lower ticket prices would lead to more people attending ballgames.” This statement is a
A) ceteris paribus assertion.
B) normative statement.
C) positive statement.
D) macroeconomic statement.
E) statement that confuses marginal cost and sunk cost.
Skill: Level 2: Using definitions
Section: Checkpoint 1.2
Author: SA
AACSB: Reflective thinking
65) A statement that argues that “if taxes on gasoline increase, gasoline consumption will
decrease” is an example of what kind of statement?
A) a marginal statement
B) a macroeconomic statement
C) a normative statement
D) a positive statement
E) a statement that violates rational choice
Skill: Level 2: Using definitions
Section: Checkpoint 1.2
Author: JC
AACSB: Reflective thinking
66) Which of the following statements is a positive statement?
A) Our country must increase military spending.
B) There should be a computer in every elementary school classroom.
C) We need to spend less on luxury items for the wealthy, and more on necessities for the less
fortunate.
D) Online shopping increased by 50 percent this Christmas season.
E) Too many people are unemployed.
Skill: Level 2: Using definitions
Section: Checkpoint 1.2
Author: PH
AACSB: Reflective thinking

38
Copyright © 2011 Pearson Education, Inc.
67) Which of the following is a positive statement?
A) The rich should pay more in taxes.
B) Everyone should have some knowledge of economics.
C) Taxes on gasoline should be lower so that gasoline is more affordable to the poor.
D) If we reduce welfare payments given to the poor, they will find jobs.
E) social Security must be reformed.
Skill: Level 2: Using definitions
Section: Checkpoint 1.2
Author: SA
AACSB: Reflective thinking
68) Normative statements
i. describe how the world is.
ii. describe how the world ought to be.
iii. depend on people’s values and cannot be tested.
A) i only.
B) ii only.
C) iii only.
D) ii and iii.
E) i and iii.
Skill: Level 1: Definition
Section: Checkpoint 1.2
Author: SA
AACSB: Reflective thinking
69) A normative statement
A) depends on someone’s values.
B) cannot use the word “should.”
C) says what is currently believed about the way the world operates.
D) must be tested to determine if it is correct.
E) can be tested to determine if it is correct.
Skill: Level 1: Definition
Section: Checkpoint 1.2
Author: SA
AACSB: Reflective thinking

39
Copyright © 2011 Pearson Education, Inc.
70) The important characteristic of normative statements is that they
A) explain what really exists.
B) are based on somebody’s values and cannot be tested.
C) explain what normally happens in the real world.
D) help guide us to what will normally occur if some economic variable changes its value.
E) do not use the ceteris paribus assumption.
Skill: Level 2: Using definitions
Section: Checkpoint 1.2
Author: TS
AACSB: Reflective thinking
71) A normative statement
i. can be tested as to whether it is true or false.
ii. is considered negative.
iii. depends on a person’s values.
A) i only
B) iii only
C) i and iii
D) ii and iii
E) i, ii, and iii
Skill: Level 1: Definition
Section: Checkpoint 1.2
Author: CD
AACSB: Reflective thinking
72) Which of the following is a normative statement?
A) Flood victims should pay for their own rebuilding.
B) When the price of kiwi fruit increases, fewer people eat kiwi fruit.
C) An increase in the supply of computers has caused computer prices to fall.
D) Recessions lead to increases in the unemployment rate.
E) Hurricanes strike mainly Florida and North Carolina.
Skill: Level 2: Using definitions
Section: Checkpoint 1.2
Author: JC
AACSB: Reflective thinking
40
Copyright © 2011 Pearson Education, Inc.
73) A statement that “All children should receive free health care” is an example of what kind of
statement?
A) a fair statement
B) a natural experiment statement
C) a normative statement
D) a positive statement
E) a statement on the margin
Skill: Level 2: Using definitions
Section: Checkpoint 1.2
Author: JC
AACSB: Reflective thinking
74) Which of the following statements is a normative statement?
A) Inflation has been at an all time low this year.
B) The minimum wage should be increased to $8.50 per hour.
C) Unemployment this month has increased by less than 0.5 percentage point..
D) Additional spending on education has not produced any rise in test scores.
E) Pepsi is less expensive than Coke this week.
Skill: Level 2: Using definitions
Section: Checkpoint 1.2
Author: PH
AACSB: Reflective thinking
75) Which of the following statements is a normative statement?
A) Every American household should have health care insurance coverage.
B) Military spending as a percent of government spending decreased by 5 percent in the 1990s.
C) Welfare reform has decreased the amount the government spends on welfare.
D) The price of computers fell last year.
E) Fewer people are unemployed this year than last year.
Skill: Level 2: Using definitions
Section: Checkpoint 1.2
Author: PH
AACSB: Reflective thinking
41
Copyright © 2011 Pearson Education, Inc.
76) The Latin phrase ceteris paribus is best defined as
A) the rational choice is made.
B) benefits are greater than the costs.
C) other things remaining the same.
D) the tendency for the values of two variables to move together in a predictable and related
way.
E) the study of choice.
Skill: Level 1: Definition
Section: Checkpoint 1.2
Author: KG
AACSB: Reflective thinking
77) The Latin phrase ceteris paribus means
A) let the buyer beware.
B) other things remaining the same.
C) positive, not normative.
D) normative, not positive.
E) on the margin.
Skill: Level 1: Definition
Section: Checkpoint 1.2
Author: JC
AACSB: Reflective thinking
78) Ceteris paribus means
A) variables are correlated.
B) after this, therefore because of this.
C) people must make choices.
D) other things remaining the same.
E) social interest is the same as self interest.
Skill: Level 1: Definition
Section: Checkpoint 1.2
Author: SB
AACSB: Reflective thinking
42
Copyright © 2011 Pearson Education, Inc.
79) Which of the following is an example of ceteris paribus?
A) varying both temperature and the amount of rain to decide how hardy a new plant is
B) holding caloric intake the same as you decide how exercising affects your weight
C) allowing the dosages to change as you investigate how two new drugs compare
D) varying both the options available and the price of PCs to investigate what has happened to
the demand for PCs
E) assuming that correlation does not mean causation
Skill: Level 2: Using definitions
Section: Checkpoint 1.2
Author: CD
AACSB: Analytical reasoning
80) Economists try to isolate the effect of one variable at a time. They do so by
A) holding all other relevant factors the same.
B) imagining a real world.
C) assuming that every economic variable changes simultaneously.
D) keeping all variables constant.
E) looking only at decisions made on the margin.
Skill: Level 2: Using definitions
Section: Checkpoint 1.2
Author: SA
AACSB: Analytical reasoning
81) “If the price of home heating oil rises, ceteris paribus, people will buy less home heating
oil.” This statement is equivalent to which of the following?
A) The relationship between the price of home heating oil and the amount of oil households
purchased are independent of each other.
B) If the price of home heating oil rises and every thing else remains constant, the amount of
home heating oil households purchase will decrease.
C) As the prices for all products including home heating oil rise, people buy less home heating
oil.
D) Because the only way to heat a home is with oil, if the price increases, then households will
purchase less.
E) No matter what else changes, if the price of home heating oil rises, people will buy less home
heating oil.
Skill: Level 3: Using models
Section: Checkpoint 1.2
Author: PH
AACSB: Analytical reasoning
43
Copyright © 2011 Pearson Education, Inc.
82) Correlation means
A) “after this, therefore because of this.”
B) other things remaining the same.
C) a natural experiment has been conducted.
D) the tendency for the values of two variables to move in a predictable and related way.
E) “on the margin.”
Skill: Level 1: Definition
Section: Checkpoint 1.2
Author: CD
AACSB: Reflective thinking
83) Correlation means
A) holding everything else constant.
B) after this, therefore because of this.
C) the values of two variables move in a predictable and related way.
D) making statements about how the world should be.
E) the same as causation.
Skill: Level 1: Definition
Section: Checkpoint 1.2
Author: SB
AACSB: Reflective thinking
84) The tendency for the values of two variables to move together in a predictable and related
way is
A) ceteris paribus.
B) correlation.
C) part of rational choice.
D) related to marginal cost.
E) an example of thinking on the margin.
Skill: Level 1: Definition
Section: Checkpoint 1.2
Author: KG
AACSB: Reflective thinking
44
Copyright © 2011 Pearson Education, Inc.
85) In examining two variables, we find that as one variable changes, the other changes. These
variables are said to be
A) independent.
B) correlated.
C) statistics.
D) ceteris paribus related.
E) casually related.
Skill: Level 2: Using definitions
Section: Checkpoint 1.2
Author: PH
AACSB: Reflective thinking
86) When economists use the term “correlation,” they are referring to
A) cause and effect relationships between variables.
B) how two variables move together in a predictable way.
C) positive economics.
D) normative economics.
E) economic policy.
Skill: Level 2: Using definitions
Section: Checkpoint 1.2
Author: PH
AACSB: Reflective thinking
87) The tendency for the values of two variables to move in a predictable and related way is
known as
A) a natural experiment.
B) a normative relationship.
C) ceteris paribus.
D) correlation.
E) a policy relationship.
Skill: Level 1: Definition
Section: Checkpoint 1.2
Author: JC
AACSB: Reflective thinking
45
Copyright © 2011 Pearson Education, Inc.
88) Opportunity cost is best defined as
A) how much money is paid for something.
B) how much money and time it takes to consume something.
C) the value of the highest-valued alternative that is forgone in making a choice.
D) the total of all other alternatives that are forgone in making a choice.
E) the sunk cost of any decision.
Skill: Level 1: Definition
Section: Checkpoint 1.2
Author: MyEconLab Web Site
AACSB: Reflective thinking
89) John has two hours of free time this evening. He ranked his alternatives, first go to a concert,
second go to a movie, third study for an economics exam, and fourth answer his e-mail. What is
the opportunity cost of attending the concert for John?
A) attending a movie
B) studying for an economics exam
C) answering his e-mail
D) attending a movie, studying for an economics exam, and answering his e-mail
E) going to the concert because that is what John choose to do.
Skill: Level 2: Using definitions
Section: Checkpoint 1.2
Author: MyEconLab Web Site
AACSB: Analytical reasoning
90) Jamie has enough money to buy either a Mountain Dew, or a Pepsi, or a bag of chips. He
chooses to buy the Mountain Dew. The opportunity cost of the Mountain Dew is
A) the Pepsi and the bag of chips.
B) the Pepsi or the bag of chips, whichever the highest-valued alternative forgone.
C) the Mountain Dew.
D) the Pepsi because it is a drink, as is the Mountain Dew.
E) zero because he enjoys the Mountain Dew.
Skill: Level 2: Using definitions
Section: Checkpoint 1.2
Author: STUDY GUIDE
AACSB: Analytical reasoning
46
Copyright © 2011 Pearson Education, Inc.
91) Amy can study for an hour or spend that hour sleeping or going out for dinner. If she decides
to study for the hour, the opportunity cost of the hour spent studying is
A) definitely going to sleep.
B) studying since this is the choice she opted for.
C) sleeping or going out for dinner, whichever she would have preferred the most.
D) sleeping and going out for dinner.
E) definitely going out to dinner because she must eat at some time.
Skill: Level 2: Using definitions
Section: Checkpoint 1.2
Author: MyEconLab Web Site
AACSB: Analytical reasoning
92) If there is no scarcity,
A) the opportunity cost of an action would be greater than its sunk cost.
B) an action would have zero opportunity cost.
C) choices are no longer rational.
D) marginal cost of an action is greater than its marginal benefit.
E) all marginal benefits would equal zero.
Skill: Level 3: Using models
Section: Checkpoint 1.2
Author: MyEconLab Web Site
AACSB: Analytical reasoning
93) The benefit of an activity is
A) purely objective and measured in dollars.
B) the gain or pleasure that it brings.
C) the value of its sunk cost.
D) measured by what must be given up to get one more unit of the activity.
E) not measurable on the margin.
Skill: Level 1: Definition
Section: Checkpoint 1.2
Author: STUDY GUIDE
AACSB: Reflective thinking
47
Copyright © 2011 Pearson Education, Inc.
94) The ________ of something is the gain or pleasure that it brings.
A) opportunity cost
B) benefit
C) marginal cost
D) rational choice
E) rational margin
Skill: Level 1: Definition
Section: Checkpoint 1.2
Author: MyEconLab Web Site
AACSB: Reflective thinking
95) The cost of a one-unit increase in an activity
A) is called the total one-unit cost.
B) is called the marginal cost.
C) decreases as more of the activity is done.
D) is called the marginal benefit/cost.
E) is called the sunk cost.
Skill: Level 1: Definition
Section: Checkpoint 1.2
Author: STUDY GUIDE
AACSB: Reflective thinking
96) The marginal benefit of an activity is
i. the benefit from a one-unit increase in the activity
ii. the benefit of a small, unimportant activity.
iii. measured by what the person is willing to give up to get one additional unit of the activity.
A) i only
B) ii only
C) iii only
D) i and iii
E) ii and iii
Skill: Level 1: Definition
Section: Checkpoint 1.2
Author: STUDY GUIDE
AACSB: Reflective thinking
48
Copyright © 2011 Pearson Education, Inc.
97) The additional benefit of increasing some activity by one-unit is called the
A) marginal benefit.
B) opportunity cost.
C) total benefit.
D) scarcity.
E) sunk benefit.
Skill: Level 1: Definition
Section: Checkpoint 1.2
Author: MyEconLab Web Site
AACSB: Reflective thinking
98) If the marginal benefit of the next slice of pizza exceeds the marginal cost, you will
A) eat the slice of pizza.
B) not eat the slice of pizza.
C) be unable to choose between eating or not eating.
D) eat half the slice.
E) More information is needed about how much the marginal benefit exceeds the marginal cost
to determine if you will or will not eat the slice.
Skill: Level 2: Using definitions
Section: Checkpoint 1.2
Author: STUDY GUIDE
AACSB: Reflective thinking
99) When people make rational choices, they
A) behave selfishly.
B) do not consider their emotions.
C) weigh the costs and benefits of their options and act to satisfy their wants.
D) necessarily make a decision in the social interest.
E) are necessarily making the best decision.
Skill: Level 1: Definition
Section: Checkpoint 1.2
Author: STUDY GUIDE
AACSB: Reflective thinking
49
Copyright © 2011 Pearson Education, Inc.
100) By donating $1,000 to the Salvation Army, Caroline reduces her taxable income. To
Caroline, the reduction in her taxable income is
A) a marginal benefit.
B) an opportunity cost.
C) an incentive.
D) a marginal cost.
E) the margin.
Skill: Level 2: Using definitions
Section: Checkpoint 1.2
Author: MyEconLab Web Site
AACSB: Reflective thinking
101) Which of the following is a microeconomic issue?
A) Why has unemployment risen nationwide?
B) Why has economic growth been rapid in China?
C) What is the impact on the quantity of Pepsi purchased if consumers’ tastes change in favor of
non-carbonated drinks?
D) Why is the average income lower in Africa than in Latin America?
E) Why did overall production increase within the United States last year?
Skill: Level 1: Definition
Section: Checkpoint 1.2
Author: STUDY GUIDE
AACSB: Reflective thinking
102) Microeconomics includes the study of
A) how countries decide to fund their budget deficits.
B) the choices that individuals and businesses make.
C) how a nation promotes economic growth.
D) the effect on the national economy of the choices that individuals make.
E) the overall amount of production within the economy.
Skill: Level 1: Definition
Section: Checkpoint 1.2
Author: MyEconLab Web Site
AACSB: Reflective thinking
50
Copyright © 2011 Pearson Education, Inc.
103) A positive statement
A) must always be right.
B) cannot be tested.
C) might be right or wrong.
D) depends on someone’s value judgment.
E) cannot be negative.
Skill: Level 1: Definition
Section: Checkpoint 1.2
Author: STUDY GUIDE
AACSB: Reflective thinking
104) Which of the following is a positive statement?
A) Taxes should be lower because then people get to keep more of what they earn, so they will
work more.
B) My economics class should last for two terms because it is my favorite class.
C) A 10 percent increase in income leads to a 4 percent increase in the consumption of beef.
D) Given their negative impact on productivity, the government should eliminate labor unions.
E) The class average on this test should be more than 80 percent.
Skill: Level 2: Using definitions
Section: Checkpoint 1.2
Author: MyEconLab Web Site
AACSB: Reflective thinking
105) Which of the following is NOT a normative economic statement?
A) States should reduce the tax on heating fuel oil during the winter.
B) People over the age of 75 should not be allowed to drive cars.
C) Teenagers are responsible for most driving fatalities.
D) We don’t spend enough money on anti-smoking campaigns.
E) The price of gasoline is too high.
Skill: Level 2: Using definitions
Section: Checkpoint 1.2
Author: MyEconLab Web Site
AACSB: Reflective thinking
51
Copyright © 2011 Pearson Education, Inc.
106) Which of the following is an example of a normative statement?
A) If cars become more expensive, fewer people will buy them.
B) Car prices should be affordable.
C) If wages increase, firms will fire some workers.
D) Fewer people die in larger cars than in smaller cars.
E) Cars emit pollution.
Skill: Level 2: Using definitions
Section: Checkpoint 1.2
Author: STUDY GUIDE
AACSB: Reflective thinking
107) Which of the following statements is the best example of the term ceteris paribus?
A) An economist holds other factors constant when he examines the relationship between tax
rates and tax revenues.
B) More money should be spent on cleaning up the environment.
C) The government budget surplus was $200 billion in 2000 because the economy was growing.
D) An increase in the budget surplus after an increase in tax rates implies that tax rate increases
cause budget surpluses.
E) When studying the effects of a budget deficit, an economist must take account of all the
factors involved.
Skill: Level 3: Using models
Section: Checkpoint 1.2
Author: MyEconLab Web Site
AACSB: Reflective thinking
108) The Latin term “ceteris paribus“ means
A) “false unless proven true.”
B) “other things remaining the same.”
C) “after this, therefore because of this.”
D) “what is true of the whole is not necessarily true of the parts.”
E) “obviously true.”
Skill: Level 1: Definition
Section: Checkpoint 1.2
Author: MyEconLab Web Site
AACSB: Reflective thinking
52
Copyright © 2011 Pearson Education, Inc.
109) The Latin term ceteris paribus means
A) after this, therefore because of this.
B) other things being equal.
C) what is correct for the part, is not correct for the whole.
D) on the margin.
E) when one variable increases, the other variable decreases.
Skill: Level 1: Definition
Section: Checkpoint 1.2
Author: STUDY GUIDE
AACSB: Reflective thinking
110) When the Dallas Cowboys score more than 30 points in a game, they win the game. This is
an example of
A) an economic theory.
B) a correlation.
C) ceteris paribus.
D) a normative statement.
E) a statement on the margin.
Skill: Level 2: Using definitions
Section: Checkpoint 1.2
Author: MyEconLab Web Site
AACSB: Reflective thinking
1.3 Appendix
1) The horizontal axis in a graph
A) measures time on a scatter diagram.
B) measures the quality of a variable.
C) is named the y-axis.
D) is named the x-axis.
E) is called the origin.
Skill: Level 1: Definition
Section: Chapter 1 Appendix – Checkpoint 1
Author: MR
AACSB: Analytical reasoning

53
Copyright © 2011 Pearson Education, Inc.
2) Most economic graphs have two lines perpendicular to each other. The vertical line is called
the
A) origin.
B) y-axis.
C) x-axis.
D) variable.
E) time axis.
Skill: Level 1: Definition
Section: Chapter 1 Appendix – Checkpoint 1
Author: SB
AACSB: Analytical reasoning
3) The vertical axis in a graph
A) is named the y-axis.
B) is named the x-axis.
C) measures time in a cross-section and time series graph.
D) has no origin.
E) measures time only in a time series graph.
Skill: Level 1: Definition
Section: Chapter 1 Appendix – Checkpoint 1
Author: MR
AACSB: Analytical reasoning
4) Most economic graphs have two lines perpendicular to each other. Where these lines met is
called the
A) origin.
B) y-axis.
C) x-axis.
D) variable.
E) point of beginning.
Skill: Level 1: Definition
Section: Chapter 1 Appendix – Checkpoint 1
Author: MR
AACSB: Analytical reasoning
54
Copyright © 2011 Pearson Education, Inc.
5) A graph of the value of one variable against the value of another variable is known as a
A) two-dimensional graph.
B) three-dimensional graph.
C) time-series graph.
D) scatter diagram.
E) two-variable graph.
Skill: Level 1: Definition
Section: Chapter 1 Appendix – Checkpoint 1
Author: JC
AACSB: Analytical reasoning
6) A scatter diagram can be used to see
A) if the value of a variable is rising or falling.
B) the value of a variable for different groups in a population.
C) if a relationship exists between two variables.
D) how a variable behaves over time.
E) whether a variable is positively or negatively related to itself.
Skill: Level 1: Definition
Section: Chapter 1 Appendix – Checkpoint 1
Author: SB
AACSB: Analytical reasoning
7) To show how a variable ________, we typically use a ________.
A) relates to another variable; time series graph
B) relates to another variable; pie chart
C) changes over time; time series graph
D) changes over time; cross section graph
E) changes over time; cross time chart
Skill: Level 1: Definition
Section: Chapter 1 Appendix – Checkpoint 1
Author: MR
AACSB: Analytical reasoning
55
Copyright © 2011 Pearson Education, Inc.
8) Which type of graph is most useful in determining if two variables are correlated?
A) time-series
B) scatter diagram
C) cross-section
D) variable-correlation figure
E) None of the above answers is correct.
Skill: Level 1: Definition
Section: Chapter 1 Appendix – Checkpoint 1
Author: MR
AACSB: Analytical reasoning
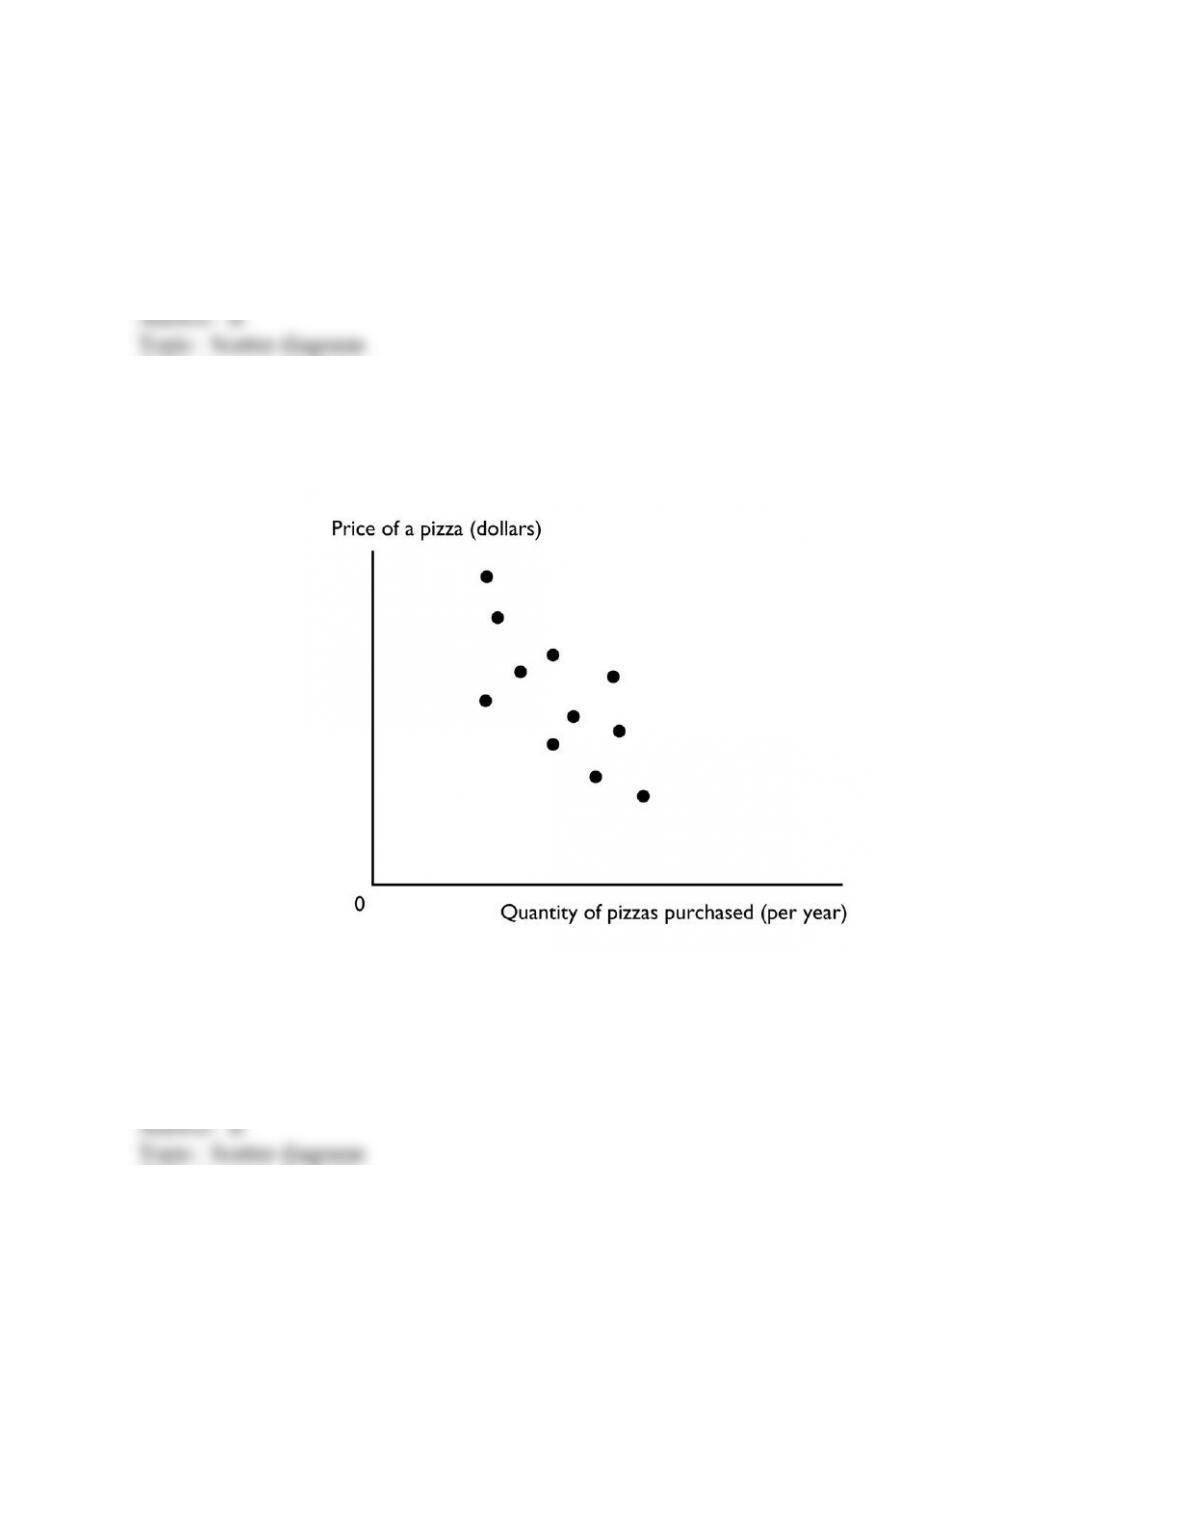
9) The figure above shows a
A) time-series graph.
B) scatter diagram.
C) cross-section graph.
D) slope.
E) trend diagram
Skill: Level 1: Definition
Section: Chapter 1 Appendix – Checkpoint 1
Author: SB
AACSB: Analytical reasoning
56
Copyright © 2011 Pearson Education, Inc.
10) A time-series graph measures
A) the value of one variable against the value of another variable.
B) the value of an economic variable for different groups in a population at a point in time.
C) time on the x-axis and the variable or variables in which we are interested on the y-axis.
D) time on the y-axis and the variable or variables in which we are interested on the x-axis.
E) time on both the x-axis and y-axis and the variable or variables in which we are interested in
the rest of the figure.
Skill: Level 1: Definition
Section: Chapter 1 Appendix – Checkpoint 1
Author: JC
AACSB: Analytical reasoning
11) A time series graph
A) shows how a variable changes over time.
B) uses bars rather than lines.
C) shows points in a scatter diagram.
D) is similar to a cross-section graph because both can show trends over time.
E) is in the shape of a pie.
Skill: Level 1: Definition
Section: Chapter 1 Appendix – Checkpoint 1
Author: SA
AACSB: Analytical reasoning
12) A steep slope in a time series graph means the variable is
A) high.
B) falling.
C) rising or falling quickly.
D) rising or falling slowly.
E) very close to its trend point.
Skill: Level 1: Definition
Section: Chapter 1 Appendix – Checkpoint 1
Author: SB
AACSB: Analytical reasoning
57
Copyright © 2011 Pearson Education, Inc.
13) Which type of economic graph reveals trends in data?
A) cross-section graph
B) time-series graph
C) scatter diagram
D) slopes
E) Answers A, B, and C are all correct.
Skill: Level 1: Definition
Section: Chapter 1 Appendix – Checkpoint 1
Author: SB
AACSB: Analytical reasoning
14) A time series graph
A) shows how a certain variable changes over time.
B) uses bars rather than lines.
C) shows points that are scattered.
D) depicts a series of good economic times a nation had.
E) is not useful if the goal is to determine a variable’s trend.
Skill: Level 1: Definition
Section: Chapter 1 Appendix – Checkpoint 1
Author: SA
AACSB: Analytical reasoning
15) A time-series graph displays the price of gold. The slope of the line is negative for periods
when the
A) price of gold is falling.
B) price of gold is rising.
C) quantity of gold is falling.
D) price of gold is low and not changing.
E) price of gold fluctuates.
Skill: Level 3: Using models
Section: Chapter 1 Appendix – Checkpoint 1
Author: MR
AACSB: Analytical reasoning
58
Copyright © 2011 Pearson Education, Inc.
16) A graph shows the wages of factory workers. The slope of the line is positive for periods
when the wage is
A) falling.
B) rising.
C) high and not changing.
D) low and falling.
E) high and falling.
Skill: Level 3: Using models
Section: Chapter 1 Appendix – Checkpoint 1
Author: MR
AACSB: Analytical reasoning
17) A trend is
A) a measure of closeness on a scatter diagram.
B) a general tendency for a variable to rise or fall.
C) the maximum value of a variable.
D) the minimum value of a variable.
E) the difference between the maximum value of a variable and the minimum value of the
variable.
Skill: Level 1: Definition
Section: Chapter 1 Appendix – Checkpoint 1
Author: MR
AACSB: Analytical reasoning
18) A time series graph reveals whether there is a ________ , which represents ________.
A) trend in a variable; a general tendency for the variable to rise or fall
B) relationship between two variables; a cross-section relationship
C) trends in two variables; unrelated variables
D) relationship between two variables; a trend in a variable
E) cross-section relationship; a general tendency for the variables to rise or fall
Skill: Level 1: Definition
Section: Chapter 1 Appendix – Checkpoint 1
Author: MR
AACSB: Analytical reasoning
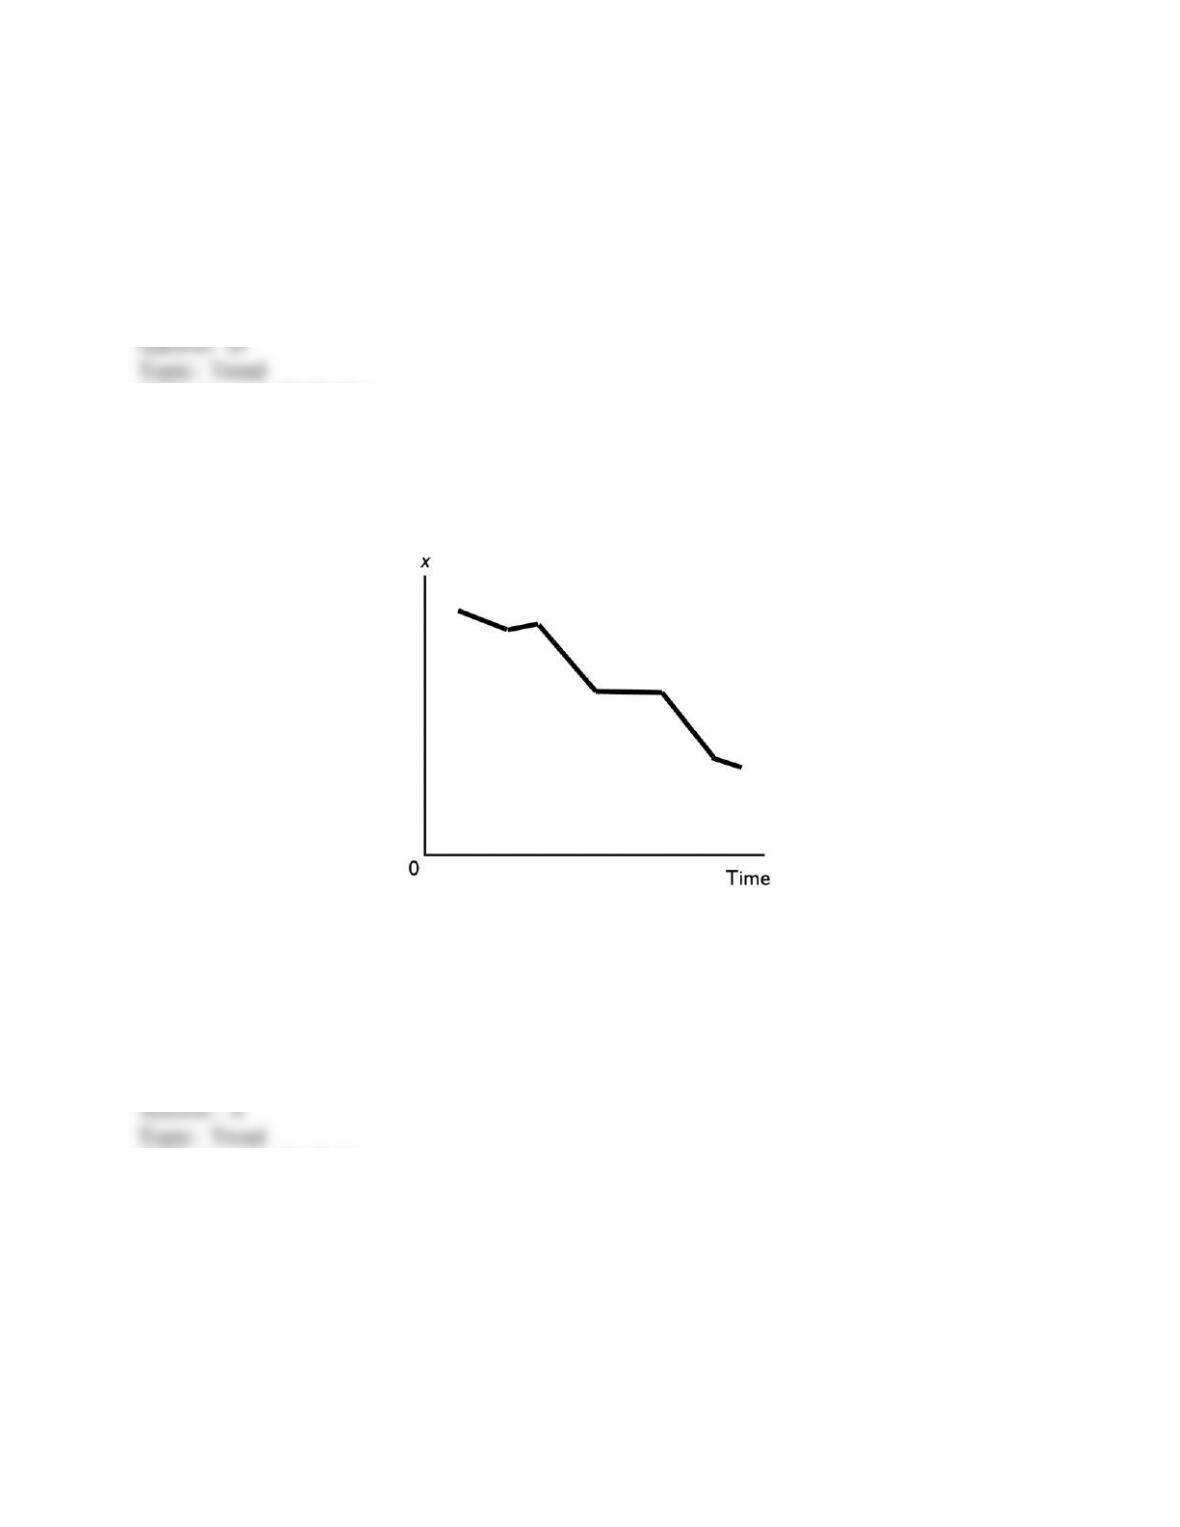
59
Copyright © 2011 Pearson Education, Inc.
19) Trend refers to
A) the scale used on the x– and y-axes.
B) increases but not decreases of a variable.
C) decreases but not increases of a variable.
D) a general tendency for a variable to rise or fall.
E) the difference between the maximum value of the variable and the minimum value of the
variable.
Skill: Level 1: Definition
Section: Chapter 1 Appendix – Checkpoint 1
Author: MR
AACSB: Analytical reasoning
20) In the above figure, the diagram shows
A) a downward trend in x.
B) an upward trend in x.
C) a scatter diagram.
D) a two-variable scatter diagram.
E) a cross-section graph between x and time.
Skill: Level 1: Definition
Section: Chapter 1 Appendix – Checkpoint 1
Author: MR
AACSB: Analytical reasoning
60
Copyright © 2011 Pearson Education, Inc.
21) A cross-section graph
A) is divided into different sections.
B) shows the values of an economic variable for different groups in a population at a point in
time.
C) measures time on the x-axis and the variable in which we are interested on the y-axis.
D) Both answers A and C are correct.
E) Both answers A and B are correct.
Skill: Level 1: Definition
Section: Chapter 1 Appendix – Checkpoint 1
Author: SA
AACSB: Analytical reasoning
22) A graph that shows the value of an economic variable for different groups in a population at
a given time is called a
A) scatter diagram.
B) times-series graph.
C) pie chart.
D) cross-section graph.
E) fixed-time diagram.
Skill: Level 1: Definition
Section: Chapter 1 Appendix – Checkpoint 1
Author: PH
AACSB: Analytical reasoning
23) A graph shows the average wage of various demographic groups in 2005. The kind of graph
used to show these data would be a
A) scatter diagram.
B) time-series graph.
C) cross-section graph.
D) Venn-diagram.
E) fixed-year figure.
Skill: Level 3: Using models
Section: Chapter 1 Appendix – Checkpoint 1
Author: MR
AACSB: Analytical reasoning
61
Copyright © 2011 Pearson Education, Inc.
24) A graph showing the values of an economic variable for different groups in a population at a
point in time is called a
A) cross-section graph.
B) time-series graph.
C) scatter diagram.
D) Venn diagram.
E) None of the above answers is correct.
Skill: Level 1: Definition
Section: Chapter 1 Appendix – Checkpoint 1
Author: SB
AACSB: Analytical reasoning
25) ________ shows the values of a variable for different groups in the population at a certain
point in time.
A) A time-series graph
B) The origin
C) A cross-section graph
D) A scatter plot
E) A trend-line graph
Skill: Level 1: Definition
Section: Chapter 1 Appendix – Checkpoint 1
Author: MR
AACSB: Analytical reasoning
26) A cross-section graph
A) is divided into different sections.
B) shows values of an economic variable for different groups in a population at a point in time.
C) measures time on the x-axis and the variable in which we are interested on the y-axis.
D) Both answers A and C are correct.
E) Both answers B and C are correct.
Skill: Level 1: Definition
Section: Chapter 1 Appendix – Checkpoint 1
Author: SA
AACSB: Analytical reasoning
62
Copyright © 2011 Pearson Education, Inc.
27) You have data for the amount of rainfall in 50 cities for the month of June. The type of graph
to best display these data would be a
A) time-series graph.
B) multi-variable time series graph.
C) cross-section graph.
D) scatter diagram.
E) trend-line diagram.
Skill: Level 3: Using models
Section: Chapter 1 Appendix – Checkpoint 1
Author: MR
AACSB: Analytical reasoning
28) You have data for sales of pizza for each of the 50 states in 2010. The type of graph to best
display these data would be a
A) cross-section graph.
B) time-series graph.
C) scatter diagram.
D) multi-variable time-series graph.
E) a trend-line diagram.
Skill: Level 3: Using models
Section: Chapter 1 Appendix – Checkpoint 1
Author: MR
AACSB: Analytical reasoning
29) A graph shows the average SAT scores for males and females in 2010. The kind of graph
used to show these data would be a
A) scatter diagram.
B) time-series graph.
C) cross-section graph.
D) time-stationary graph.
E) trend figure.
Skill: Level 3: Using models
Section: Chapter 1 Appendix – Checkpoint 1
Author: MR
AACSB: Analytical reasoning
63
Copyright © 2011 Pearson Education, Inc.
30) Demonstrating how an economic variable changes from one year to the next is best
illustrated by a
A) scatter diagram.
B) time-series graph.
C) linear graph.
D) cross-section graph.
E) Venn diagram.
Skill: Level 1: Definition
Section: Chapter 1 Appendix – Checkpoint 1
Author: STUDY GUIDE
AACSB: Analytical reasoning
31) To show the values of an economic variable for different groups in a population at a point in
time, it is best to use a
A) scatter diagram.
B) time-series graph.
C) linear graph.
D) cross-section graph
E) trend-section diagram.
Skill: Level 1: Definition
Section: Chapter 1 Appendix – Checkpoint 1
Author: STUDY GUIDE
AACSB: Analytical reasoning
32) A graph that shows how the amount of advertising expenditure differs among various
industries can be shown
A) by a cross-section graph.
B) by a time-series graph.
C) as a trend.
D) by a scatter diagram.
E) by a trend-section graph.
Skill: Level 3: Using models
Section: Chapter 1 Appendix – Checkpoint 1
Author: MyEconLab Web Site
AACSB: Analytical reasoning
64
Copyright © 2011 Pearson Education, Inc.
33) A linear relationship
A) when graphed is a straight line.
B) when graphed is a line whose slope changes.
C) can be a positive or a negative relationship.
D) Both answers A and C are correct.
E) Both answers A and B are correct.
Skill: Level 1: Definition
Section: Chapter 1 Appendix – Checkpoint 2
Author: SA
AACSB: Analytical reasoning
34) A linear relationship
A) graphs as a straight line.
B) graphs as a curve.
C) can be either positive or negative.
D) Both answers A and C are correct.
E) Both answers B and C are correct.
Skill: Level 1: Definition
Section: Chapter 1 Appendix – Checkpoint 2
Author: SA
AACSB: Analytical reasoning
35) A positive relationship exists between two variables if
A) one variable has “positively” no effect on the other variable.
B) a decrease in one variable is associated with an increase in the other variable.
C) a decrease in one variable is associated with a decrease in the other variable.
D) an increase in one variable is associated with both a decrease and an increase in the other
variable.
E) None of the above answers is correct.
Skill: Level 1: Definition
Section: Chapter 1 Appendix – Checkpoint 2
Author: MR
AACSB: Analytical reasoning
65
Copyright © 2011 Pearson Education, Inc.
36) If two variables are positively related, then
A) one variable causes the other.
B) an increase in one variable is accompanied by a decrease in the other.
C) an increase in one variable is accompanied by an increase in the other.
D) they change together, but not necessarily in the same direction.
E) neither variable can be positively related to any other variable.
Skill: Level 1: Definition
Section: Chapter 1 Appendix – Checkpoint 2
Author: SB
AACSB: Analytical reasoning
37) As a person increases his or her caloric intake, the person‘s weight increases, ceteris paribus.
The relationship between the person’s caloric intake and the person’s weight is an example of
A) unrelated variables.
B) a positive relationship.
C) a negative relationship.
D) a single point on a graph.
E) a trended relationship.
Skill: Level 2: Using definitions
Section: Chapter 1 Appendix – Checkpoint 2
Author: SB
AACSB: Analytical reasoning
38) If there is a positive relationship between two variables,
A) the graph of the relationship will be upward sloping.
B) the graph of the relationship will be downward sloping.
C) the slope of the line graphing the relationship will be negative.
D) Both answers A and C are correct.
E) Both answers B and C are correct.
Skill: Level 2: Using definitions
Section: Chapter 1 Appendix – Checkpoint 2
Author: MR
AACSB: Analytical reasoning
66
Copyright © 2011 Pearson Education, Inc.
39) If the change in y = 10 and the change in x = 3, there is
A) a positive relationship between y and x.
B) a negative relationship between y and x.
C) an independent relationship between y and x.
D) no relationship between y and x.
E) a +0.33 relationship between the two variables.
Skill: Level 2: Using definitions
Section: Chapter 1 Appendix – Checkpoint 2
Author: MR
AACSB: Analytical reasoning
40) Whenever people’s incomes increase, they buy more guitars. Hence a scatter diagram shows
that the relationship between income and guitars purchased is
A) a positive relationship.
B) a linear relationship.
C) a negative relationship.
D) some sort of relationship, but whether it is positive or negative depends on whether income is
plotted on the vertical or horizontal axis.
E) a U-shaped relationship.
Skill: Level 2: Using definitions
Section: Chapter 1 Appendix – Checkpoint 2
Author: MR
AACSB: Analytical reasoning
41) Which of the following statements is correct?
A) When a line slopes downwards moving to the right, the variable measured on the x-axis and
the variable measured on the y-axis are directly related.
B) When a line slopes upwards moving to the right, the variable measured on the x-axis and the
variable measured on the y-axis are directly related.
C) The higher the temperature, the more ice cream people consume. Thus the temperature and
ice cream consumption are inversely related.
D) If two variables are directly related, a graph of the two variables has a negative slope.
E) None of the above statements are correct.
Skill: Level 1: Definition
Section: Chapter 1 Appendix – Checkpoint 2
Author: SA
AACSB: Analytical reasoning
67
Copyright © 2011 Pearson Education, Inc.
42) If x increases whenever y decreases, then x and y are
A) not related.
B) positively related.
C) directly related.
D) negatively related.
E) related but whether positively or negatively related depends on whether the x variable or the y
variable is plotted on the vertical axis.
Skill: Level 1: Definition
Section: Chapter 1 Appendix – Checkpoint 2
Author: SA
AACSB: Analytical reasoning
43) Whenever one variable increases, another variable decreases. The two variables are
A) definitely related through a third variable.
B) negatively related.
C) positively related.
D) unrelated to each other.
E) related but whether positively or negatively related depends on which variable is plotted on
the vertical axis.
Skill: Level 1: Definition
Section: Chapter 1 Appendix – Checkpoint 2
Author: MR
AACSB: Analytical reasoning
44) If x increases and as a result y decreases, then x and y are
A) not related because the relationship is a causal one.
B) positively related.
C) negatively related.
D) directly related.
E) trend-line related.
Skill: Level 1: Definition
Section: Chapter 1 Appendix – Checkpoint 2
Author: SA
AACSB: Analytical reasoning
68
Copyright © 2011 Pearson Education, Inc.
45) “As the price of gasoline increases, fewer people buy cars that are gas guzzlers.” A graph
showing this relationship would
A) have a negative slope.
B) have a positive relationship.
C) have a direct relationship.
D) be a horizontal line.
E) be a vertical line.
Skill: Level 2: Using definitions
Section: Chapter 1 Appendix – Checkpoint 2
Author: MR
AACSB: Analytical reasoning
46) As the number of days without rain increases, the amount of wheat grown per acre declines.
A graph showing this relationship shows
A) a horizontal line.
B) a vertical line.
C) a positive relationship.
D) a line with a positive slope.
E) None of the above answers is correct.
Skill: Level 2: Using definitions
Section: Chapter 1 Appendix – Checkpoint 2
Author: MR
AACSB: Analytical reasoning
47) As the price of home heating oil rises, families buy less home heating oil. Hence a scatter
diagram with the price of home heating oil on the vertical axis and the quantity purchased on the
horizontal axis reveals a ________ relationship.
A) positive
B) linear
C) time-series
D) negative
E) cross-sectional
Skill: Level 2: Using definitions
Section: Chapter 1 Appendix – Checkpoint 2
Author: JC
AACSB: Analytical reasoning
69
Copyright © 2011 Pearson Education, Inc.
48) If the change in y = -4 and the change in x = 2, there is
A) an independent relationship between y and x.
B) a positive relationship between y and x.
C) a negative relationship between y and x.
D) no relationship between y and x.
E) a relationship between x and y but more information is needed to determine if it is a negative
or positive relationship.
Skill: Level 2: Using definitions
Section: Chapter 1 Appendix – Checkpoint 2
Author: MR
AACSB: Analytical reasoning
49) An independent relationship between two variables is shown in a graph by
A) an upward-sloping line.
B) a horizontal or a vertical line.
C) a downward-sloping line.
D) a steeply sloped line.
E) any straight line curve.
Skill: Level 1: Definition
Section: Chapter 1 Appendix – Checkpoint 2
Author: MR
AACSB: Analytical reasoning
50) If two variables are unrelated, their graph is
A) either a horizontal or a vertical line.
B) a downward-sloping line.
C) an upward-sloping line.
D) a curved line.
E) None of the above answers is correct because it is not possible to graph unrelated variables.
Skill: Level 1: Definition
Section: Chapter 1 Appendix – Checkpoint 2
Author: SB
AACSB: Analytical reasoning
70
Copyright © 2011 Pearson Education, Inc.
51) Consider a diagram in which the variable measured on the y-axis remains constant while the
variable measured on the x-axis increases. The graph of these two variables is a
A) vertical line.
B) horizontal line.
C) line that has positive slope.
D) line that has a negative slope.
E) non-existent because the two variables are not related.
Skill: Level 2: Using definitions
Section: Chapter 1 Appendix – Checkpoint 2
Author: SA
AACSB: Analytical reasoning
52) A graph shows the price of a pound of cucumbers on the vertical axis and the quantity of
new cars sold by Honda on the horizontal axis. The price of a pound of cucumbers remains
constant as the quantity of new cars sold increases. The graph of these data is a
A) horizontal line.
B) vertical line.
C) curve with a maximum.
D) positively sloped line.
E) negatively sloped line.
Skill: Level 2: Using definitions
Section: Chapter 1 Appendix – Checkpoint 2
Author: MR
AACSB: Analytical reasoning
53) Matt pays a $50 a month membership fee at Bruno’s Gym. He can exercise at the gym as
many times as he wishes. If the membership fee is measured along the vertical axis and the
number of times he exercises is measured along the horizontal axis, the graph between his
membership fee and the number of times he exercises will
A) be a horizontal line.
B) be positively sloped.
C) be negatively sloped.
D) be a vertical line.
E) start out positively sloped and then, as Matt loses interest, become negatively sloped.
Skill: Level 3: Using models
Section: Chapter 1 Appendix – Checkpoint 2
Author: SA
AACSB: Analytical reasoning
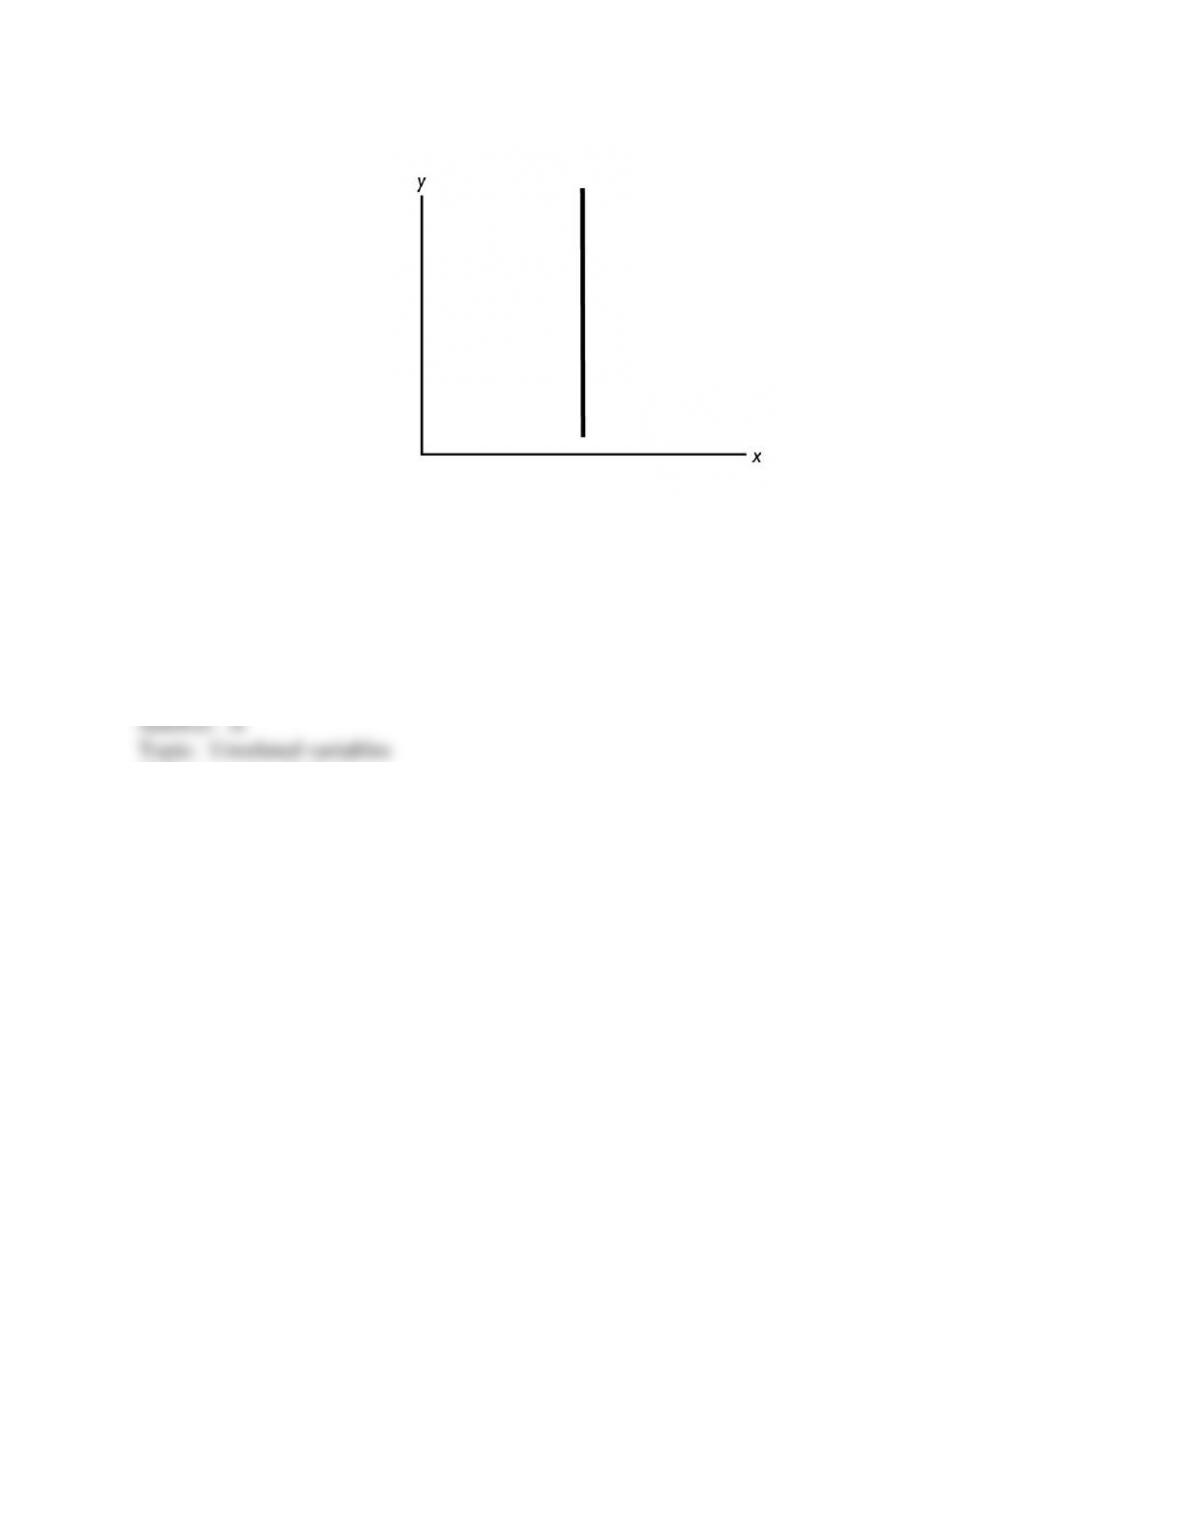
71
Copyright © 2011 Pearson Education, Inc.
54) In the above figure, as the y variable increases,
A) the x variable is constant.
B) the x variable increases.
C) the x variable decreases.
D) the x variable at first increases but then decreases.
E) the x variable probably changes but more information is needed to determine if it increases,
decreases, or stays the same.
Skill: Level 1: Definition
Section: Chapter 1 Appendix – Checkpoint 2
Author: MR
AACSB: Analytical reasoning
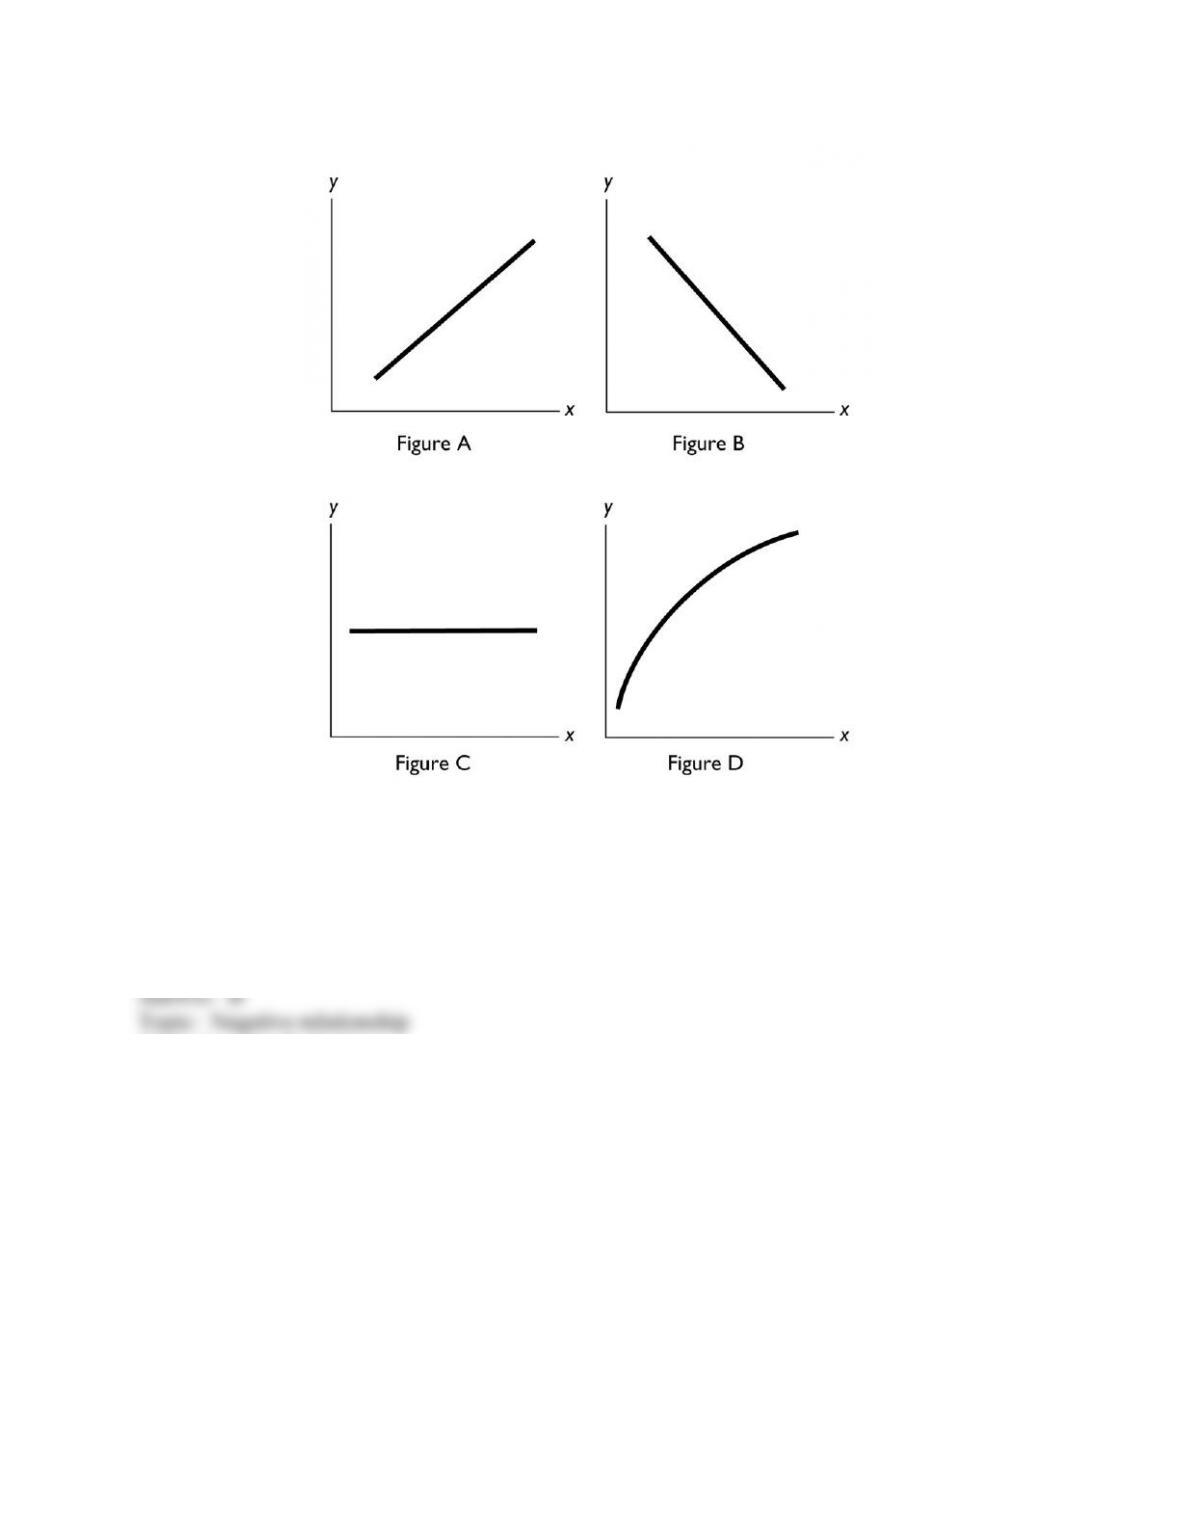
72
Copyright © 2011 Pearson Education, Inc.
55) In the above figure, a negative relationship between x and y is shown in Figure
A) A.
B) B.
C) C.
D) D.
E) B and Figure C.
Skill: Level 1: Definition
Section: Chapter 1 Appendix – Checkpoint 2
Author: SA
AACSB: Analytical reasoning

73
Copyright © 2011 Pearson Education, Inc.
56) In the above figure, no relationship between x and y is shown in Figure
A) A.
B) B.
C) C.
D) D.
E) A and Figure B.
Skill: Level 1: Definition
Section: Chapter 1 Appendix – Checkpoint 2
Author: SA
AACSB: Analytical reasoning
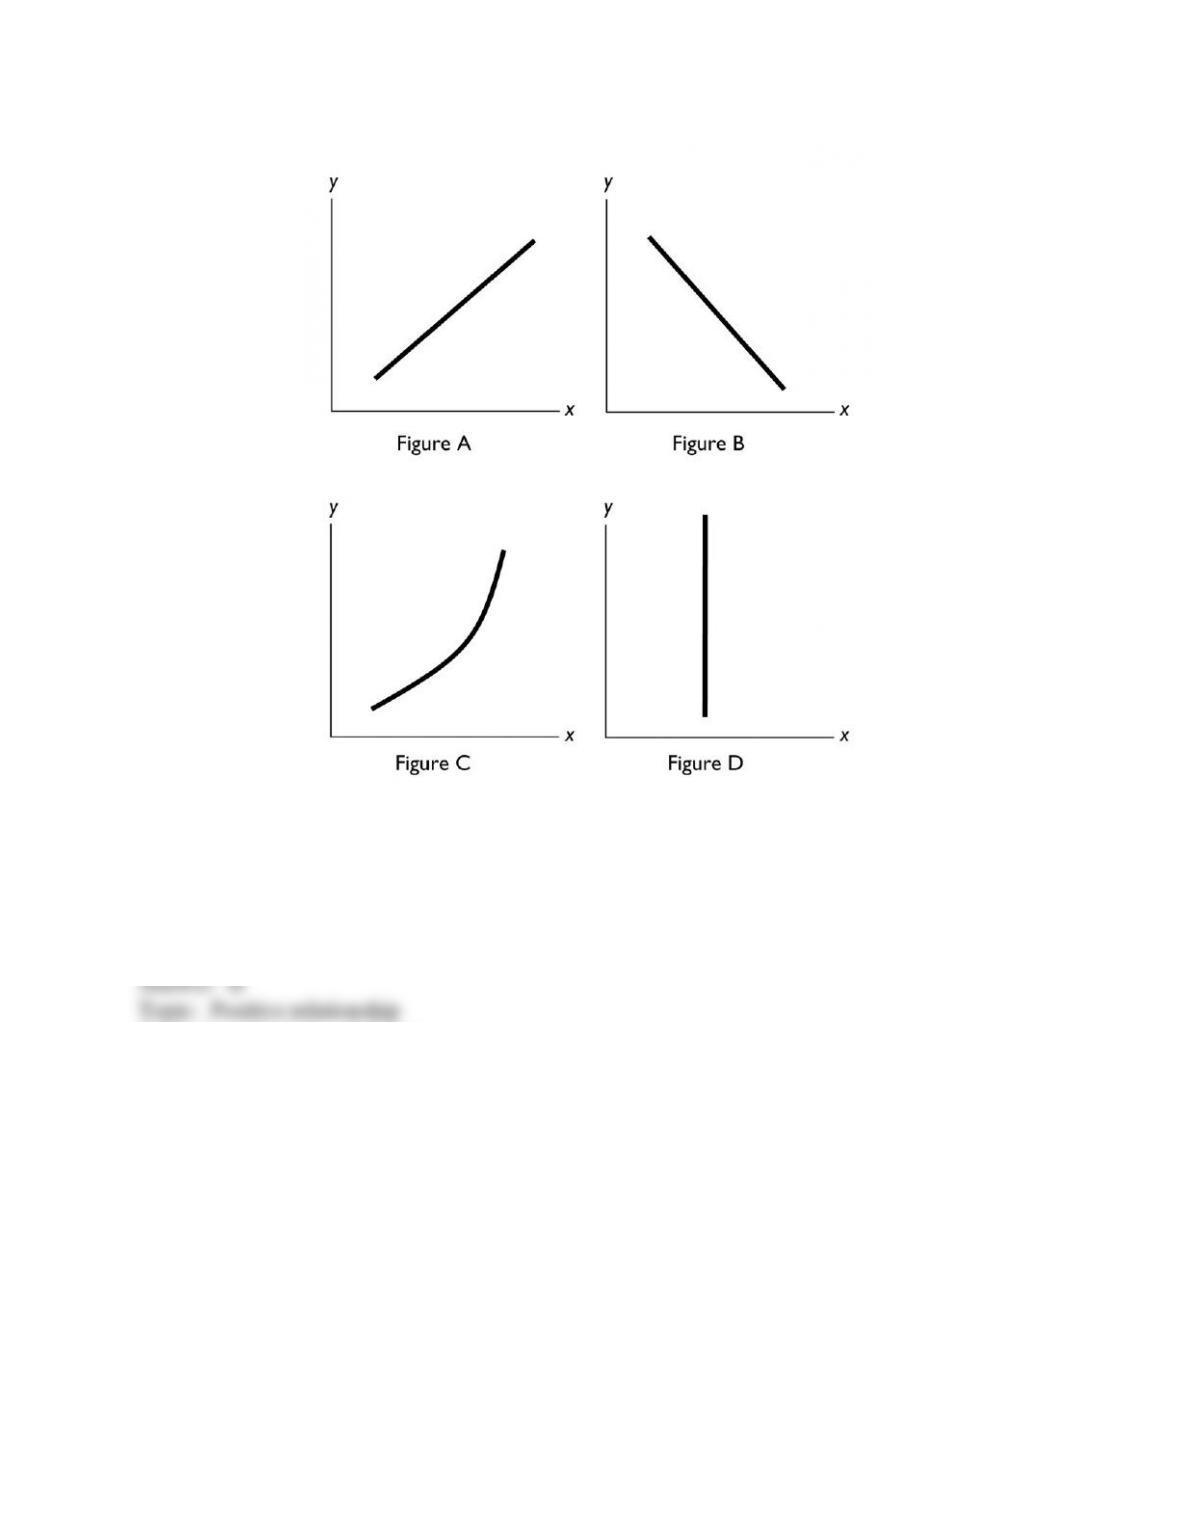
74
Copyright © 2011 Pearson Education, Inc.
57) In the diagram above, which figure(s) show(s) a direct relationship between the variables?
A) both B and C
B) both A and C
C) only A
D) only D
E) only B
Skill: Level 2: Using definitions
Section: Chapter 1 Appendix – Checkpoint 2
Author: PH
AACSB: Analytical reasoning
75
Copyright © 2011 Pearson Education, Inc.
58) In the diagram above, which figure(s) show(s) an inverse relationship between the variables?
A) both B and C
B) only B
C) both A and C
D) only D
E) only C
Skill: Level 2: Using definitions
Section: Chapter 1 Appendix – Checkpoint 2
Author: PH
AACSB: Analytical reasoning
59) In the diagram above, which figure(s) show(s) no relationship between the variables?
A) both B and C
B) only B
C) both A and C
D) only D
E) both A and B
Skill: Level 2: Using definitions
Section: Chapter 1 Appendix – Checkpoint 2
Author: PH
AACSB: Analytical reasoning
60) If a curve rises and then falls, it has a
A) maximum.
B) minimum.
C) linear relationship.
D) constant slope relationship.
E) slope that is negative and then positive.
Skill: Level 1: Definition
Section: Chapter 1 Appendix – Checkpoint 2
Author: MR
AACSB: Analytical reasoning
76
Copyright © 2011 Pearson Education, Inc.
61) As a shoe factory adds more workers, shoe production grows, reaches a maximum, and then
shrinks. In a diagram that has the number of workers on the horizontal axis and the number of
shoes on the vertical axis, the relationship between the number of workers and the number of
shoes starts as ________ and then, after the maximum point, is ________.
A) positive; negative
B) negative; positive
C) linear; negative
D) positive; linear
E) positive; nonexistent
Skill: Level 3: Using models
Section: Chapter 1 Appendix – Checkpoint 2
Author: JC
AACSB: Analytical reasoning
62) As a curve approaches a maximum point, the slope will
A) be positive and then negative after the maximum point.
B) be negative and then positive after the maximum point.
C) remain constant on either side of the maximum point.
D) increase before and after the maximum point.
E) decrease before and after the maximum point.
Skill: Level 2: Using definitions
Section: Chapter 1 Appendix – Checkpoint 2
Author: MR
AACSB: Analytical reasoning
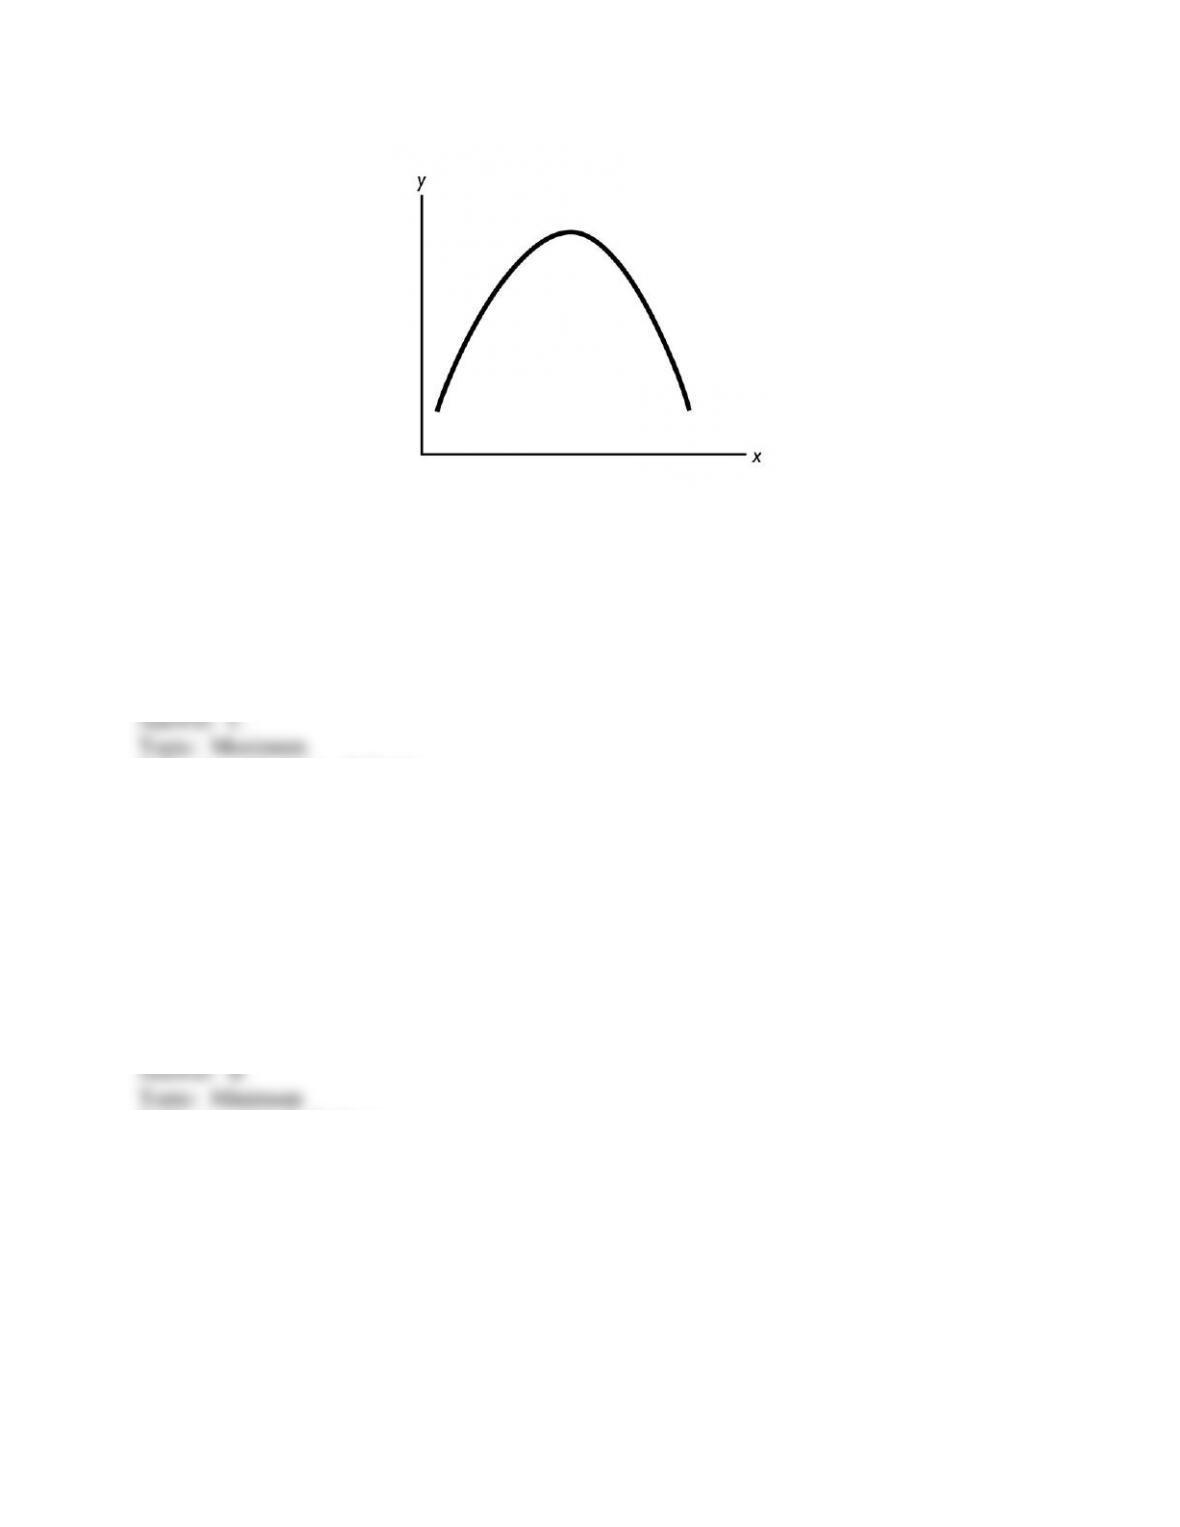
77
Copyright © 2011 Pearson Education, Inc.
63) In the figure above, the relationship between the x variable and the y variable
A) is positive.
B) is negative.
C) starts by being positive and then becomes negative.
D) starts by being negative and then becomes positive.
E) is non-existent because the two variables are unrelated.
Skill: Level 2: Using definitions
Section: Chapter 1 Appendix – Checkpoint 2
Author: MR
AACSB: Analytical reasoning
64) If a curve falls and then rises, it
A) has a maximum.
B) has a minimum.
C) has a linear relationship.
D) has a constant slope relationship.
E) shows no relationship between the two variables.
Skill: Level 1: Definition
Section: Chapter 1 Appendix – Checkpoint 2
Author: MR
AACSB: Analytical reasoning
78
Copyright © 2011 Pearson Education, Inc.
65) Moving from left to right, a U-shaped curve starts with a
A) positive slope, reaches a maximum, then ends with a negative slope.
B) positive slope, reaches a minimum, then ends with a negative slope.
C) negative slope, reaches a maximum, then ends with a positive slope.
D) negative slope, reaches a minimum, then ends with a positive slope.
E) negative slope, reaches a minimum, then ends with a negative slope.
Skill: Level 2: Using definitions
Section: Chapter 1 Appendix – Checkpoint 2
Author: SB
AACSB: Analytical reasoning
66) The minimum point of a U-shaped curve,
A) is a point where the variable is neither increasing nor decreasing.
B) has a slope equal to zero.
C) has the maximum slope possible.
D) Both answers A and B are correct.
E) Both answers A and C are correct.
Skill: Level 1: Definition
Section: Chapter 1 Appendix – Checkpoint 2
Author: SA
AACSB: Analytical reasoning
67) An economist observed that as more computers are added to a factory, the costs of
production initially decline, reach a minimum, and then rise. In a diagram that has costs on the
vertical axis and the number of computers on the horizontal axis, the relationship always is
A) negative and then linear after the minimum point.
B) positive and then negative after the minimum point.
C) negative and then positive after the minimum point.
D) linear and then positive after the minimum point.
E) negative both before and after the minimum point.
Skill: Level 3: Using models
Section: Chapter 1 Appendix – Checkpoint 2
Author: JC
AACSB: Analytical reasoning
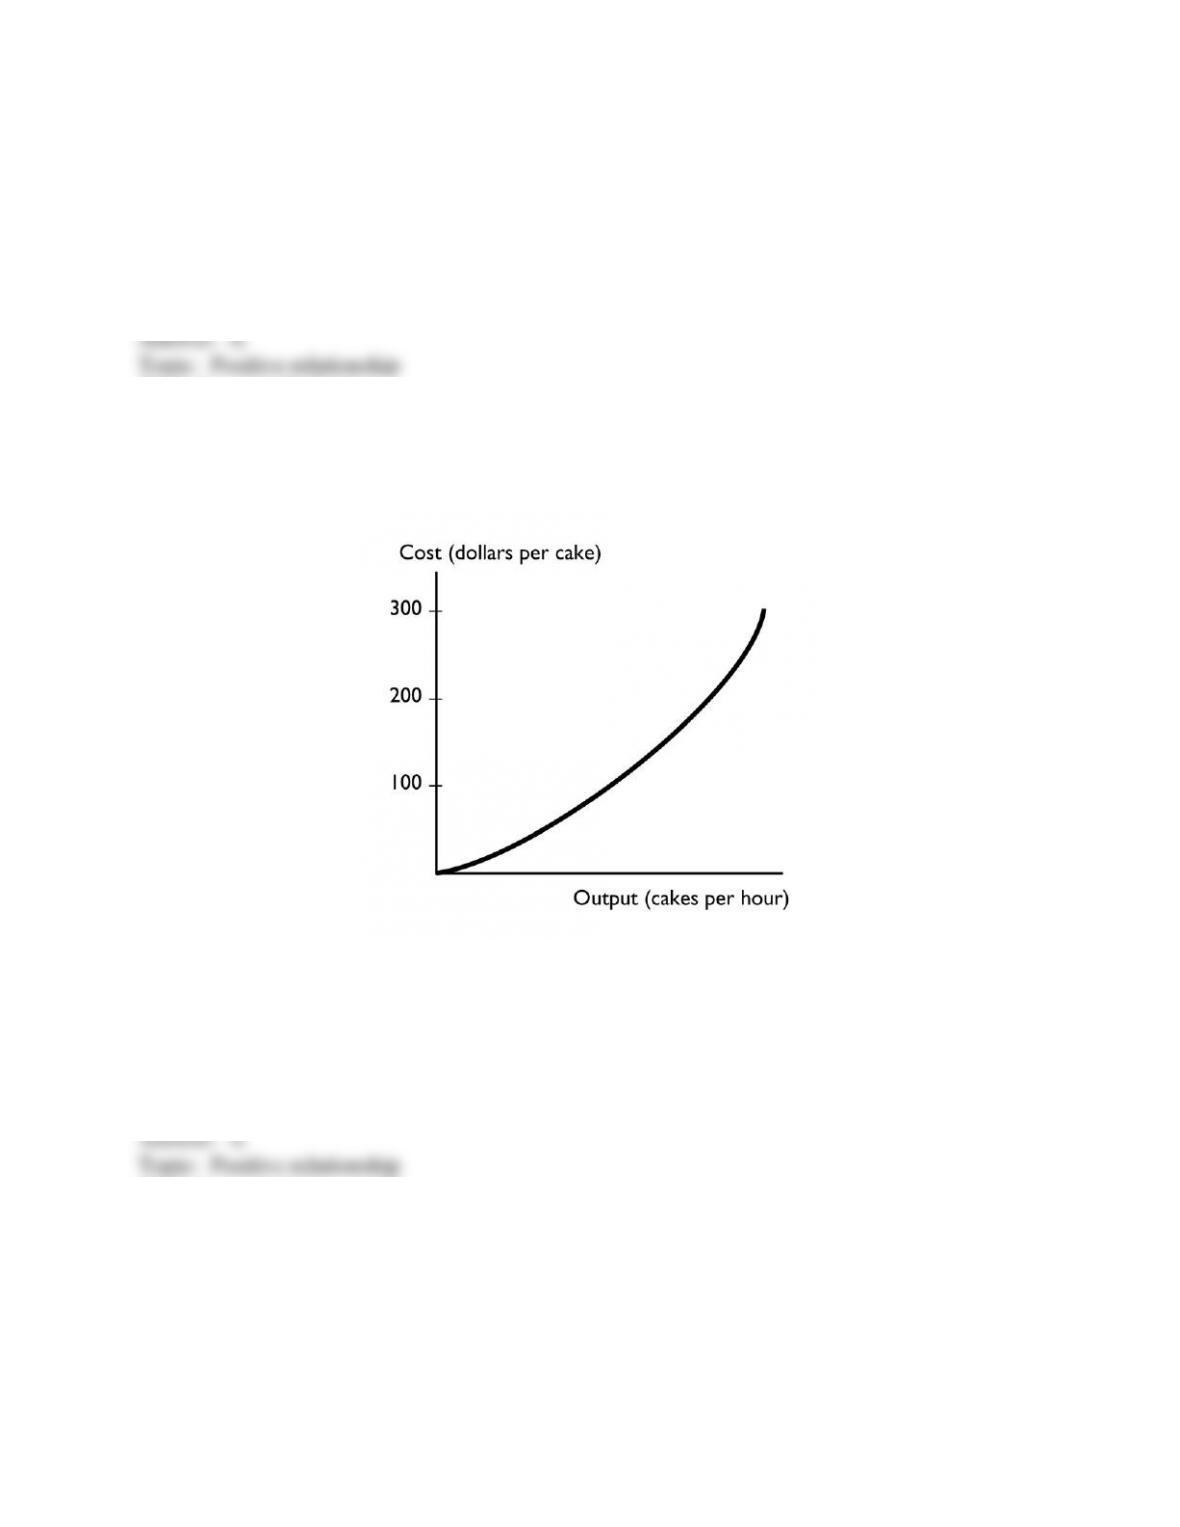
79
Copyright © 2011 Pearson Education, Inc.
68) If whenever one variable increases, another variable also increases, then these two variables
are ________ related.
A) positively
B) negatively
C) inversely
D) cross-sectionally
E) trend-line
Skill: Level 1: Definition
Section: Chapter 1 Appendix – Checkpoint 2
Author: STUDY GUIDE
AACSB: Analytical reasoning
69) The graph shows a
A) positive relationship that becomes steeper.
B) negative relationship that becomes steeper.
C) positive relationship that becomes less steep.
D) negative relationship that become less steep.
E) negative trend between the total cost of a cake and the output of cakes.
Skill: Level 3: Using models
Section: Chapter 1 Appendix – Checkpoint 2
Author: MyEconLab Web Site
AACSB: Analytical reasoning
80
Copyright © 2011 Pearson Education, Inc.
70) A graph of the relationship between two variables is a line that slopes down to the right.
These two variables are ________ related.
A) positively
B) directly
C) negatively
D) not
E) trend-line
Skill: Level 1: Definition
Section: Chapter 1 Appendix – Checkpoint 2
Author: STUDY GUIDE
AACSB: Analytical reasoning
71) A graph shows that the number of U.S. tourists visiting a Caribbean island increases as the
temperature in the northeastern United States falls. The graph shows
A) a positive relationship.
B) a direct relationship.
C) a negative relationship.
D) no relationship.
E) an invalid relationship.
Skill: Level 1: Definition
Section: Chapter 1 Appendix – Checkpoint 2
Author: MyEconLab Web Site
AACSB: Analytical reasoning
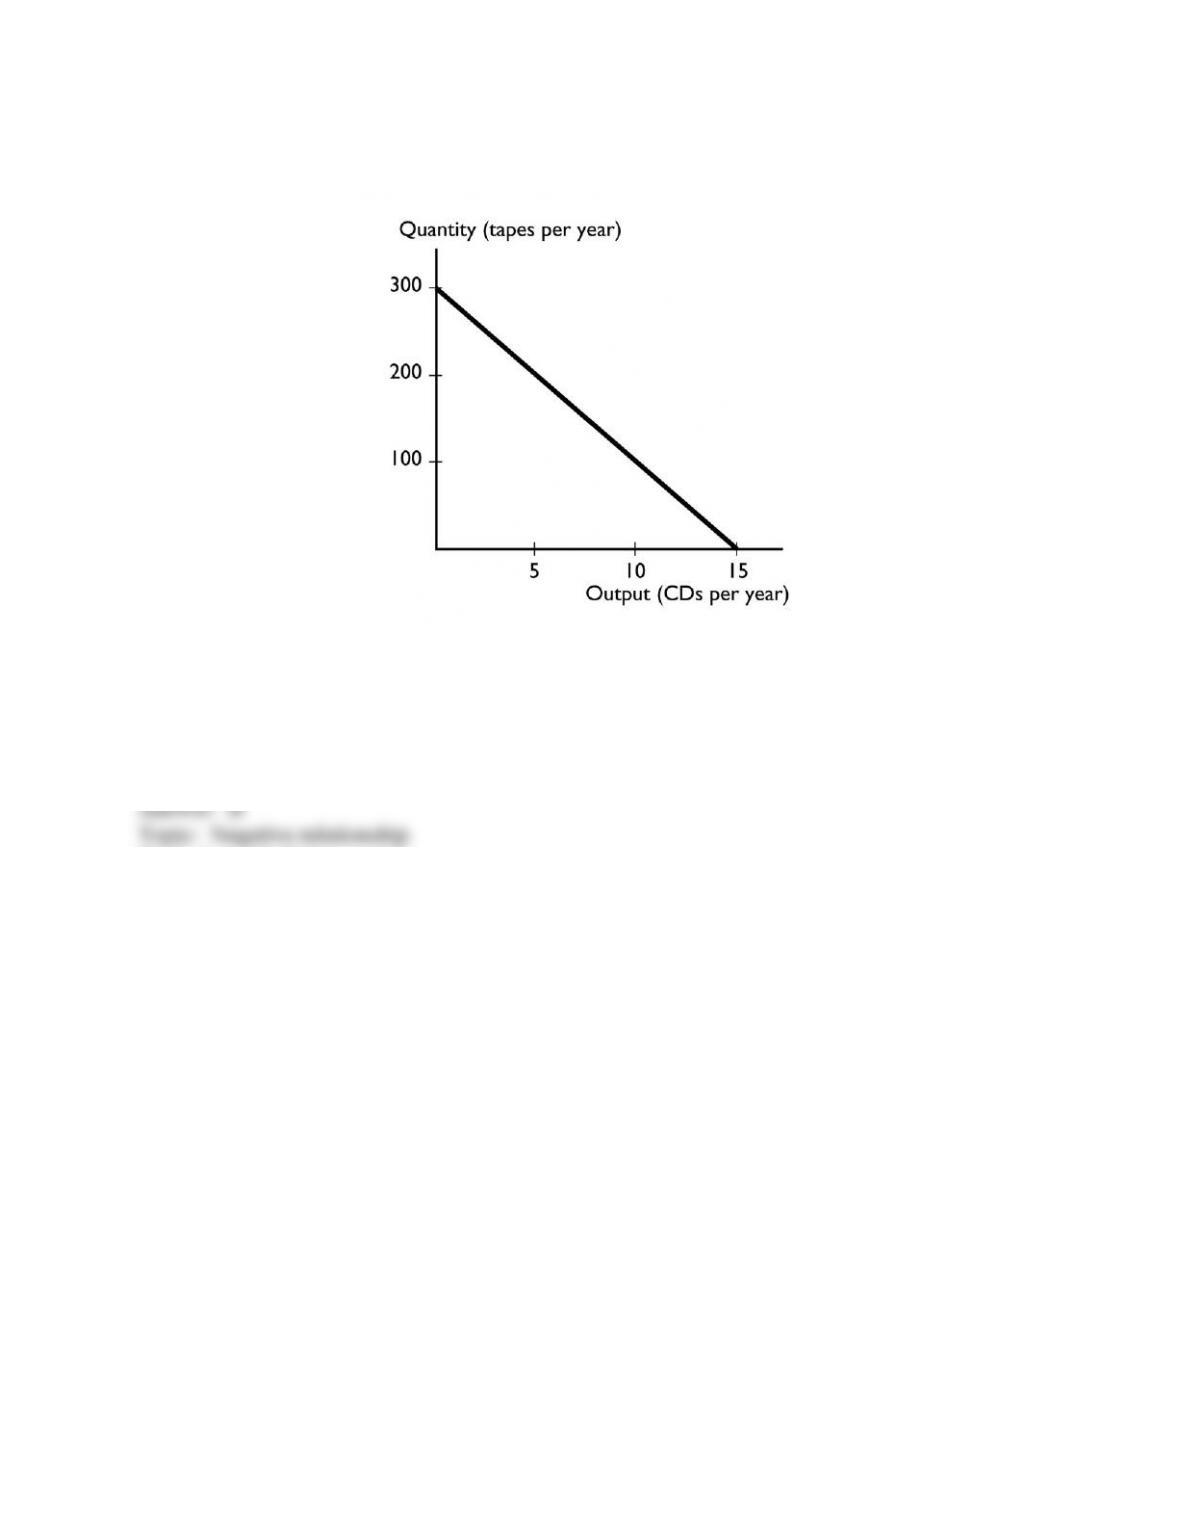
81
Copyright © 2011 Pearson Education, Inc.
72) The graph shows a
A) positive relationship that becomes less steep.
B) negative relationship that is linear.
C) positive relationship that is linear.
D) negative relationship that become less steep.
E) None of the above answers is correct.
Skill: Level 3: Using models
Section: Chapter 1 Appendix – Checkpoint 2
Author: MyEconLab Web Site
AACSB: Analytical reasoning
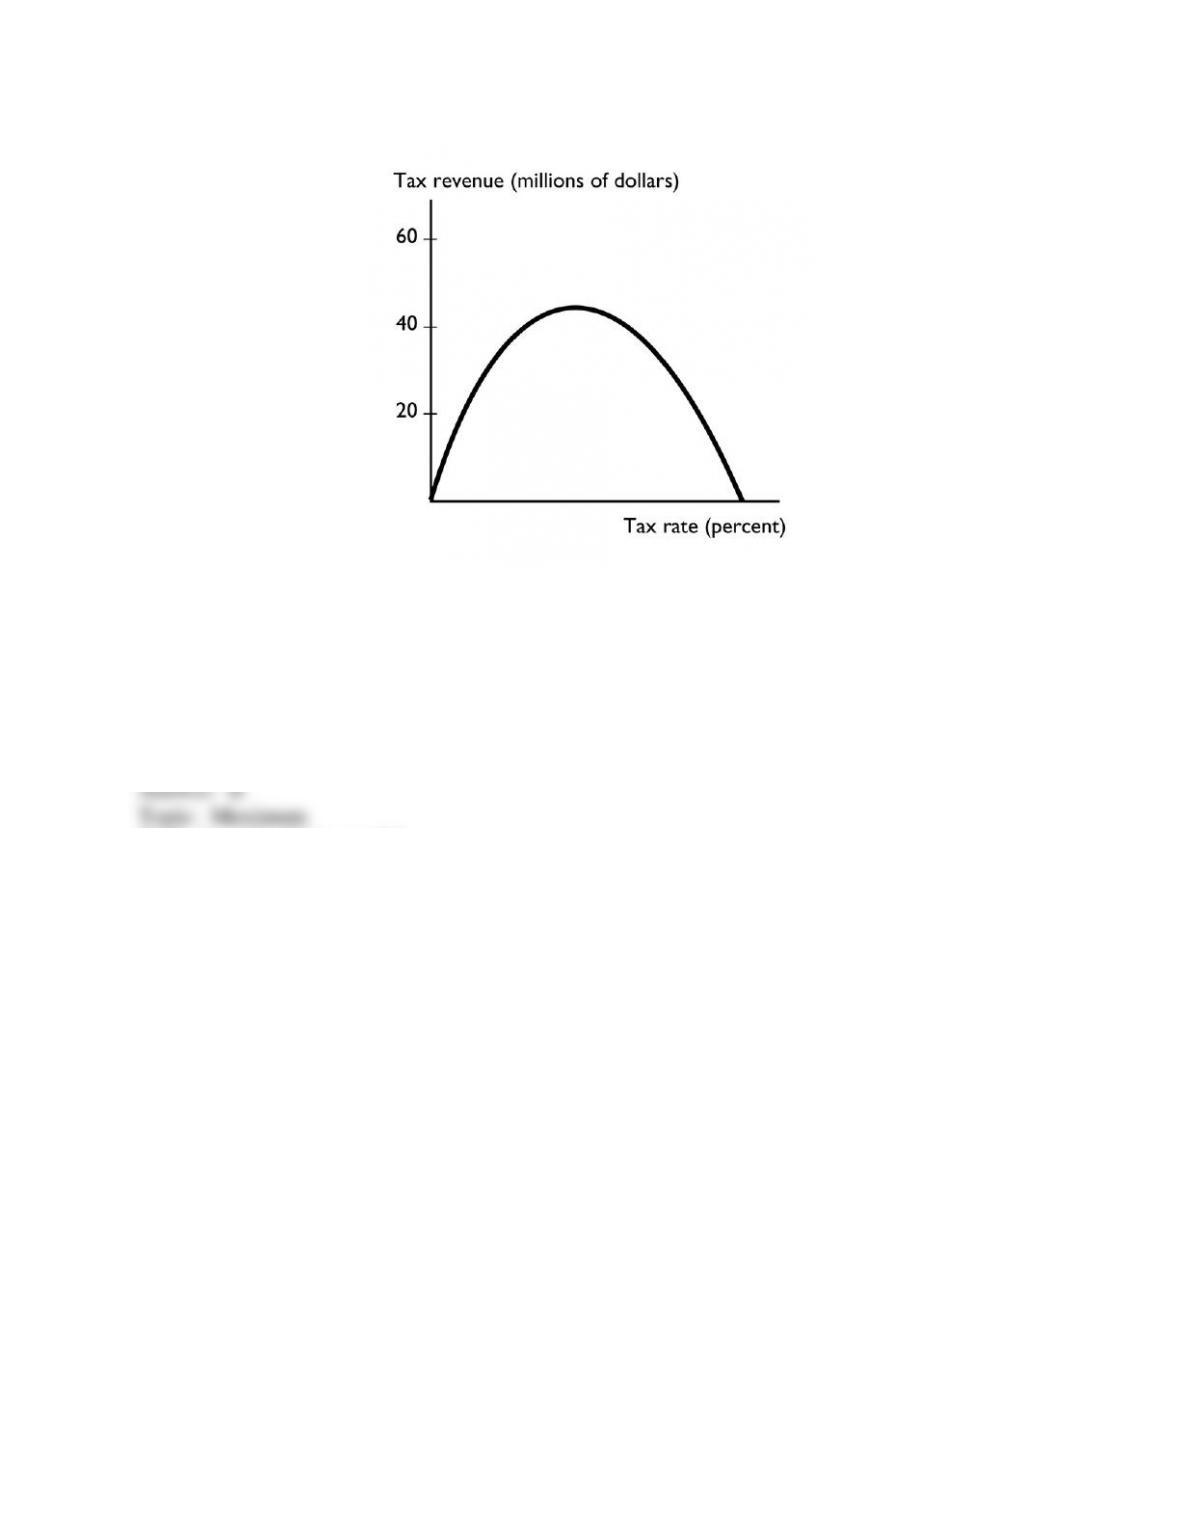
82
Copyright © 2011 Pearson Education, Inc.
73) The graph shows
A) a relationship with a minimum.
B) a relationship with a maximum.
C) no relationship.
D) a linear relationship.
E) a cross-section relationship.
Skill: Level 3: Using models
Section: Chapter 1 Appendix – Checkpoint 2
Author: MyEconLab Web Site
AACSB: Analytical reasoning
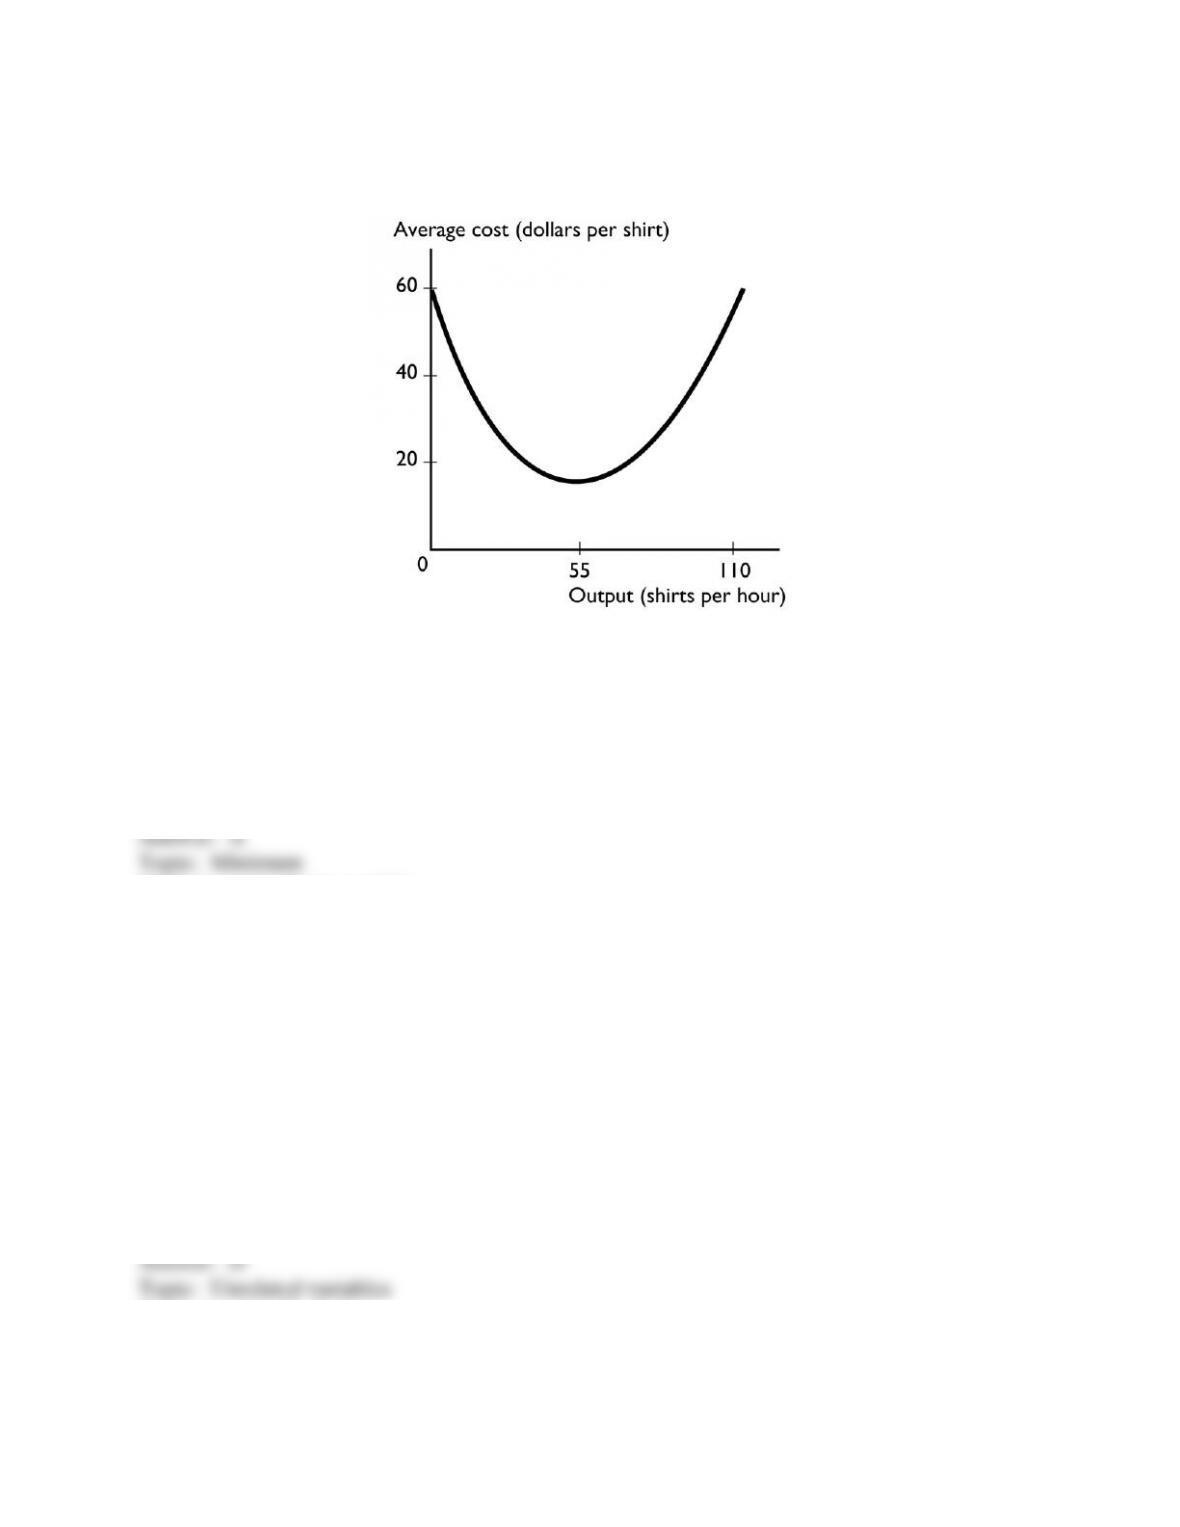
83
Copyright © 2011 Pearson Education, Inc.
74) The graph shows
A) a relationship with a minimum.
B) a relationship with a maximum.
C) no relationship.
D) a relationship that becomes less steep.
E) a cross-section relationship.
Skill: Level 3: Using models
Section: Chapter 1 Appendix – Checkpoint 2
Author: MyEconLab Web Site
AACSB: Analytical reasoning
75) Two variables are unrelated if their graph is
i. a vertical line
ii. a 45 degree line
iii. a horizontal line
A) i only.
B) ii only.
C) iii only.
D) i and iii.
E) i, ii, and iii.
Skill: Level 1: Definition
Section: Chapter 1 Appendix – Checkpoint 2
Author: STUDY GUIDE
AACSB: Analytical reasoning
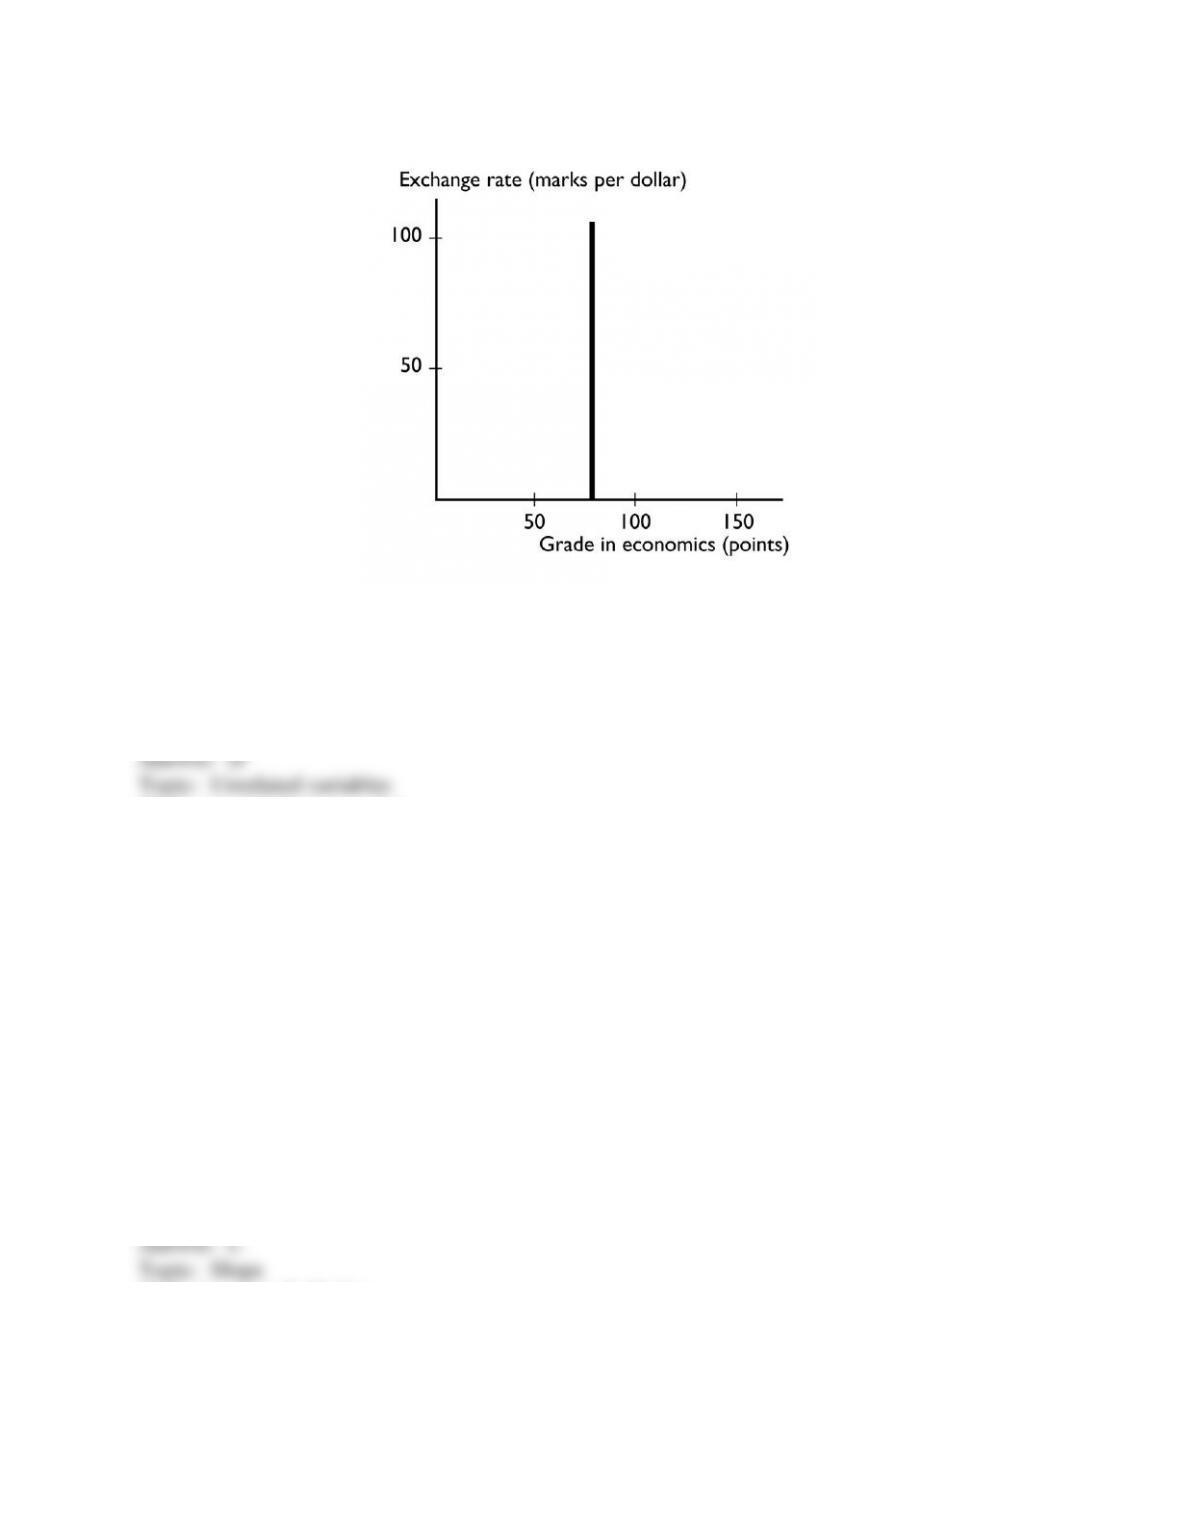
84
Copyright © 2011 Pearson Education, Inc.
76) The graph shows
A) positive relationship that becomes less steep.
B) negative relationship that is linear.
C) positive relationship that is linear.
D) no relationship between the variables.
E) a trend relationship between the variables.
Skill: Level 3: Using models
Section: Chapter 1 Appendix – Checkpoint 2
Author: MyEconLab Web Site
AACSB: Analytical reasoning
77) A slope is measured as the
A) value of the variable measured on the y-axis divided by the value of the variable measured on
the x-axis.
B) value of the variable measured on the x-axis divided by the value of the variable measured on
the y-axis.
C) change in the value of variable on the y-axis divided by the change in the value of the variable
on the x-axis.
D) value of the variable measured on the y-axis minus the value of the variable measured on the
x-axis.
E) change in the value of variable on the x-axis divided by the change in the value of the variable
on the y-axis.
Skill: Level 1: Definition
Section: Chapter 1 Appendix – Checkpoint 3
Author: SA
AACSB: Analytical reasoning
85
Copyright © 2011 Pearson Education, Inc.
78) A slope is measured as the
A) value of the variable measured on the y-axis divided by the value of the variable measured on
the x-axis.
B) value of the variable measured on the x-axis divided by the value of the variable measured on
the y-axis.
C) change in the value of variable on the y-axis divided by the change in the value of the variable
on the x-axis.
D) value of the variable measured on the y-axis minus the value of the variable measured on the
x-axis.
E) value of the variable measured on the x-axis minus the value of the variable measured on the
y-axis.
Skill: Level 1: Definition
Section: Chapter 1 Appendix – Checkpoint 3
Author: SA
AACSB: Analytical reasoning
79) “The change in the value of the variable measured on the y-axis divided by the change in the
value of the variable measured on the x-axis” is the definition of
A) a graph.
B) slope.
C) a curve.
D) a relationship.
E) a trend.
Skill: Level 1: Definition
Section: Chapter 1 Appendix – Checkpoint 3
Author: MR
AACSB: Analytical reasoning
80) The slope of a line equals the change in the variable measured along the
A) x-axis divided by the change in the variable measured along the y-axis.
B) y-axis divided by the change in the variable measured along the x-axis.
C) x-axis minus the change in the variable measured along the y-axis.
D) x-axis multiplied by the change in the variable measured along the y-axis.
E) y-axis minus the change in the variable measured along the x-axis.
Skill: Level 1: Definition
Section: Chapter 1 Appendix – Checkpoint 3
Author: MR
AACSB: Analytical reasoning
86
Copyright © 2011 Pearson Education, Inc.
81) The slope
A) of a straight line is the same regardless of where on the line it is calculated.
B) equals the change in the value of the variable measured on the x-axis divided by the change in
the variable measured on the y-axis.
C) will be small if a large change in the variable measured on the y-axis is associated with a
small change in the variable measured on the x-axis.
D) equals the change in the value of the variable measured on the y-axis minus the change in the
variable measured on the x-axis.
E) falls as the x variable increases if the line has a negative slope.
Skill: Level 1: Definition
Section: Chapter 1 Appendix – Checkpoint 3
Author: SA
AACSB: Analytical reasoning
82) With y measured on the vertical axis and x measured on the horizontal axis, the slope of a
straight line is defined as
A) y/x.
B) x/y.
C) (change in y)/(change in x).
D) (change in x)/(change in y).
E) y – x.
Skill: Level 2: Using definitions
Section: Chapter 1 Appendix – Checkpoint 3
Author: MR
AACSB: Analytical reasoning
83) In a graph, a straight line has a negative slope if the line
A) is vertical.
B) is horizontal.
C) falls from left to right.
D) rises from left to right.
E) shows a trend.
Skill: Level 2: Using definitions
Section: Chapter 1 Appendix – Checkpoint 3
Author: MR
AACSB: Analytical reasoning

87
Copyright © 2011 Pearson Education, Inc.
84) A curve with a positive but decreasing slope represents a relationship where, every time the
variable measured along the horizontal axis increases by one unit, the variable measured along
the vertical axis
A) increases by a constant amount.
B) increases by an increasing amount.
C) increases by a decreasing amount.
D) decreases.
E) does not change by much.
Skill: Level 2: Using definitions
Section: Chapter 1 Appendix – Checkpoint 3
Author: SB
AACSB: Analytical reasoning
85) The slope
A) of a straight line is the same regardless of where on the line it is calculated.
B) equals the change in the value of the variable measured on the vertical axis divided by the
change in the variable measured along the horizontal axis.
C) will be small if a large change in the variable measured on the vertical axis is associated with
a small change in the variable measured along the horizontal axis.
D) Answers A and B are correct.
E) Answers A and C are correct.
Skill: Level 2: Using definitions
Section: Chapter 1 Appendix – Checkpoint 3
Author: SA
AACSB: Analytical reasoning
86) Which of the following statements is correct?
A) The slope of a straight line changes depending where on the line it is calculated.
B) The slope of a curved line is not defined because it is impossible to calculate the slope along a
curved line.
C) A straight line that slopes upward moving to the right has a positive slope.
D) Answers A and B are correct.
E) Answers A and C are correct.
Skill: Level 2: Using definitions
Section: Chapter 1 Appendix – Checkpoint 3
Author: MR
AACSB: Analytical reasoning
88
Copyright © 2011 Pearson Education, Inc.
87) If a small change in the x variable results in a large change in the y variable, the curve will be
A) positively sloped.
B) negatively sloped.
C) steep.
D) flat.
E) trended.
Skill: Level 2: Using definitions
Section: Chapter 1 Appendix – Checkpoint 3
Author: SB
AACSB: Analytical reasoning
88) Suppose the relationship between a person’s age and his or her height is plotted with the age
measured along the x-axis and the height measured along the y-axis. Then, the curve showing
this relationship is
A) a straight line with a positive slope.
B) positively sloped and becoming less steep.
C) a straight line with a negative slope.
D) negatively sloped and becoming less steep.
E) positively sloped and becoming more steep.
Skill: Level 3: Using models
Section: Chapter 1 Appendix – Checkpoint 3
Author: SA
AACSB: Analytical reasoning
89) If the quantity of the variable on the y-axis increases by 10 when the quantity of the variable
on the x-axis decreases by 2, then the slope of the curve equals
A) 2.
B) -10.
C) 10.
D) -5.
E) None of the above answers are correct.
Skill: Level 2: Using definitions
Section: Chapter 1 Appendix – Checkpoint 3
Author: MR
AACSB: Analytical reasoning
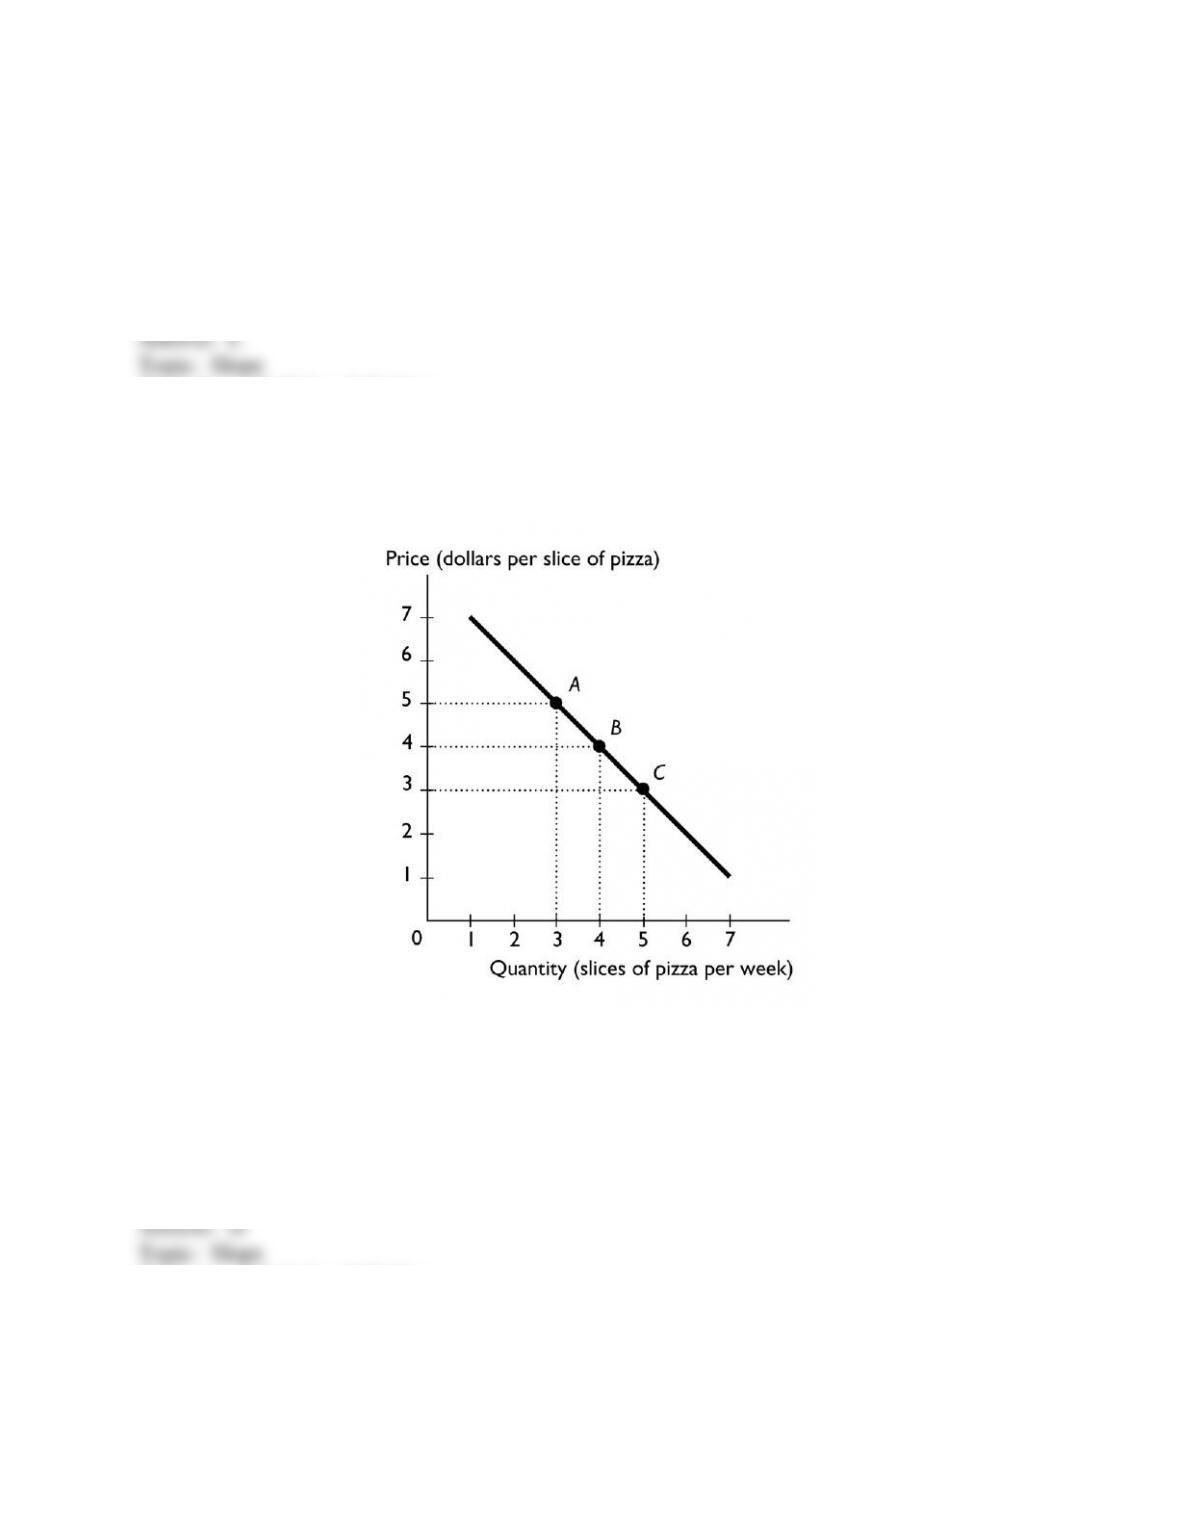
89
Copyright © 2011 Pearson Education, Inc.
90) If the quantity of the variable on the y-axis increases by 3 when the quantity of the variable
on the x-axis increases by 4, then the slope of the curve equals
A) 3.
B) 4.
C) 3/4.
D) 4/3.
E) 1.
Skill: Level 2: Using definitions
Section: Chapter 1 Appendix – Checkpoint 3
Author: MR
AACSB: Analytical reasoning
91) The above figure shows the relationship between the price of a slice of pizza and how many
slices of pizza Ricardo buys in a week. Between points A and B, the slope of the line equals
A) -5.
B) -4.
C) -3.
D) -1.
E) -2
Skill: Level 2: Using definitions
Section: Chapter 1 Appendix – Checkpoint 3
Author: SA
AACSB: Analytical reasoning
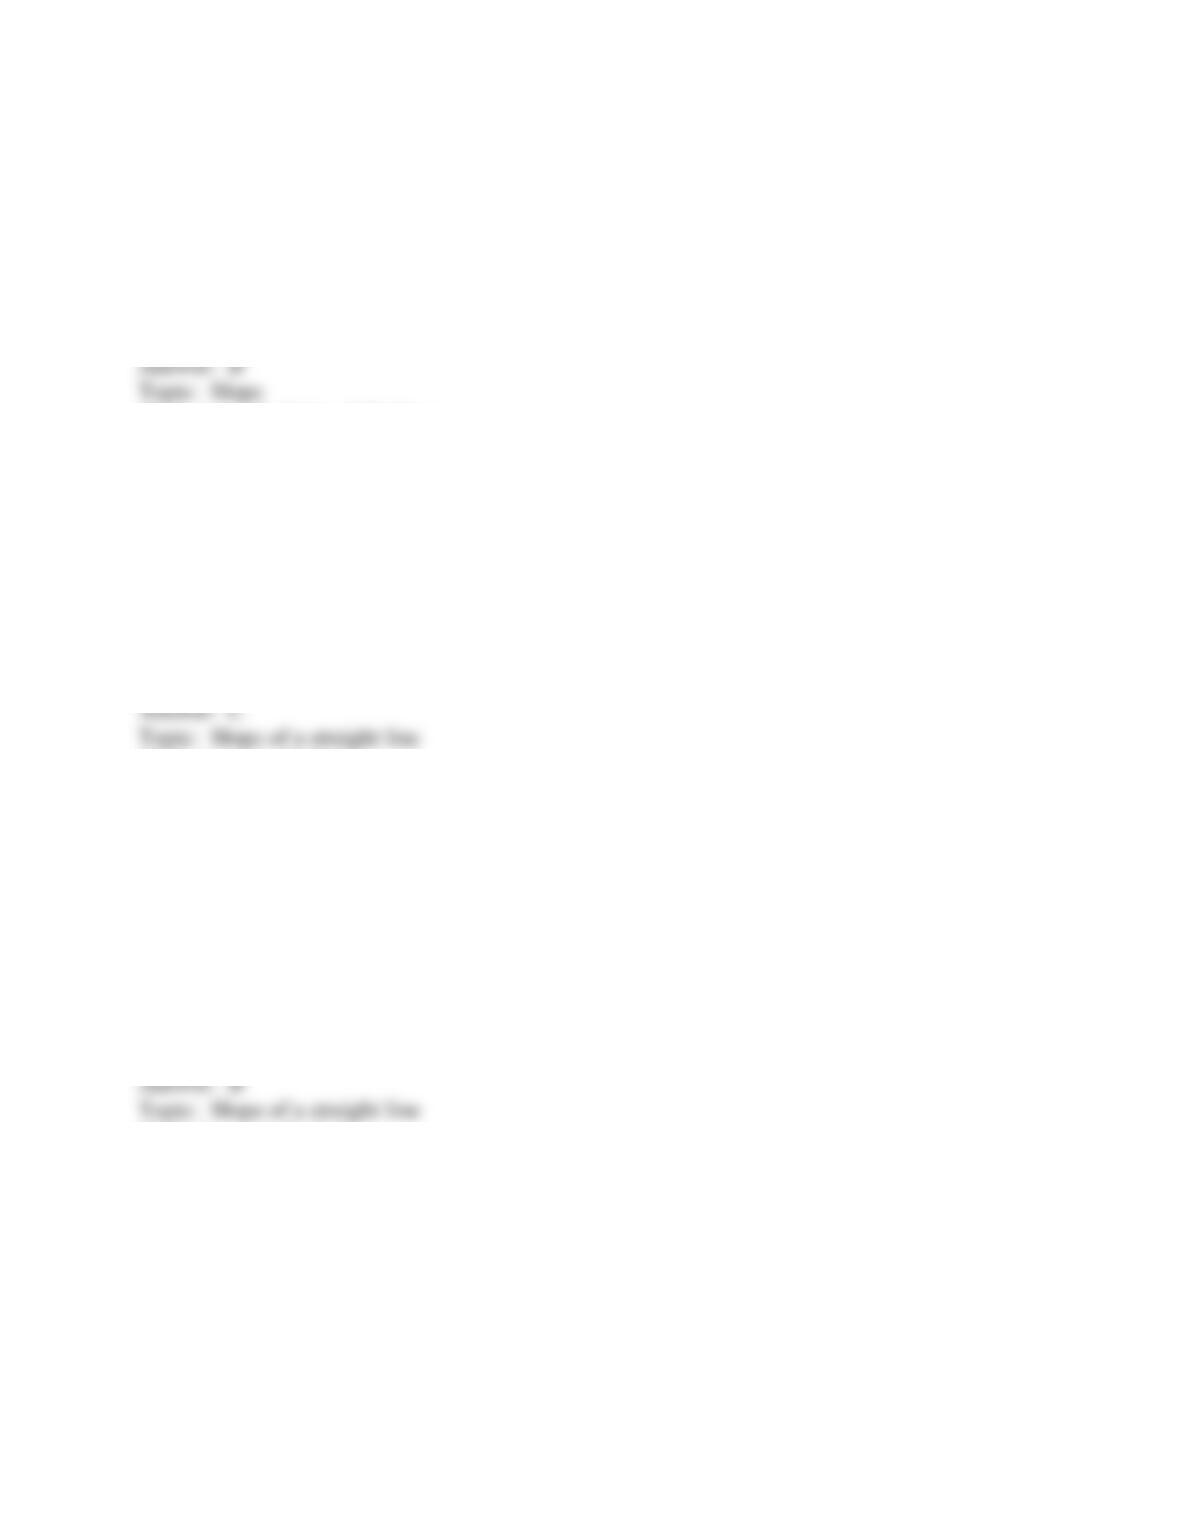
90
Copyright © 2011 Pearson Education, Inc.
92) The above figure shows the relationship between the price of a slice of pizza and how many
slices of pizza Ricardo buys in a week. Between points A and B, the slope of the line is ________
the slope of the line between points B and C.
A) greater than
B) equal to
C) less than
D) unrelated to
E) not comparable to
Skill: Level 2: Using definitions
Section: Chapter 1 Appendix – Checkpoint 3
Author: SA
AACSB: Analytical reasoning
93) Moving rightward along a straight line, the slope of the line
A) always increases.
B) always decreases.
C) stays the same.
D) increases if the line slopes upward to the right.
E) decreases if the line slopes downward to the right.
Skill: Level 1: Definition
Section: Chapter 1 Appendix – Checkpoint 3
Author: SB
AACSB: Analytical reasoning
94) A straight line falls when moving rightward along it. Hence the slope of the line is
A) positive.
B) negative.
C) undefined.
D) zero because it is a straight line.
E) perhaps positive, negative, or zero, but without more information it is impossible to
determine.
Skill: Level 1: Definition
Section: Chapter 1 Appendix – Checkpoint 3
Author: MR
AACSB: Analytical reasoning
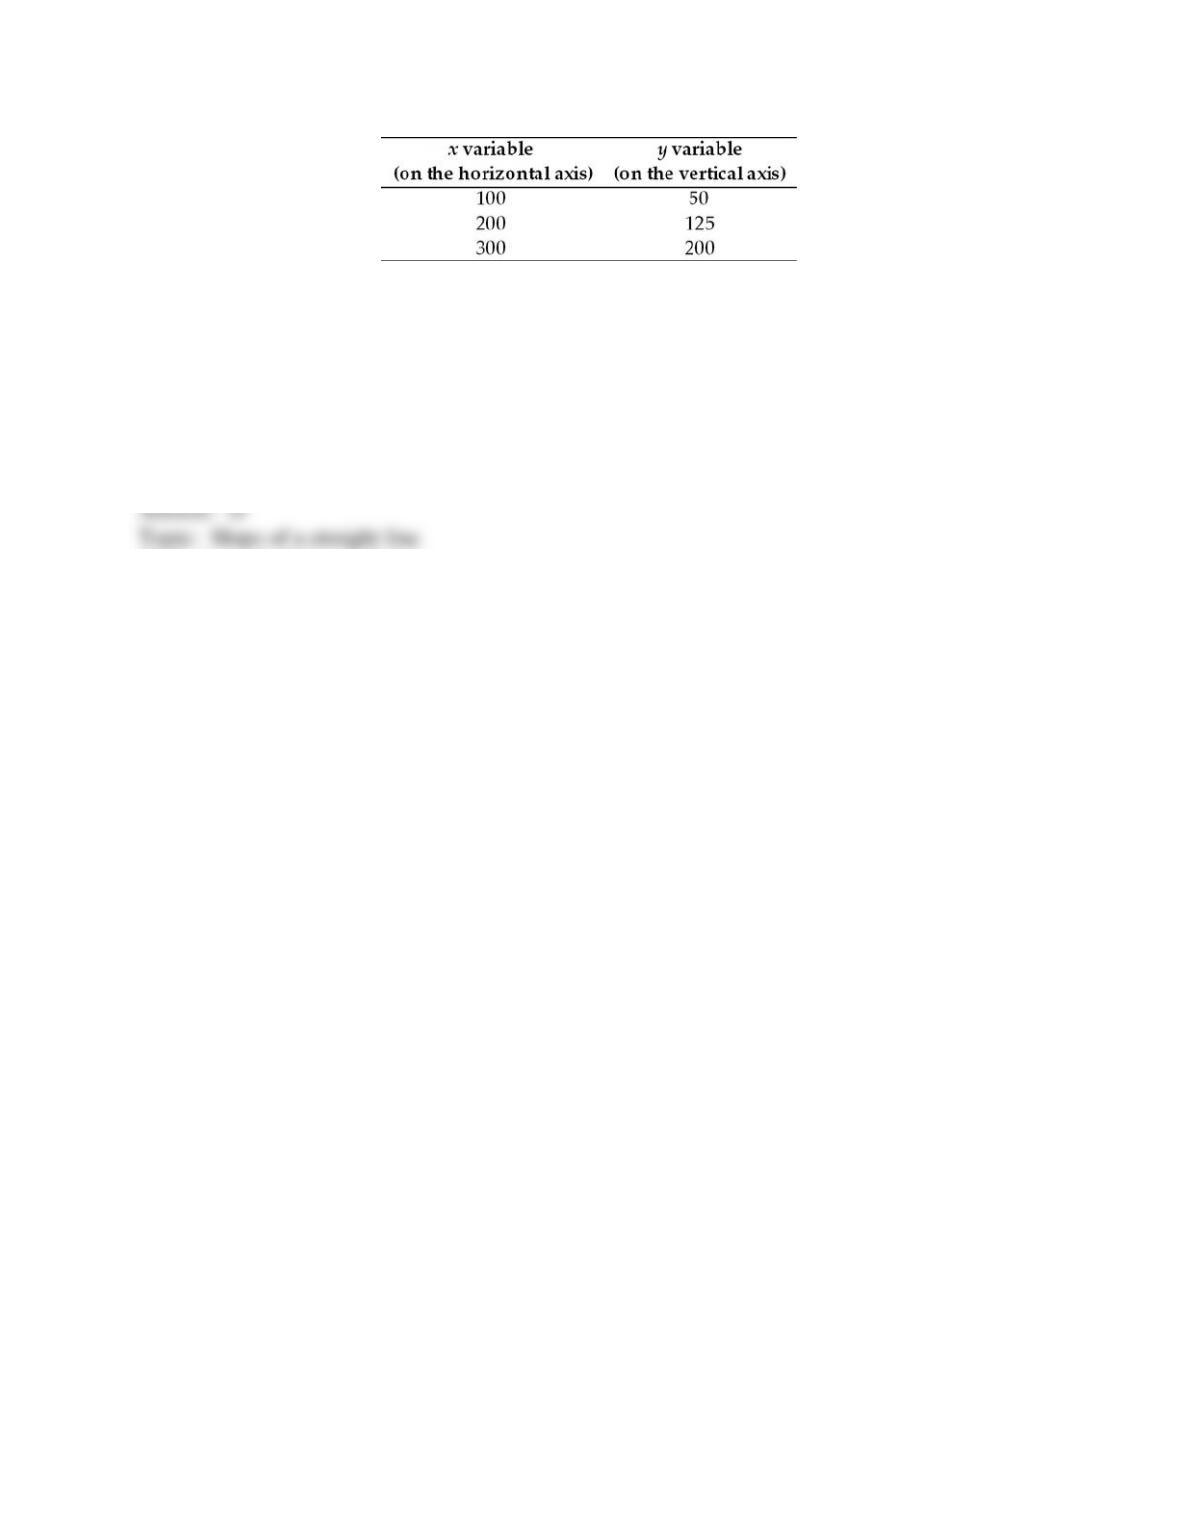
91
Copyright © 2011 Pearson Education, Inc.
95) The table above shows data on two variables. If these data were graphed, the slope of the line
would be
A) 1/2.
B) 4/3.
C) 2/3.
D) 3/4.
E) 2.
Skill: Level 2: Using definitions
Section: Chapter 1 Appendix – Checkpoint 3
Author: MR
AACSB: Analytical reasoning
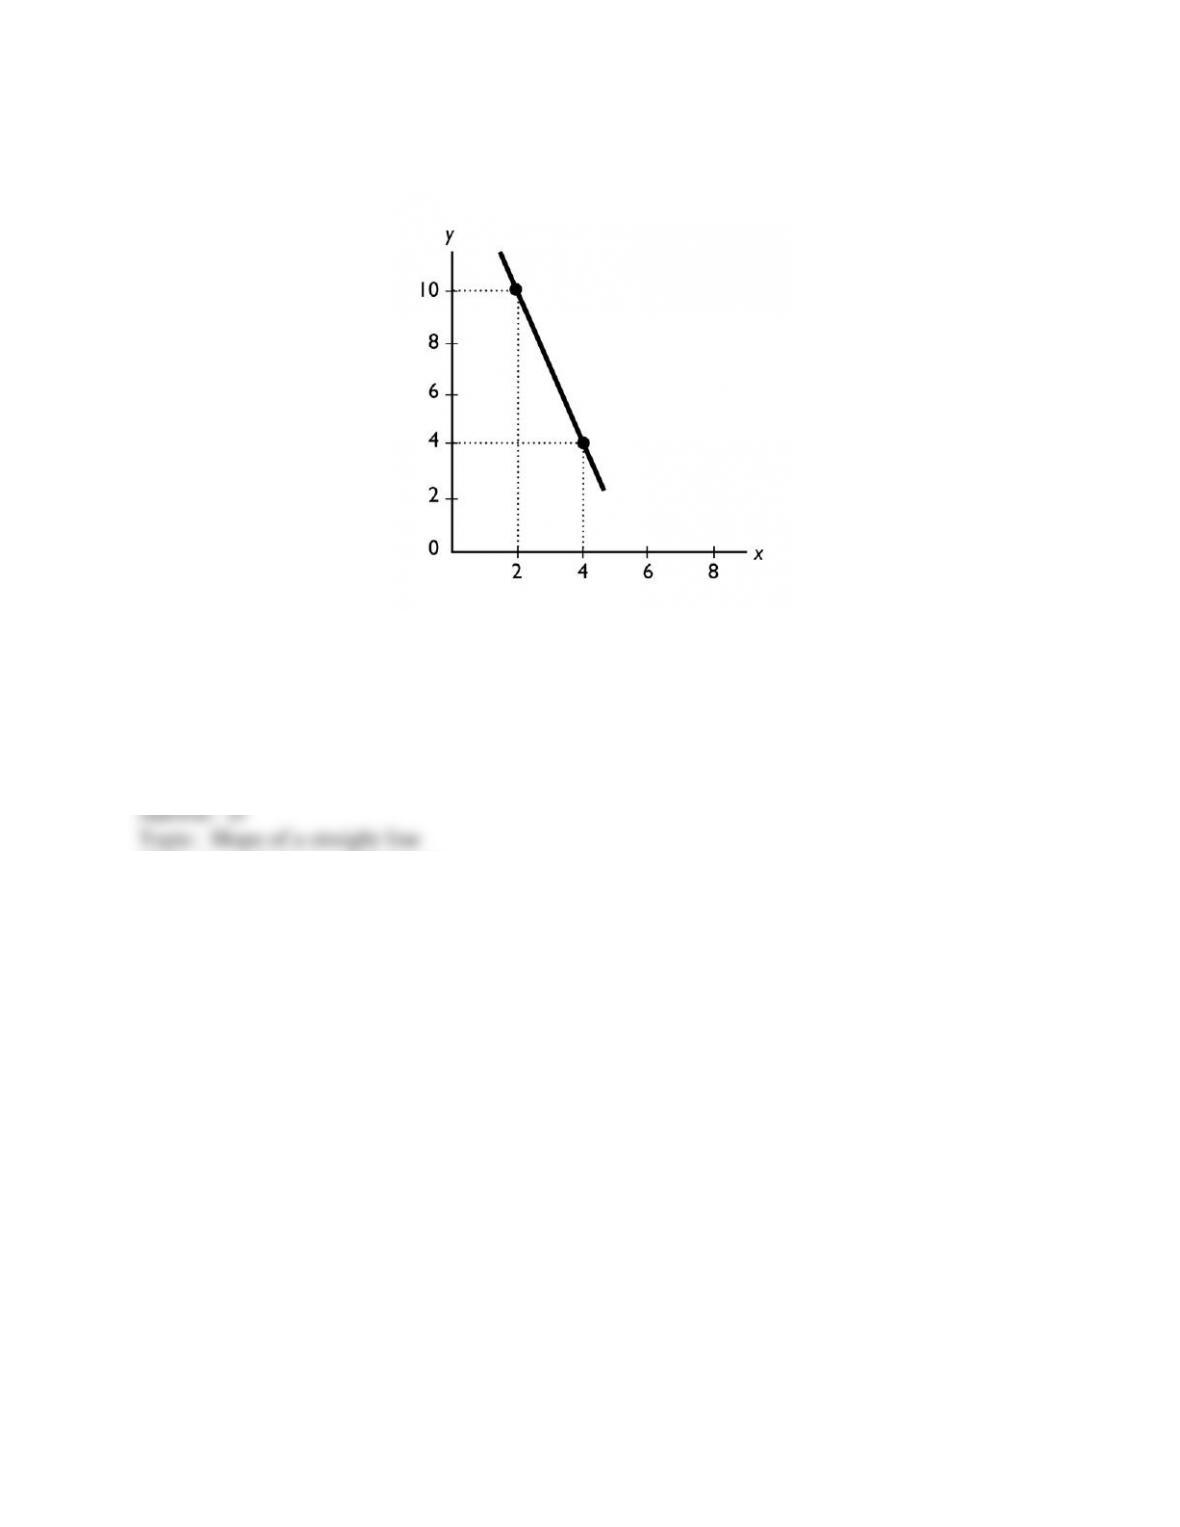
92
Copyright © 2011 Pearson Education, Inc.
96) The slope of the line shown in the above figure is
A) -1/3.
B) -5.
C) -1.
D) -3.
E) -10.
Skill: Level 2: Using definitions
Section: Chapter 1 Appendix – Checkpoint 3
Author: MR
AACSB: Analytical reasoning
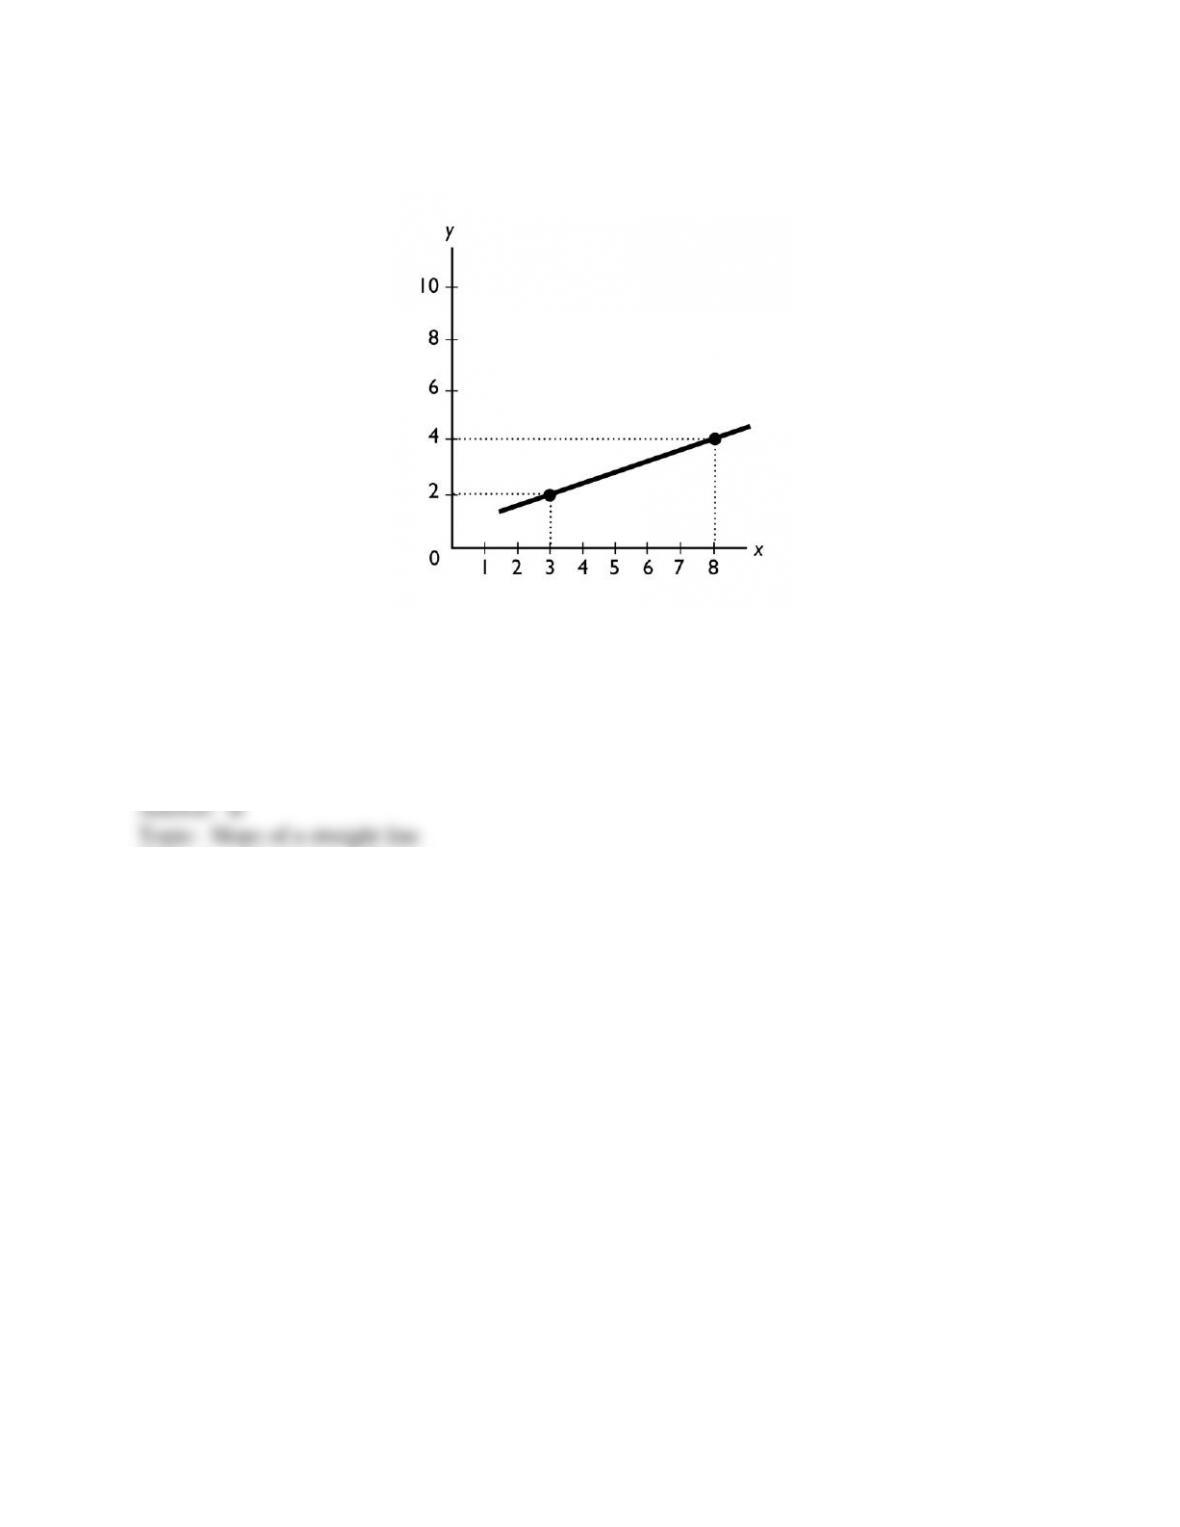
93
Copyright © 2011 Pearson Education, Inc.
97) The slope of the line shown in the above figure is
A) 5.
B) 2/5.
C) 2/3.
D) 5/2.
E) 2.
Skill: Level 2: Using definitions
Section: Chapter 1 Appendix – Checkpoint 3
Author: MR
AACSB: Analytical reasoning
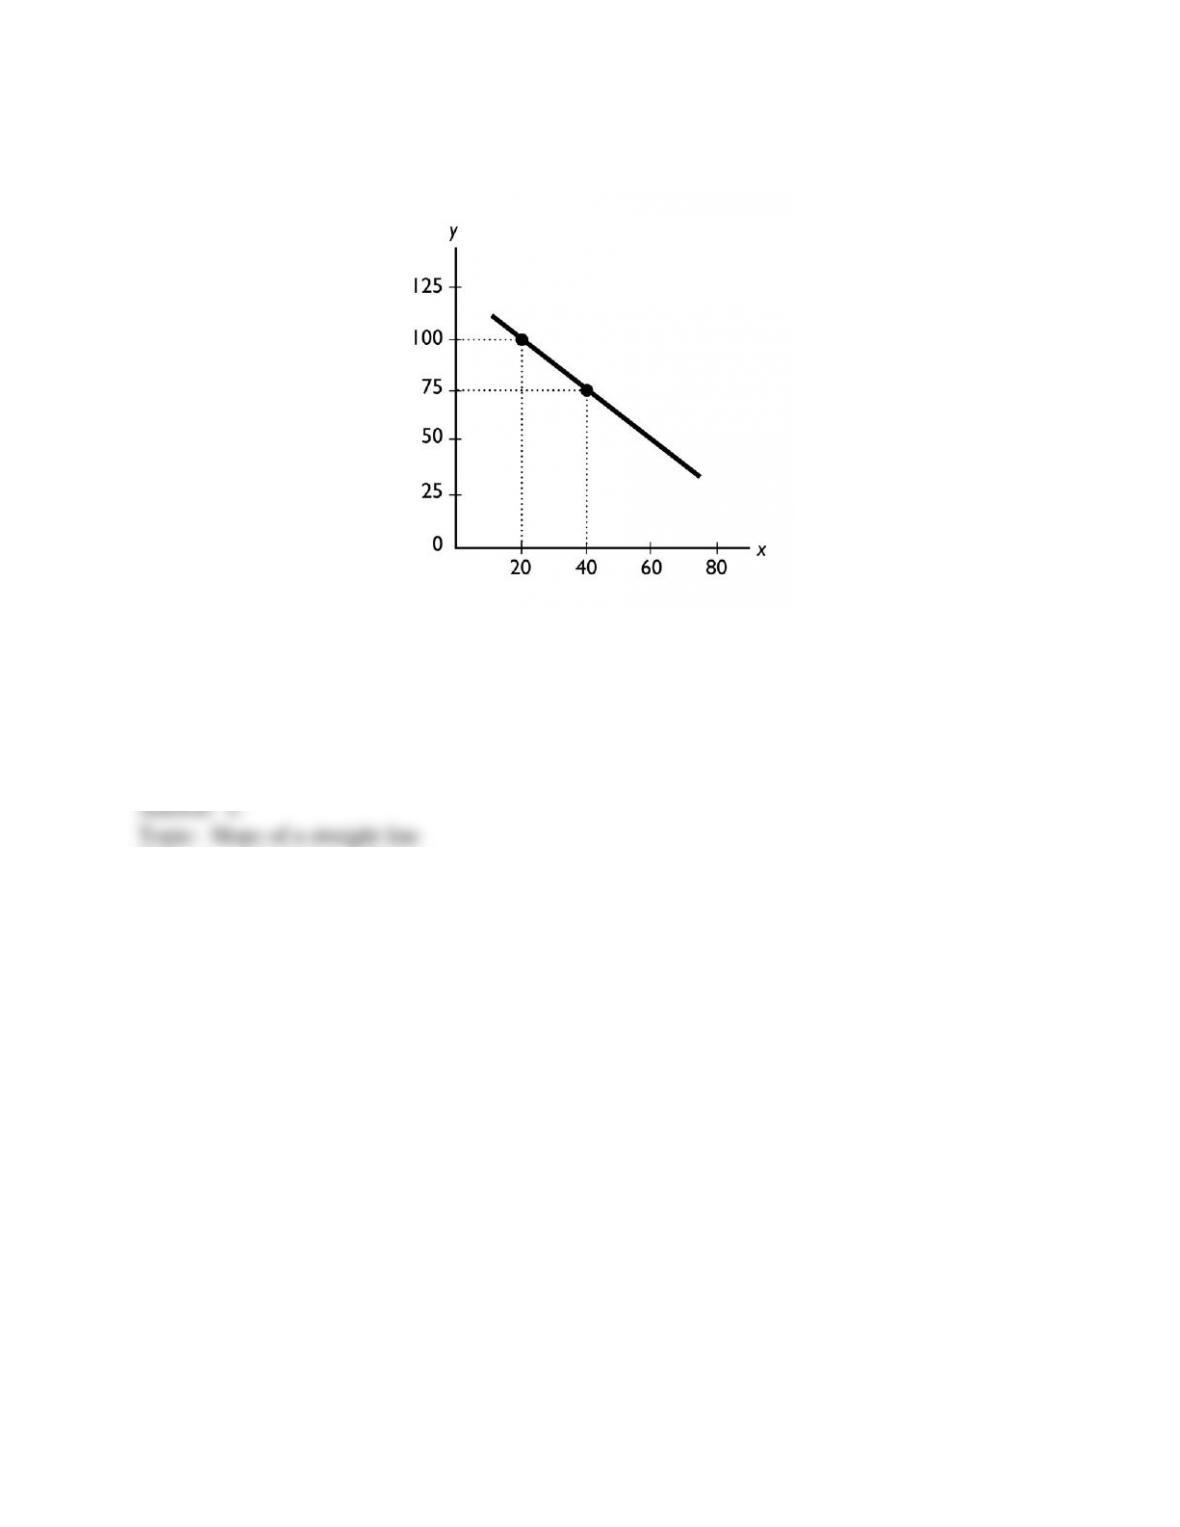
94
Copyright © 2011 Pearson Education, Inc.
98) The slope of the line shown in the above figure is
A) -1 1/3.
B) -1 2/3.
C) -1.25.
D) -0.80.
E) 5.
Skill: Level 2: Using definitions
Section: Chapter 1 Appendix – Checkpoint 3
Author: MR
AACSB: Analytical reasoning
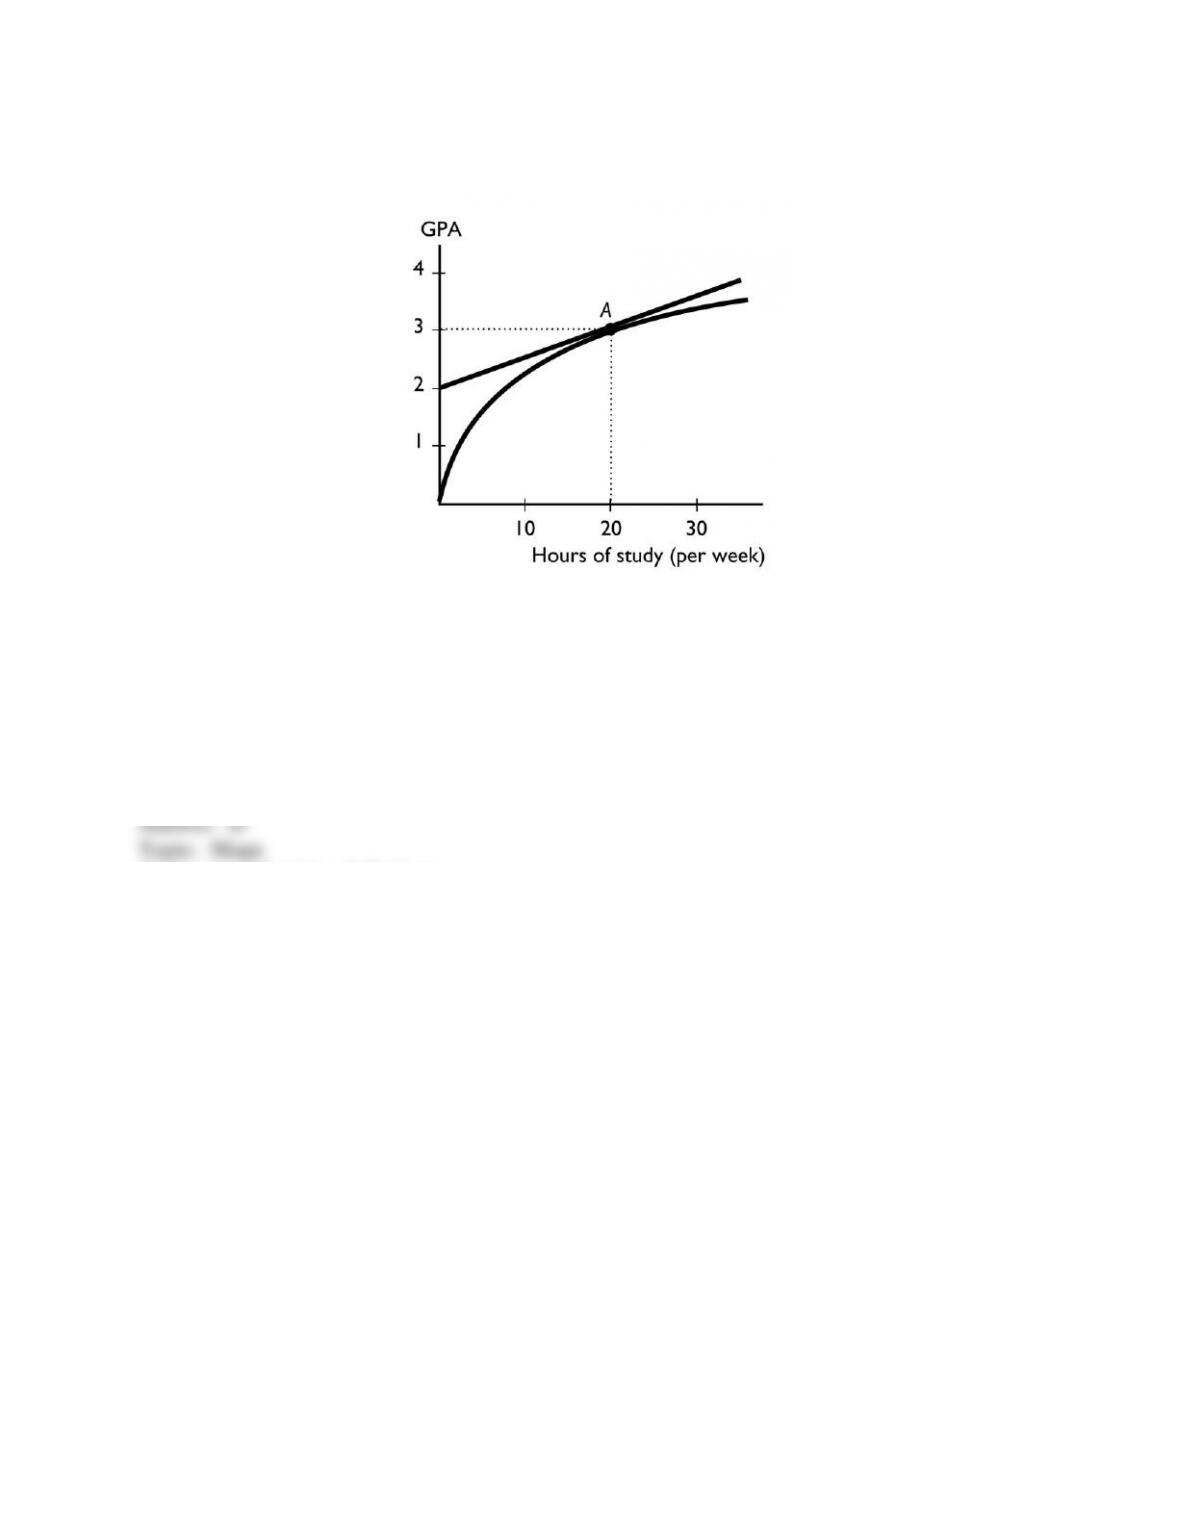
95
Copyright © 2011 Pearson Education, Inc.
99) The figure above shows the relationship between the time a student spends studying and the
student’s GPA that semester. The slope of the relationship at point A equals
A) 3.
B) 3/20
C) 2/20.
D) 1/20.
E) 0.
Skill: Level 2: Using definitions
Section: Chapter 1 Appendix – Checkpoint 3
Author: MR
AACSB: Analytical reasoning
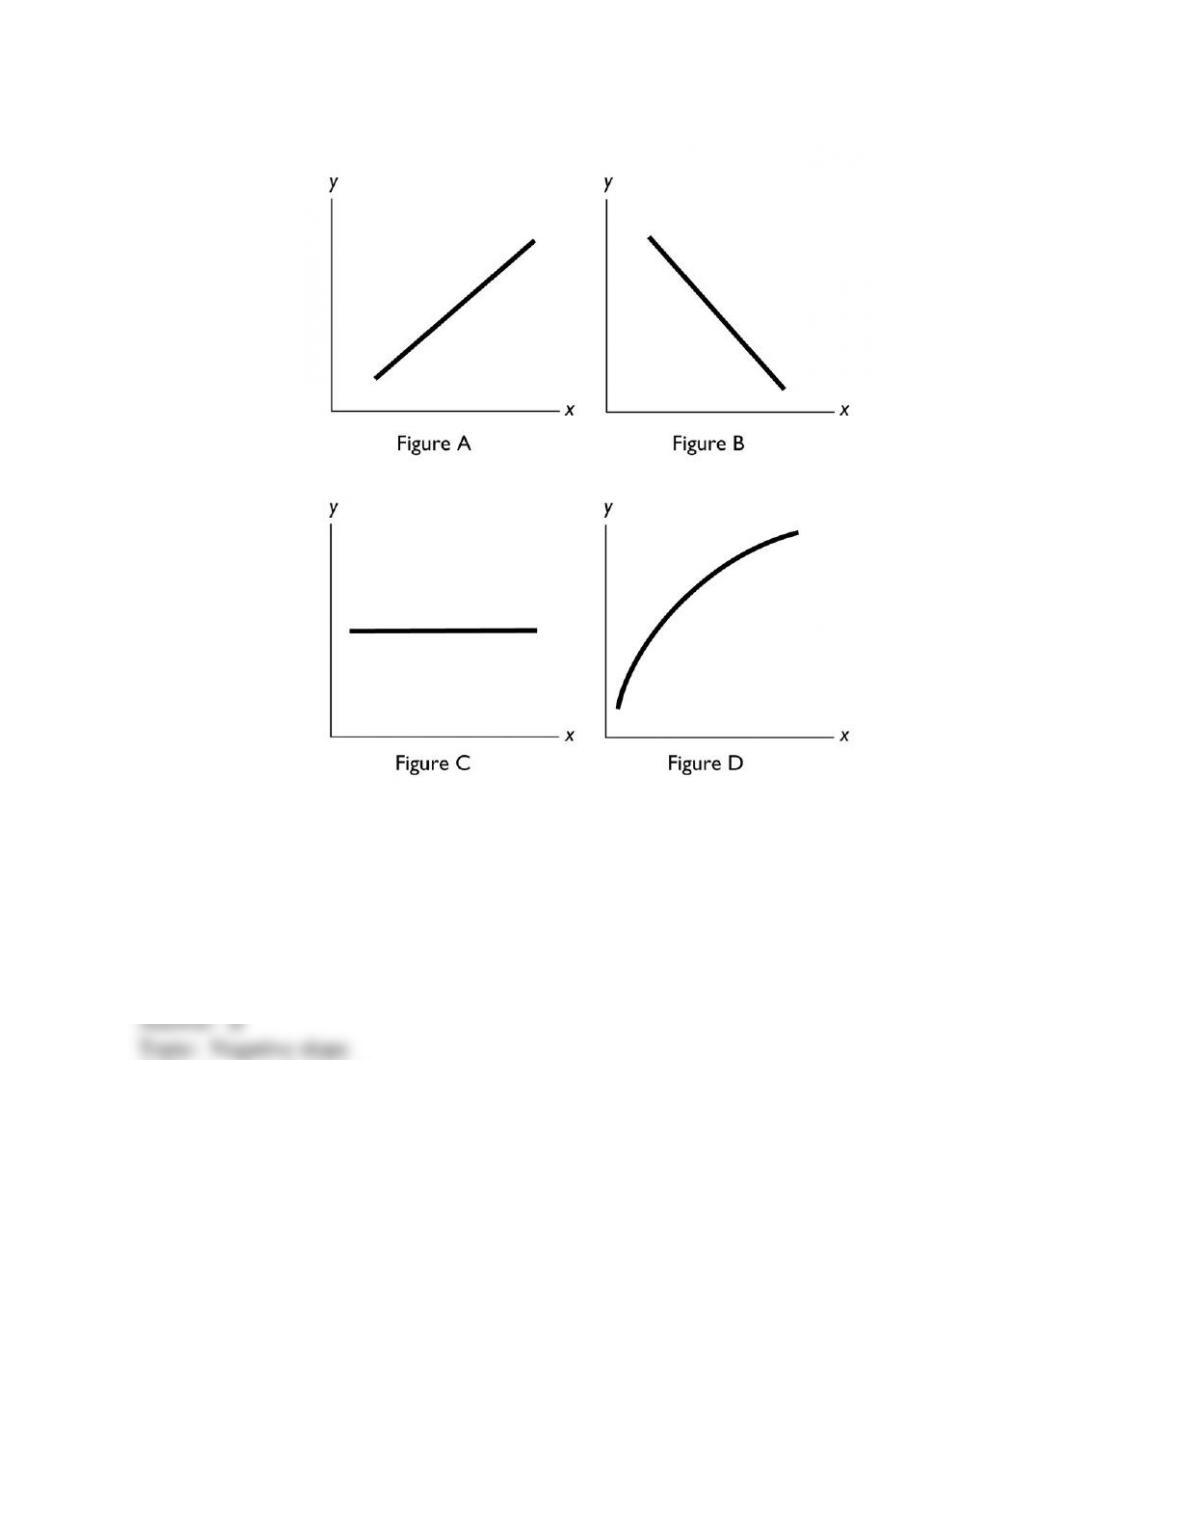
96
Copyright © 2011 Pearson Education, Inc.
100) In the above figure, which of the figures shows a relationship between x and y with a
negative slope?
A) Figure A
B) Figure B
C) Figure C
D) Figure D
E) Both Figure A and Figure B
Skill: Level 1: Definition
Section: Chapter 1 Appendix – Checkpoint 3
Author: MR
AACSB: Analytical reasoning
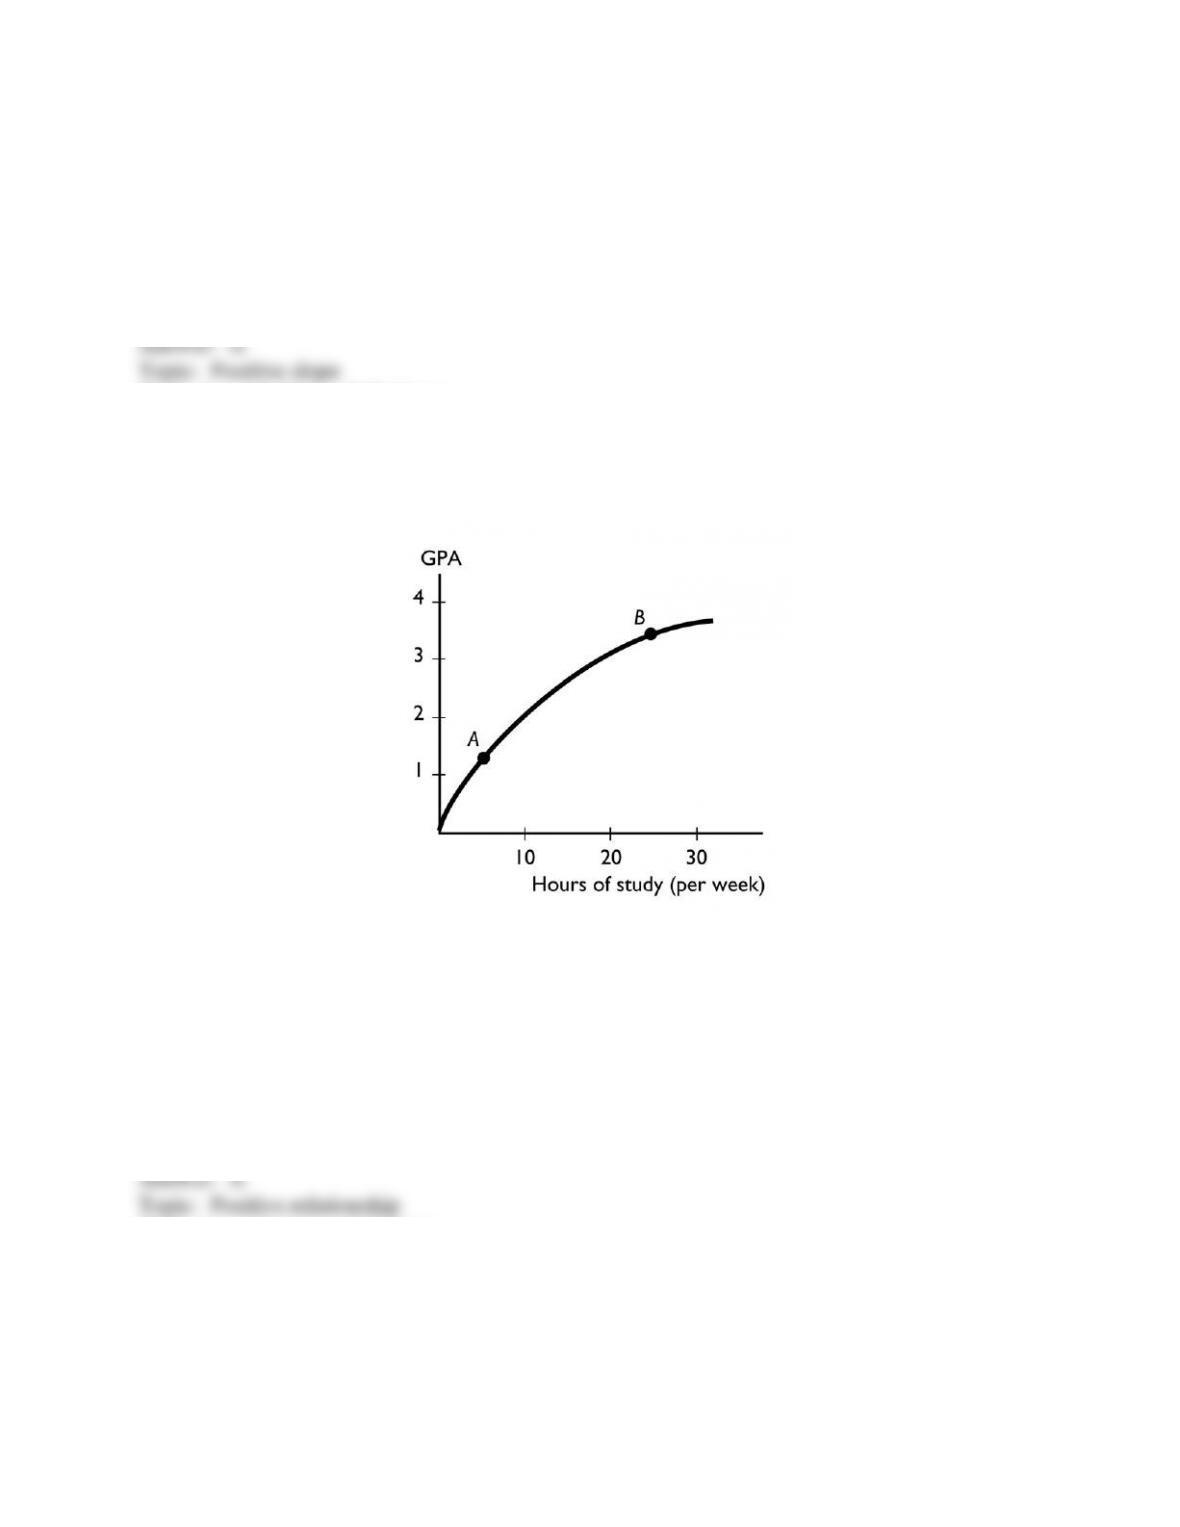
97
Copyright © 2011 Pearson Education, Inc.
101) In the above figure, which of the figures show(s) a relationships between x and y with a
positive slope?
A) Figure A and Figure D
B) Figure B and Figure C
C) Figure C only
D) Figure D only
E) Figure A and Figure B
Skill: Level 2: Using definitions
Section: Chapter 1 Appendix – Checkpoint 3
Author: MR
AACSB: Analytical reasoning
102) The figure above shows the relationship between the time a student spends studying and the
student’s GPA that semester. This figure shows ________ relationship between the time spent
studying and the GPA.
A) a positive but not linear
B) a negative
C) no
D) a positive, linear
E) cross-sectionally trended
Skill: Level 2: Using definitions
Section: Chapter 1 Appendix – Checkpoint 3
Author: MR
AACSB: Analytical reasoning

98
Copyright © 2011 Pearson Education, Inc.
103) The figure above shows the relationship between the time a student spends studying and the
student’s GPA that semester. The slope of the relationship at point A ________ the slope at point
B.
A) is greater than
B) is less than
C) is equal to
D) cannot be compared to
E) can be compared but more information is needed to determine whether the slope is greater
than, less than, or equal to
Skill: Level 3: Using models
Section: Chapter 1 Appendix – Checkpoint 3
Author: MR
AACSB: Analytical reasoning
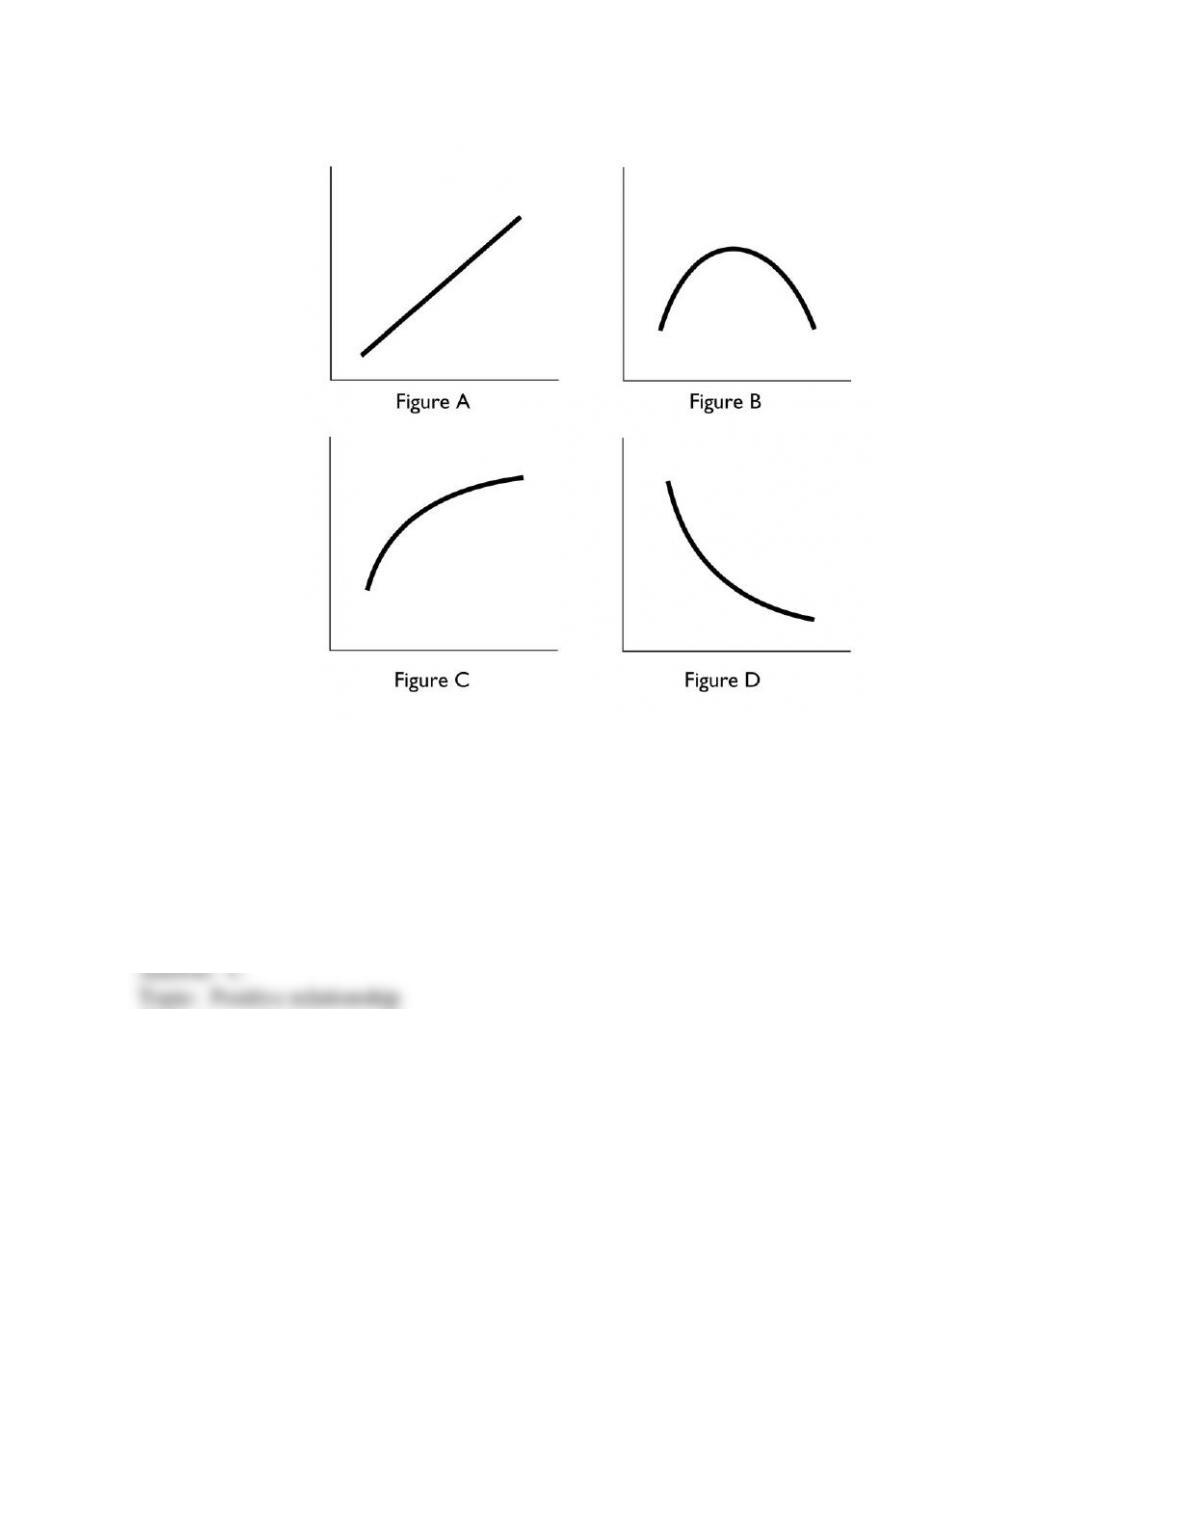
99
Copyright © 2011 Pearson Education, Inc.
104) In the above, which figure(s) show relationship between the variables that is always
positive?
A) Figure A only
B) Figures C and D
C) Figures A and C
D) Figures A, C, and D
E) Figures A and B
Skill: Level 3: Using models
Section: Chapter 1 Appendix – Checkpoint 3
Author: SA
AACSB: Analytical reasoning
100
Copyright © 2011 Pearson Education, Inc.
105) In the above, which figure(s) show a relationship between the variables that is always
negative?
A) Figure A only
B) Figure D only
C) Figures A and C
D) Figures A, C, and D
E) Figure B only
Skill: Level 3: Using models
Section: Chapter 1 Appendix – Checkpoint 3
Author: MR
AACSB: Analytical reasoning
106) In the above, which figure shows both a positive and a negative relationship between the
variables?
A) Figure A
B) Figure B
C) Figure C
D) Figure D
E) Figure A, B, and D
Skill: Level 3: Using models
Section: Chapter 1 Appendix – Checkpoint 3
Author: MR
AACSB: Analytical reasoning
107) In the above, which figure(s) has at least one point at which the slope equals zero?
A) Figure B only
B) Figures A and C
C) Figure D only
D) Figures A, C, and D
E) Figures A and D
Skill: Level 3: Using models
Section: Chapter 1 Appendix – Checkpoint 3
Author: SA
AACSB: Analytical reasoning
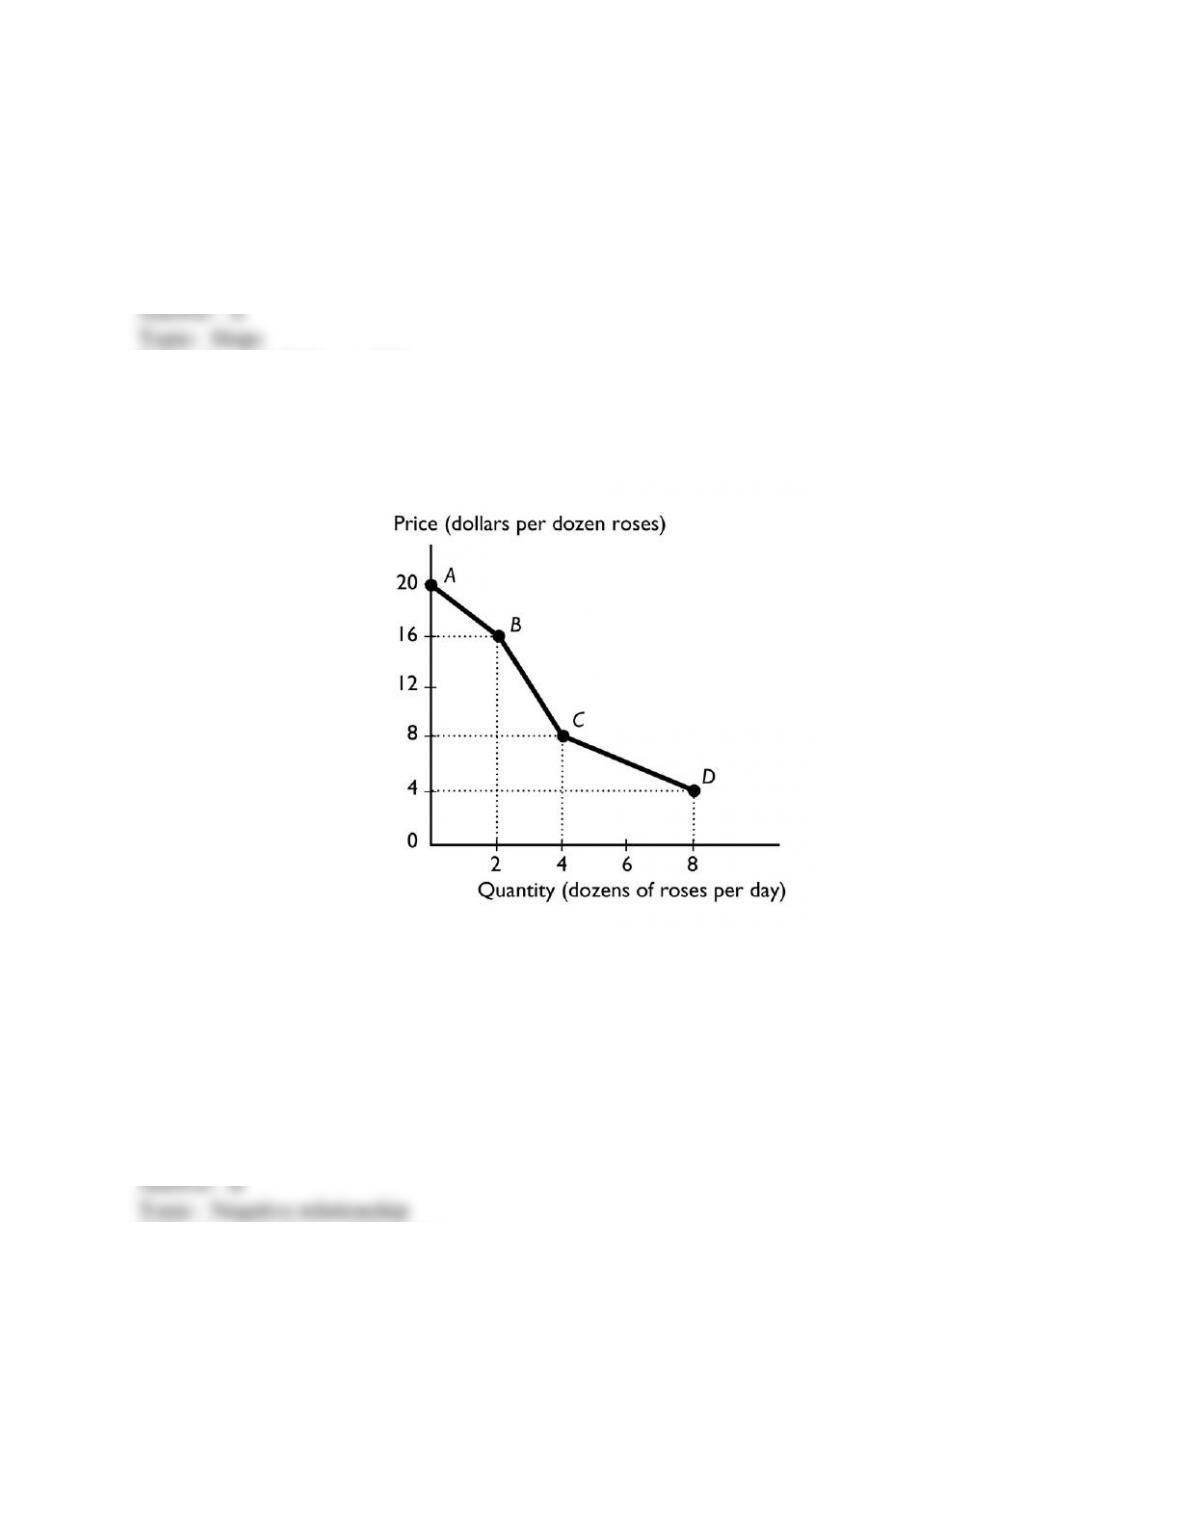
101
Copyright © 2011 Pearson Education, Inc.
108) In the above, in which figure(s) is the slope the same at every point?
A) Figure A only
B) Figures A and C
C) Figure B only
D) Figures A, C, and D
E) Figures C and D
Skill: Level 3: Using models
Section: Chapter 1 Appendix – Checkpoint 3
Author: SA
AACSB: Analytical reasoning
109) The figure above shows the relationship between the price of a dozen roses and the quantity
of roses a florist can sell. The relationship between the price and the quantity the florist can sell
is
A) positive.
B) negative.
C) nonexistent.
D) linear.
E) cross-sectionally trended.
Skill: Level 2: Using definitions
Section: Chapter 1 Appendix – Checkpoint 3
Author: SA
AACSB: Analytical reasoning
102
Copyright © 2011 Pearson Education, Inc.
110) The figure above shows the relationship between the price of a dozen roses and the quantity
of roses a florist can sell. The slope between points A and B is
A) 20.
B) 16.
C) 2.
D) 4
E) nonexistent because at point A, 0 roses are sold.
Skill: Level 3: Using models
Section: Chapter 1 Appendix – Checkpoint 3
Author: SA
AACSB: Analytical reasoning
111) The figure above shows the relationship between the price of a dozen roses and the quantity
of roses a florist can sell. The slope between points B and C equals
A) 16.
B) 8.
C) 4.
D) 2.
E) 14.
Skill: Level 3: Using models
Section: Chapter 1 Appendix – Checkpoint 3
Author: SA
AACSB: Analytical reasoning
112) The figure above shows the relationship between the price of a dozen roses and the quantity
of roses a florist can sell. The slope between points C and D equals
A) 8.
B) 4.
C) 2.
D) 1.
E) 12
Skill: Level 3: Using models
Section: Chapter 1 Appendix – Checkpoint 3
Author: SA
AACSB: Analytical reasoning
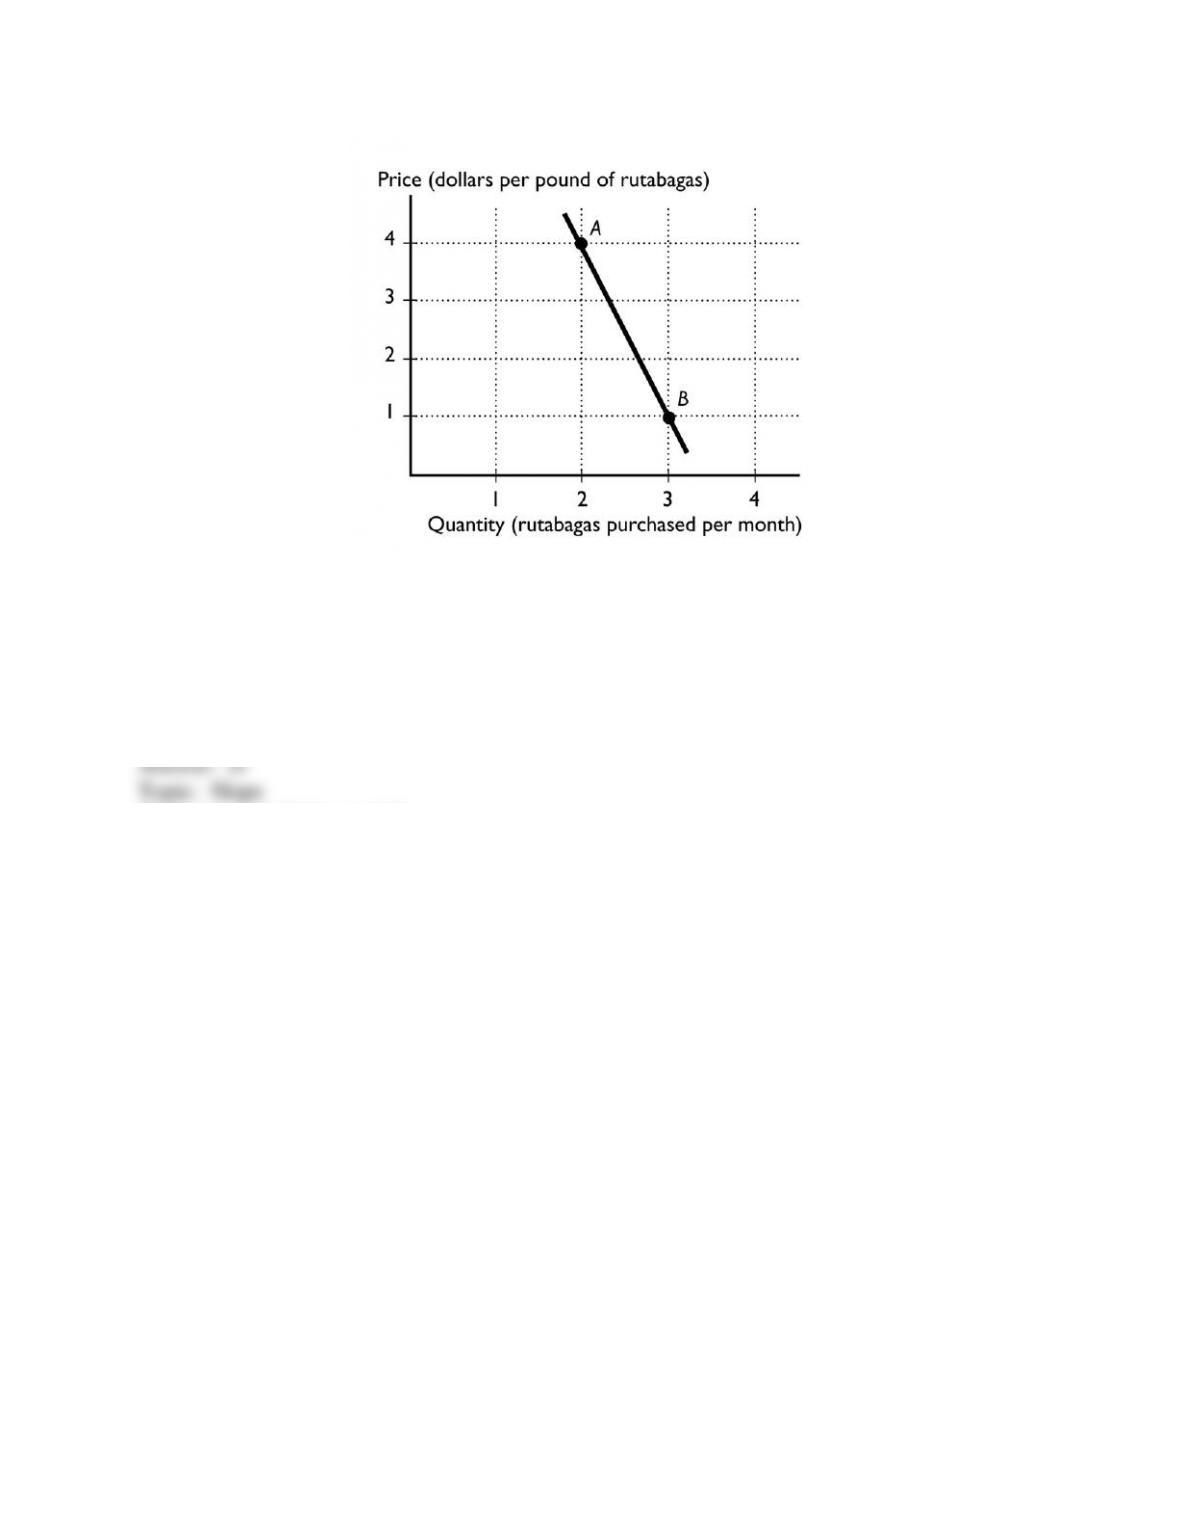
103
Copyright © 2011 Pearson Education, Inc.
113) In the figure above, between points A and B, what is the slope of the line?
A) 4
B) 1
C) 3
D) -3
E) 0
Skill: Level 3: Using models
Section: Chapter 1 Appendix – Checkpoint 3
Author: STUDY GUIDE
AACSB: Analytical reasoning
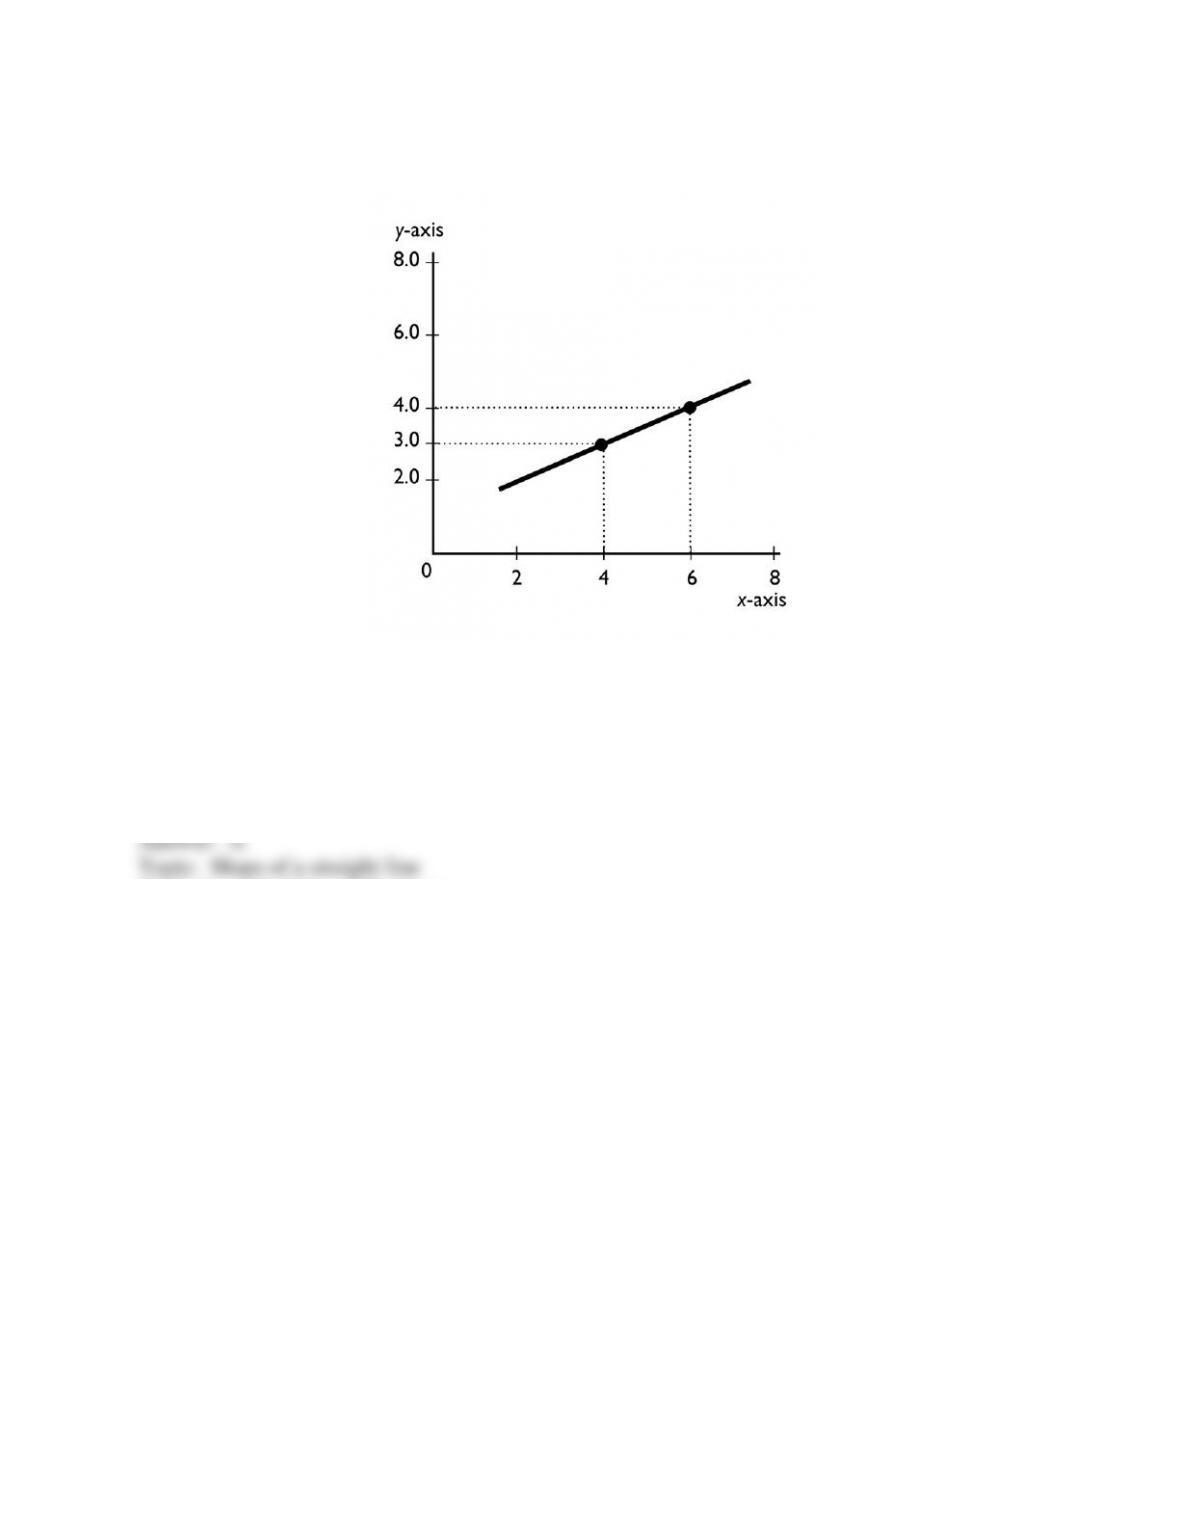
104
Copyright © 2011 Pearson Education, Inc.
114) What is the slope of the line in the graph?
A) +1/2
B) -1/2
C) + 2
D) -2
E) -3/4
Skill: Level 2: Using definitions
Section: Chapter 1 Appendix – Checkpoint 3
Author: MyEconLab Web Site
AACSB: Analytical reasoning
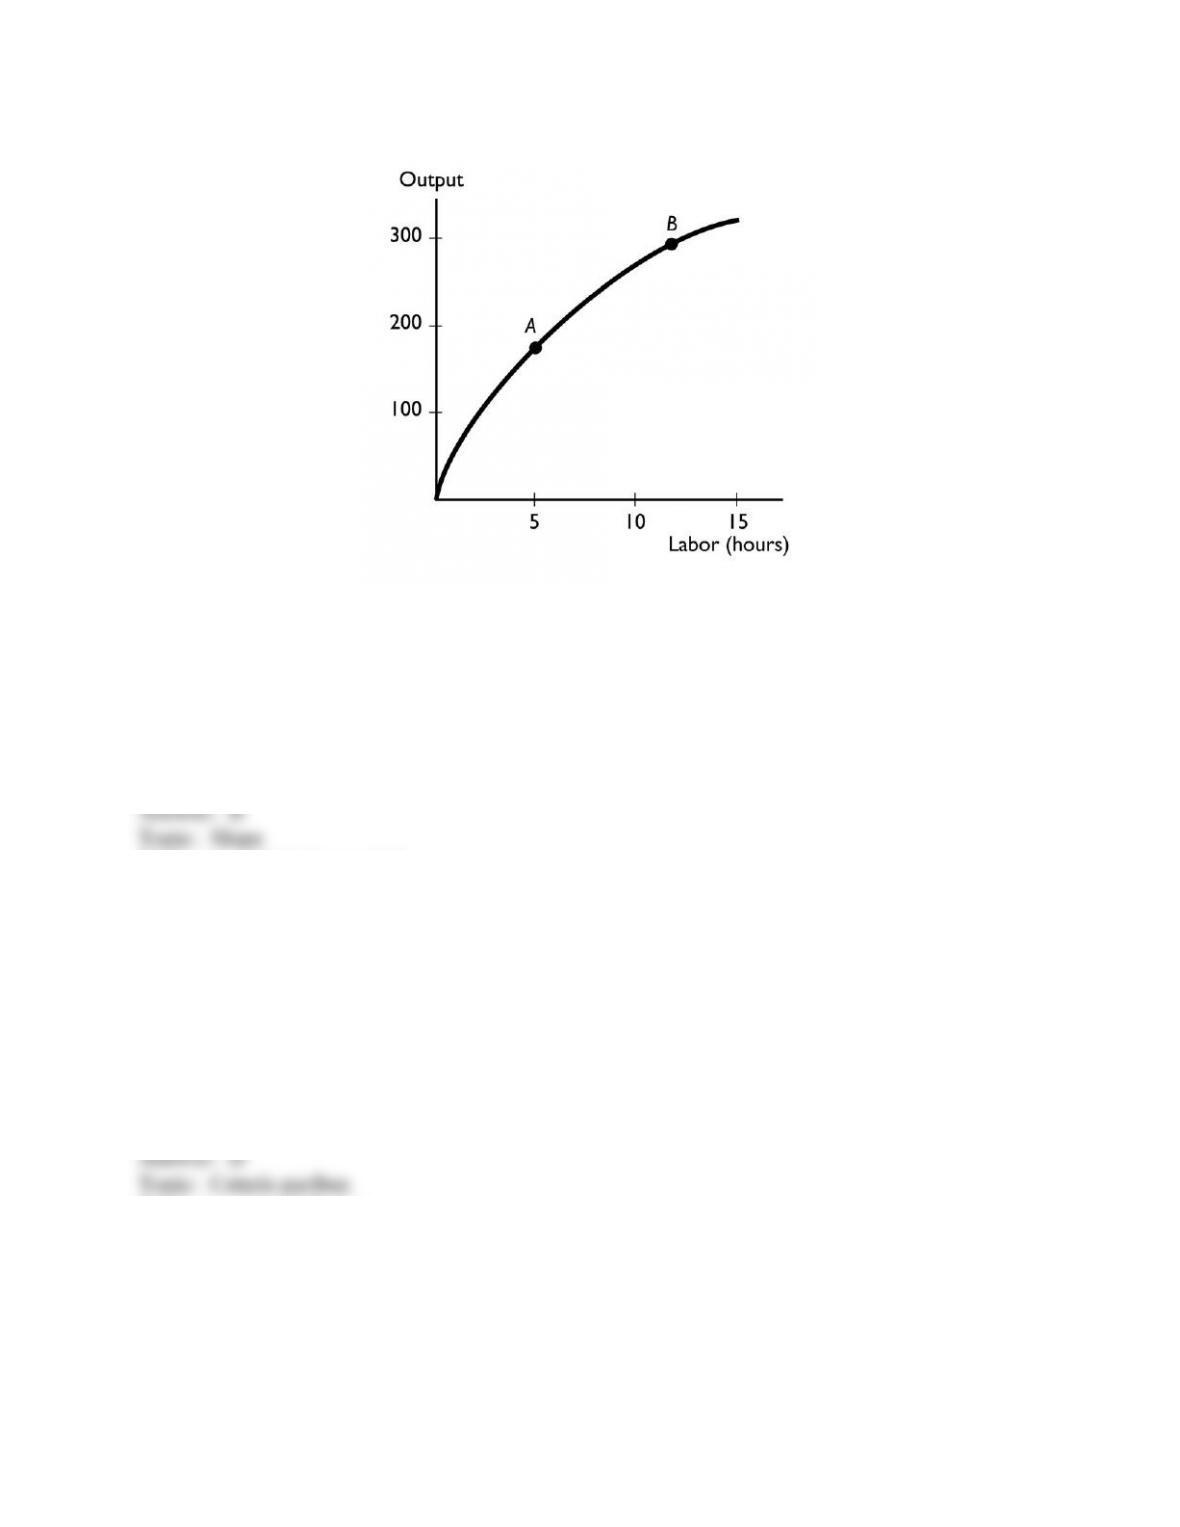
105
Copyright © 2011 Pearson Education, Inc.
115) The slope of the curve at point B
A) is greater than the slope at point A.
B) is less than the slope at point A.
C) is equal to the slope at point A.
D) cannot be compared with the slope at point A.
E) can be compared with the slope at point A but more information is needed to determine if the
slope is greater than, less than, or equal to the slope at point A.
Skill: Level 3: Using models
Section: Chapter 1 Appendix – Checkpoint 3
Author: MyEconLab Web Site
AACSB: Analytical reasoning
116) To graph a relationship involving more than two variables, we use which assumption?
A) rational decision making
B) post hoc
C) marginal analysis
D) ceteris paribus
E) trend assumption
Skill: Level 1: Definition
Section: Chapter 1 Appendix – Checkpoint 4
Author: SB
AACSB: Analytical reasoning
106
Copyright © 2011 Pearson Education, Inc.
117) To graph a relationship among several variables, we hold all but ________ variable(s)
constant and use the ________ assumption.
A) one; scarcity
B) two; ceteris paribus
C) three; scarcity
D) one; ceteris paribus
E) one; absence of trend
Skill: Level 1: Definition
Section: Chapter 1 Appendix – Checkpoint 4
Author: MR
AACSB: Analytical reasoning
118) We are investigating the relationship among three variables. We have graphed two of them.
Suppose that the variable that is not measured on the x-axis or the y-axis changes. Then, there is
A) a movement along the plotted curve.
B) a shift in the plotted curve.
C) no impact on the plotted curve because the variable is not measured on either of the axes.
D) an omitted variable.
E) a violation of the absence of trend assumption.
Skill: Level 1: Definition
Section: Chapter 1 Appendix – Checkpoint 4
Author: SA
AACSB: Analytical reasoning
119) When analyzing graphically the relationship between more than two variables, which of the
following must be used?
A) positive slope assumption
B) assumption of little change
C) ceteris paribus
D) negative slope assumption
E) the assumption that only relevant factors change
Skill: Level 2: Using definitions
Section: Chapter 1 Appendix – Checkpoint 4
Author: PH
AACSB: Analytical reasoning
107
Copyright © 2011 Pearson Education, Inc.
120) Ceteris paribus when graphing a relationship refers to
A) letting all the variables change at once.
B) changing the origin of the graph.
C) holding constant all but two variables.
D) rescaling the coordinates.
E) swapping the axes so that the x-axis is the vertical axis and the y-axis is the horizontal axis.
Skill: Level 2: Using definitions
Section: Chapter 1 Appendix – Checkpoint 4
Author: MR
AACSB: Analytical reasoning
121) When two variables in a graph are related to a third, changing the third causes
A) a movement along the curve.
B) a shift of the curve.
C) no change in the curve because the third variable isn’t on the axes.
D) either a shift or a movement in the curve but more information is needed to determine which
occurs.
E) None of the above answers is correct.
Skill: Level 2: Using definitions
Section: Chapter 1 Appendix – Checkpoint 4
Author: SB
AACSB: Analytical reasoning
122) On a graph showing the relationship between x and y, the ceteris paribus condition implies
that
A) no other variables are related to x and y.
B) the value of x is held constant.
C) the value of y is held constant.
D) other variables not shown are held constant.
E) the value of x and the value of y are held constant.
Skill: Level 2: Using definitions
Section: Chapter 1 Appendix – Checkpoint 4
Author: MR
AACSB: Analytical reasoning
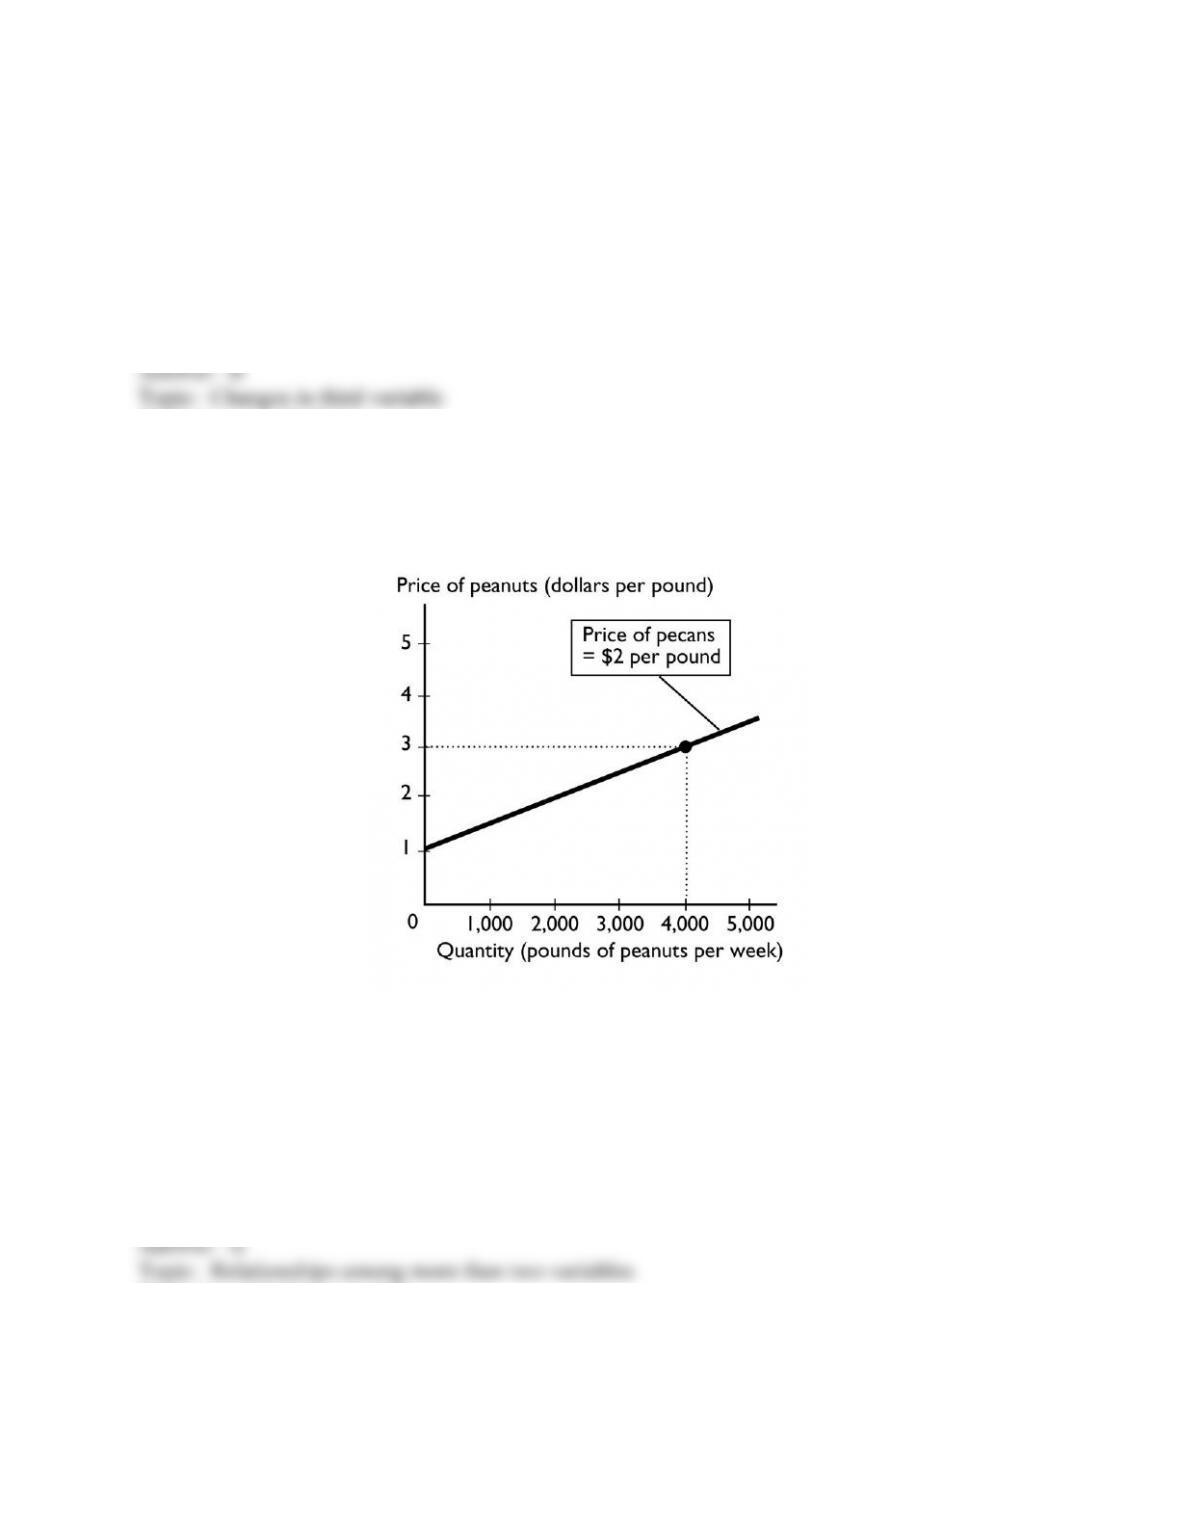
108
Copyright © 2011 Pearson Education, Inc.
123) Three variables are related and two of them are plotted in a figure. If the variable that is not
measured on either the x-axis or the y-axis changes, then there is
A) a movement along the drawn curve.
B) a shift in the curve.
C) no impact on the curve because the variable is not measured on either of the axes.
D) either a shift in the curve or a movement along the curve but more information is needed to
determine which.
E) None of the above answers are correct.
Skill: Level 1: Definition
Section: Chapter 1 Appendix – Checkpoint 4
Author: SA
AACSB: Analytical reasoning
124) The above figure shows how many pounds of peanuts farmers are willing to sell at different
prices per pound of peanuts. If the price of a pound of peanuts is $1 and the price of a pound of
pecans is $2, peanut farmers are willing to sell
A) no peanuts.
B) 1000 pounds of peanuts.
C) 2000 pounds of peanuts.
D) 4000 pounds of peanuts.
E) more than 4000 pounds of peanuts.
Skill: Level 3: Using models
Section: Chapter 1 Appendix – Checkpoint 4
Author: MR
AACSB: Analytical reasoning
109
Copyright © 2011 Pearson Education, Inc.
125) In the above figure, while drawing the line showing the relationship between the price of a
pound of peanuts and the quantity sold, the
A) price of a pound of pecans does not change.
B) price of a pound of peanuts does not change.
C) the quantity of peanuts that farmers supply does not change.
D) Both answers A and B are correct.
E) Both answers B and C are correct.
Skill: Level 3: Using models
Section: Chapter 1 Appendix – Checkpoint 4
Author: MR
AACSB: Analytical reasoning
126) In the figure above, suppose the price of a pound of pecans is negatively related to the
quantity of peanuts that farmers are willing to supply. If the price of pecans increases,
A) the curve will shift rightward.
B) the curve will shift leftward.
C) there is a movement along the curve.
D) the curve will be unaffected.
E) None of the above answers is correct because the graph assumes that the price of pecans does
not change.
Skill: Level 3: Using models
Section: Chapter 1 Appendix – Checkpoint 4
Author: MR
AACSB: Analytical reasoning
127) To graph a relationship that involves more than two variables, we use
A) a positive relationship.
B) a direct relationship.
C) a negative relationship.
D) ceteris paribus.
E) movement up along one of the lines showing the relationship between x and y.
Skill: Level 1: Definition
Section: Chapter 1 Appendix – Checkpoint 4
Author: MyEconLab Web Site
AACSB: Analytical reasoning
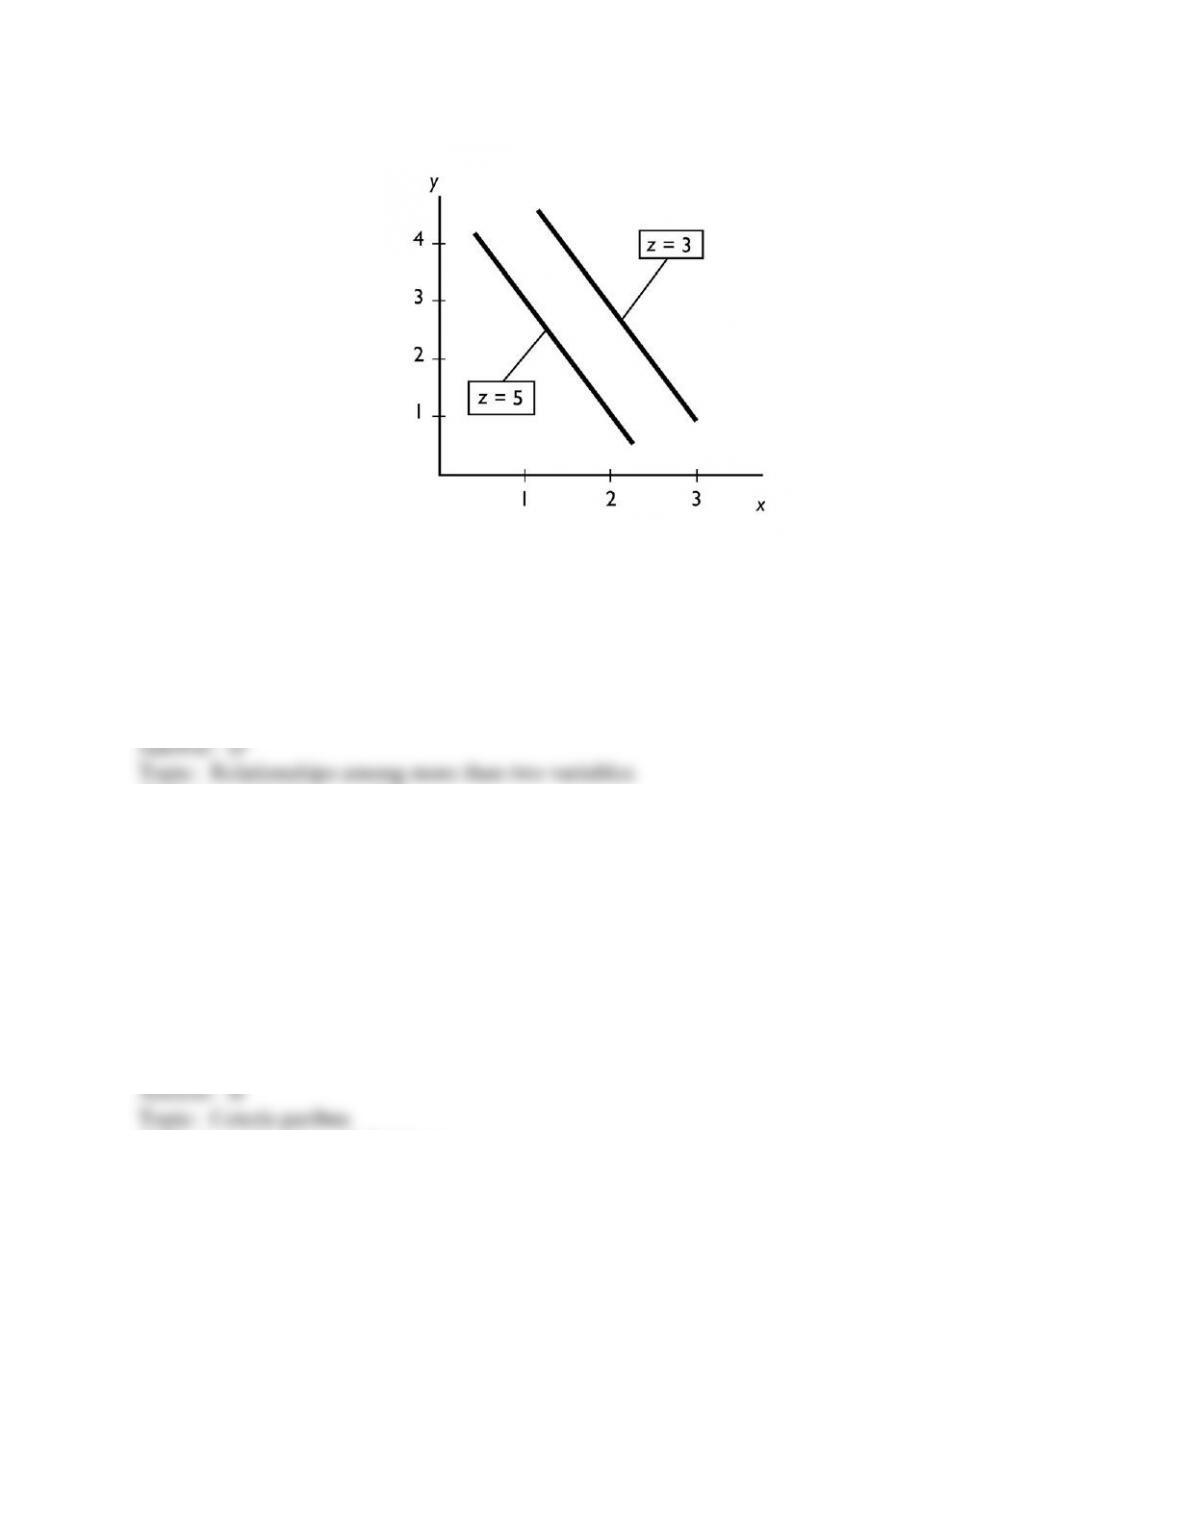
110
Copyright © 2011 Pearson Education, Inc.
128) In the figure above, an increase in z leads to a
A) movement up along one of the lines showing the relationship between x and y.
B) movement down along one of the lines showing the relationship between x and y.
C) rightward shift of the line showing the relationship between x and y.
D) leftward shift of the line showing the relationship between x and y.
E) trend change in both x and y.
Skill: Level 3: Using models
Section: Chapter 1 Appendix – Checkpoint 4
Author: STUDY GUIDE
AACSB: Analytical reasoning
129) In the figure above, ceteris paribus, an increase in x is associated with
A) an increase in y.
B) a decrease in y.
C) an increase in z.
D) a random change in z.
E) no change in either y or z.
Skill: Level 2: Using definitions
Section: Chapter 1 Appendix – Checkpoint 4
Author: STUDY GUIDE
AACSB: Analytical reasoning
111
Copyright © 2011 Pearson Education, Inc.
1.4 Integrative Questions
1) Suppose you decide to attend summer school and that this is considered a rational choice.
When making this choice,
A) you must ignore the problem of scarcity.
B) you considered the marginal cost and marginal benefit of your choice.
C) you have used the ceteris paribus assumption.
D) you have made a positive statement.
E) you must have considered the social interest.
Skill: Level 2: Using definitions
Section: Integrative
Author: CD
AACSB: Reflective thinking
2) Which of the following is true?
I. A rational choice is always made in the pursuit of social interest.
II. Economics is a social science.
III. Economists try to understand how the economic world works by testing positive statements.
A) II and III
B) Only I
C) Only II
D) Only III
E) I and II
Skill: Level 2: Using definitions
Section: Integrative
Author: CO
AACSB: Reflective thinking

112
Copyright © 2011 Pearson Education, Inc.
3) Which of the following is true?
I. A rational choice is made on the margin.
II. Microeconomics is the study of the national economy while macroeconomics is the study of
the global economy.
III. Economists try to understand how the economic world works by testing normative
statements.
A) Only I
B) I and III
C) Only II
D) Only III
E) I and II
Skill: Level 2: Using definitions
Section: Integrative
Author: CO
AACSB: Reflective thinking
4) Will, Bill, and Phil decide to study an extra hour for an exam. Instead of studying, they could
have gone out to eat, played football, or watched TV. Which of the following statements is
correct?
A) The benefit the three students receive must be the same because they all make the same
choice.
B) The students made a rational choice as long as they face no scarcity.
C) The students could each have different opportunity costs.
D) The marginal cost of the decision is the same if they make the same score on the exam.
E) Going out to eat, playing football, and watching TV are all called sunk costs.
Skill: Level 2: Using definitions
Section: Integrative
Author: CD
AACSB: Reflective thinking

113
Copyright © 2011 Pearson Education, Inc.
5) Which of the following is true regarding a normative statement?
i) It uses the ceteris paribus assumption.
ii) It is a value judgment.
iii) It accounts for opportunity costs.
A) i and iii.
B) ii and iii.
C) i only.
D) ii only.
E) i, ii, and iii.
Skill: Level 2: Using definitions
Section: Integrative
Author: CD
AACSB: Reflective thinking
6) To help unscramble cause and effect, economists
A) use the concept of opportunity costs.
B) must use the ceteris paribus assumption.
C) answer the “what” question.
D) answer the “how” question.
E) must use normative statements.
Skill: Level 2: Using definitions
Section: Integrative
Author: CD
AACSB: Reflective thinking
7) Which of the following is true regarding this statement? “The president’s decision to spend
more money on national defense is smart.”
A) This is a normative statement.
B) The federal government does not face scarcity.
C) This topic would be studied in microeconomics.
D) Social interest must always be more important than self-interest.
E) Ceteris paribus does not apply to the government.
Skill: Level 2: Using definitions
Section: Integrative
Author: CD
AACSB: Reflective thinking
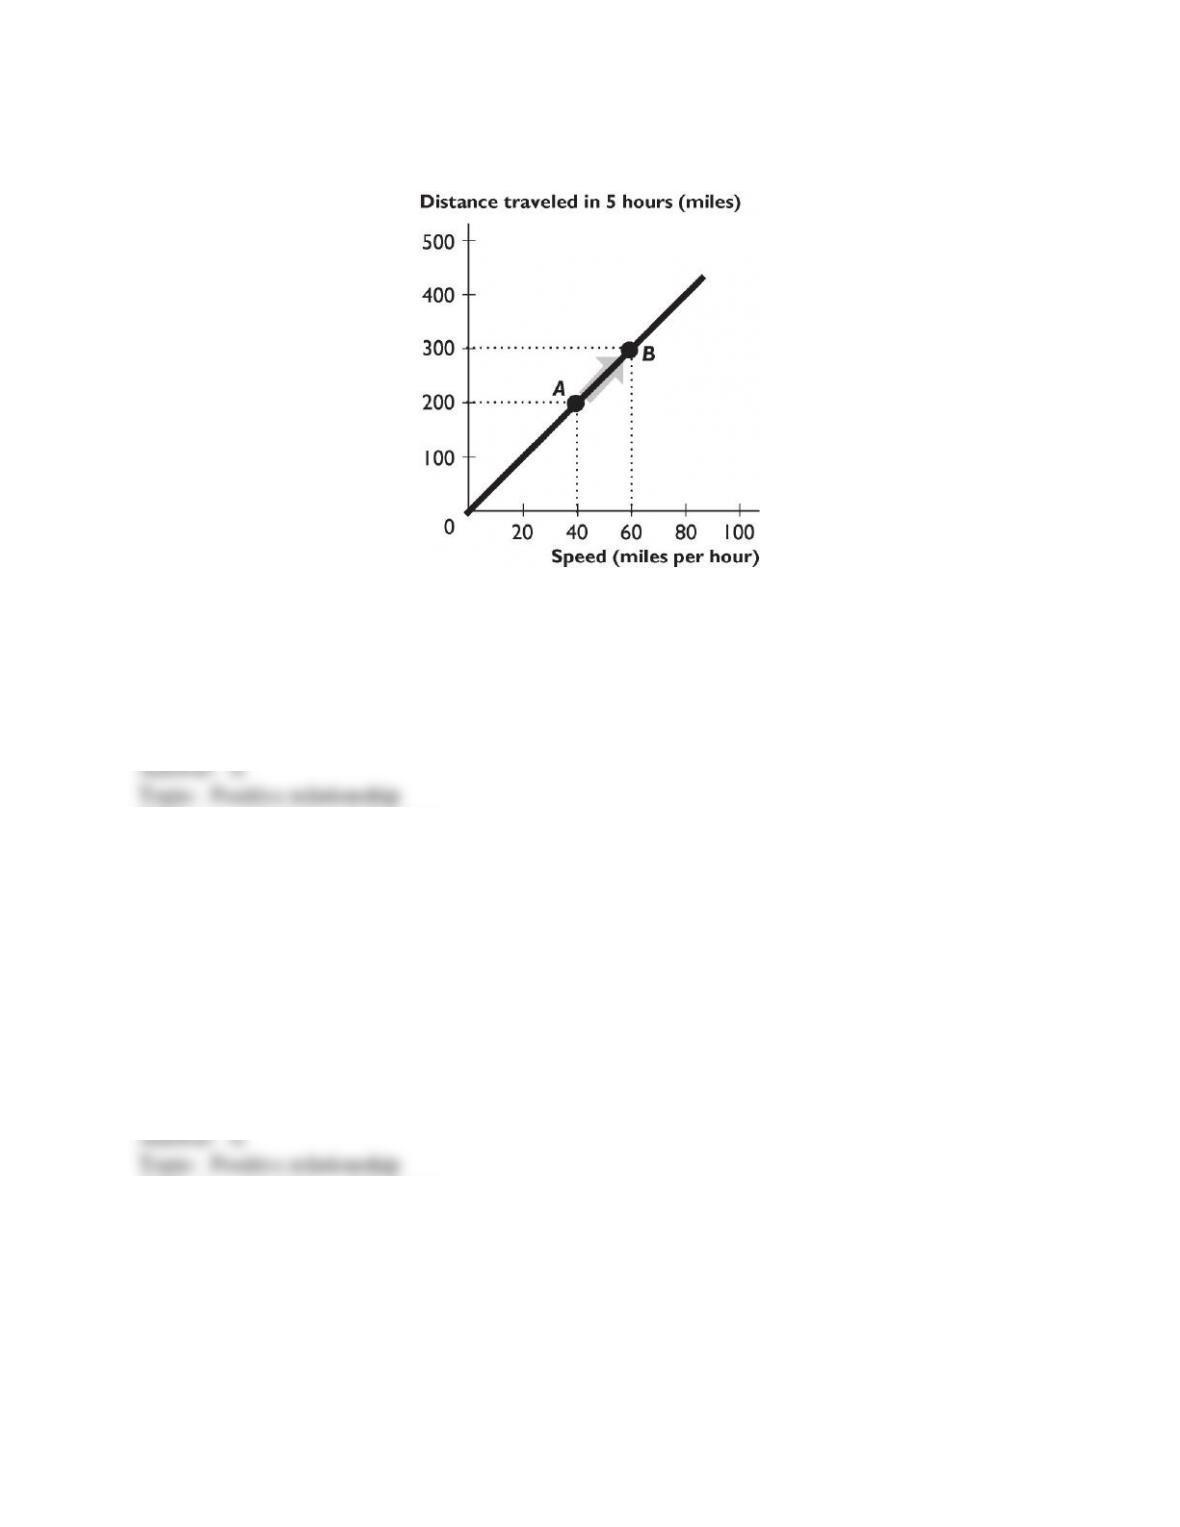
114
Copyright © 2011 Pearson Education, Inc.
1.5 Chapter Figures
1) The relationship between distance traveled in 5 hours and speed shown in the figure above is
A) direct, linear.
B) inverse, linear.
C) direct, non-linear.
D) inverse, positive.
E) direct, negative.
Skill: Level 2: Using definitions
Section: Chapter 1 Appendix – Checkpoint 3
Author: CO
AACSB: Analytical reasoning
2) The relationship between distance traveled in five hours and speed shown in the figure above
is
A) positive.
B) negative.
C) inverse.
D) cross-sectional.
E) multilateral.
Skill: Level 2: Using definitions
Section: Chapter 1 Appendix – Checkpoint 3
Author: MR
AACSB: Analytical reasoning
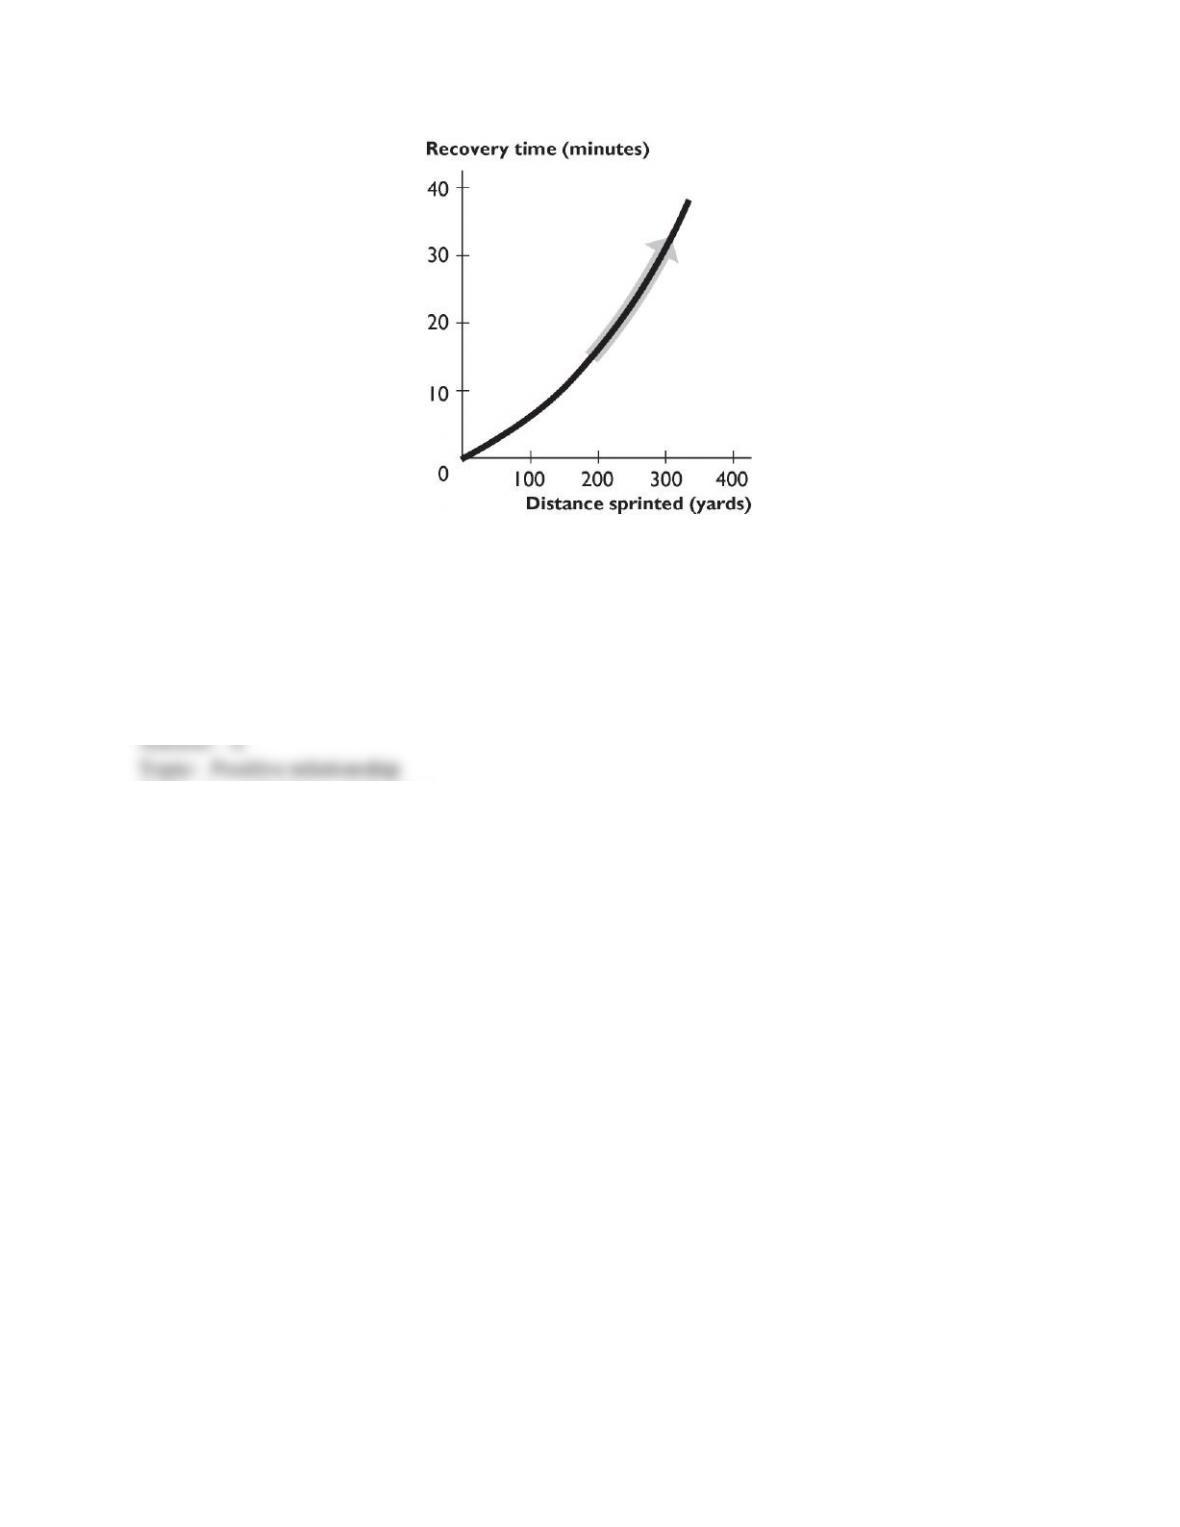
115
Copyright © 2011 Pearson Education, Inc.
3) The figure above shows the relationship between distance sprinted and recovery time. The
curve becomes steeper because as the distance sprinted increases,
A) the extra recovery time needed from sprinting another 100 yards increases.
B) the extra recovery time needed from sprinting another 100 yards decreases.
C) the recovery time increases.
D) the recovery time decreases.
E) the relationship between distance sprinted and recovery time becomes more inverse.
Skill: Level 2: Using definitions
Section: Chapter 1 Appendix – Checkpoint 3
Author: CO
AACSB: Analytical reasoning
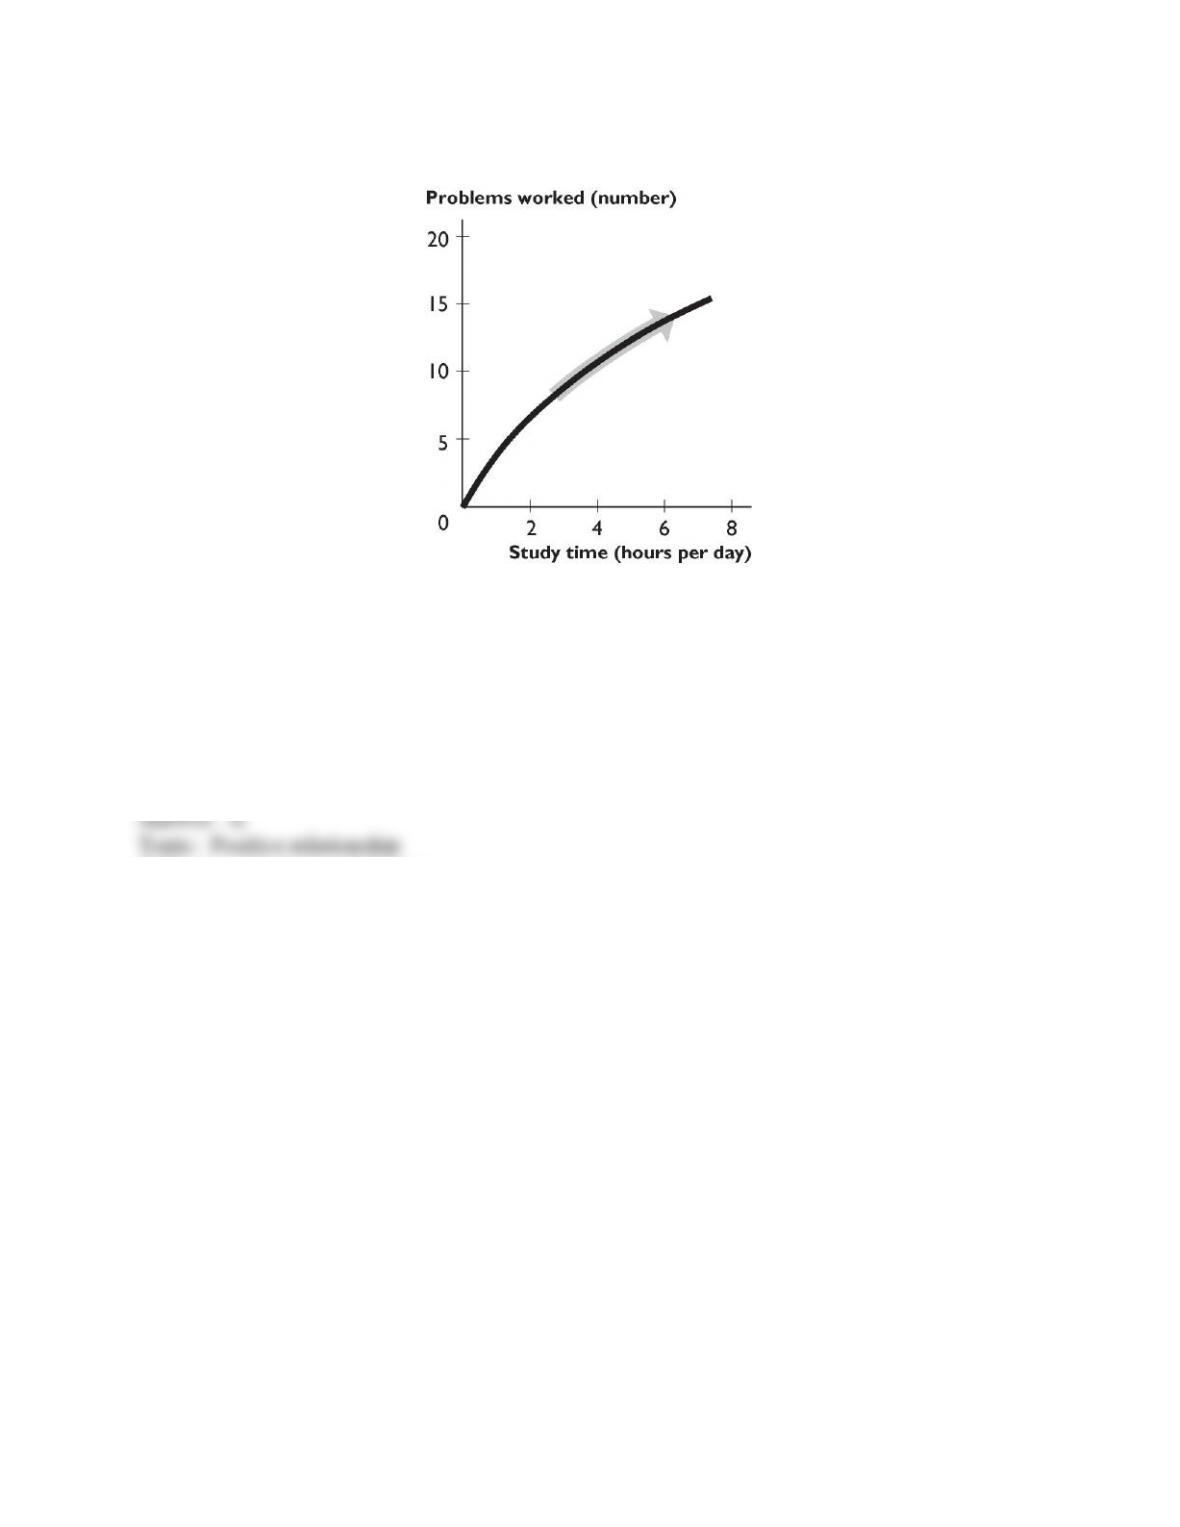
116
Copyright © 2011 Pearson Education, Inc.
4) The figure above shows the relationship between study time and the number of problems
worked. The curve becomes less steep because as you study more,
A) study time becomes less effective.
B) study time becomes more effective.
C) the number of problems worked increases.
D) the number of problems worked decreases.
E) the relationship between study time and the number of problems worked changes from direct
to inverse.
Skill: Level 2: Using definitions
Section: Chapter 1 Appendix – Checkpoint 3
Author: CO
AACSB: Analytical reasoning
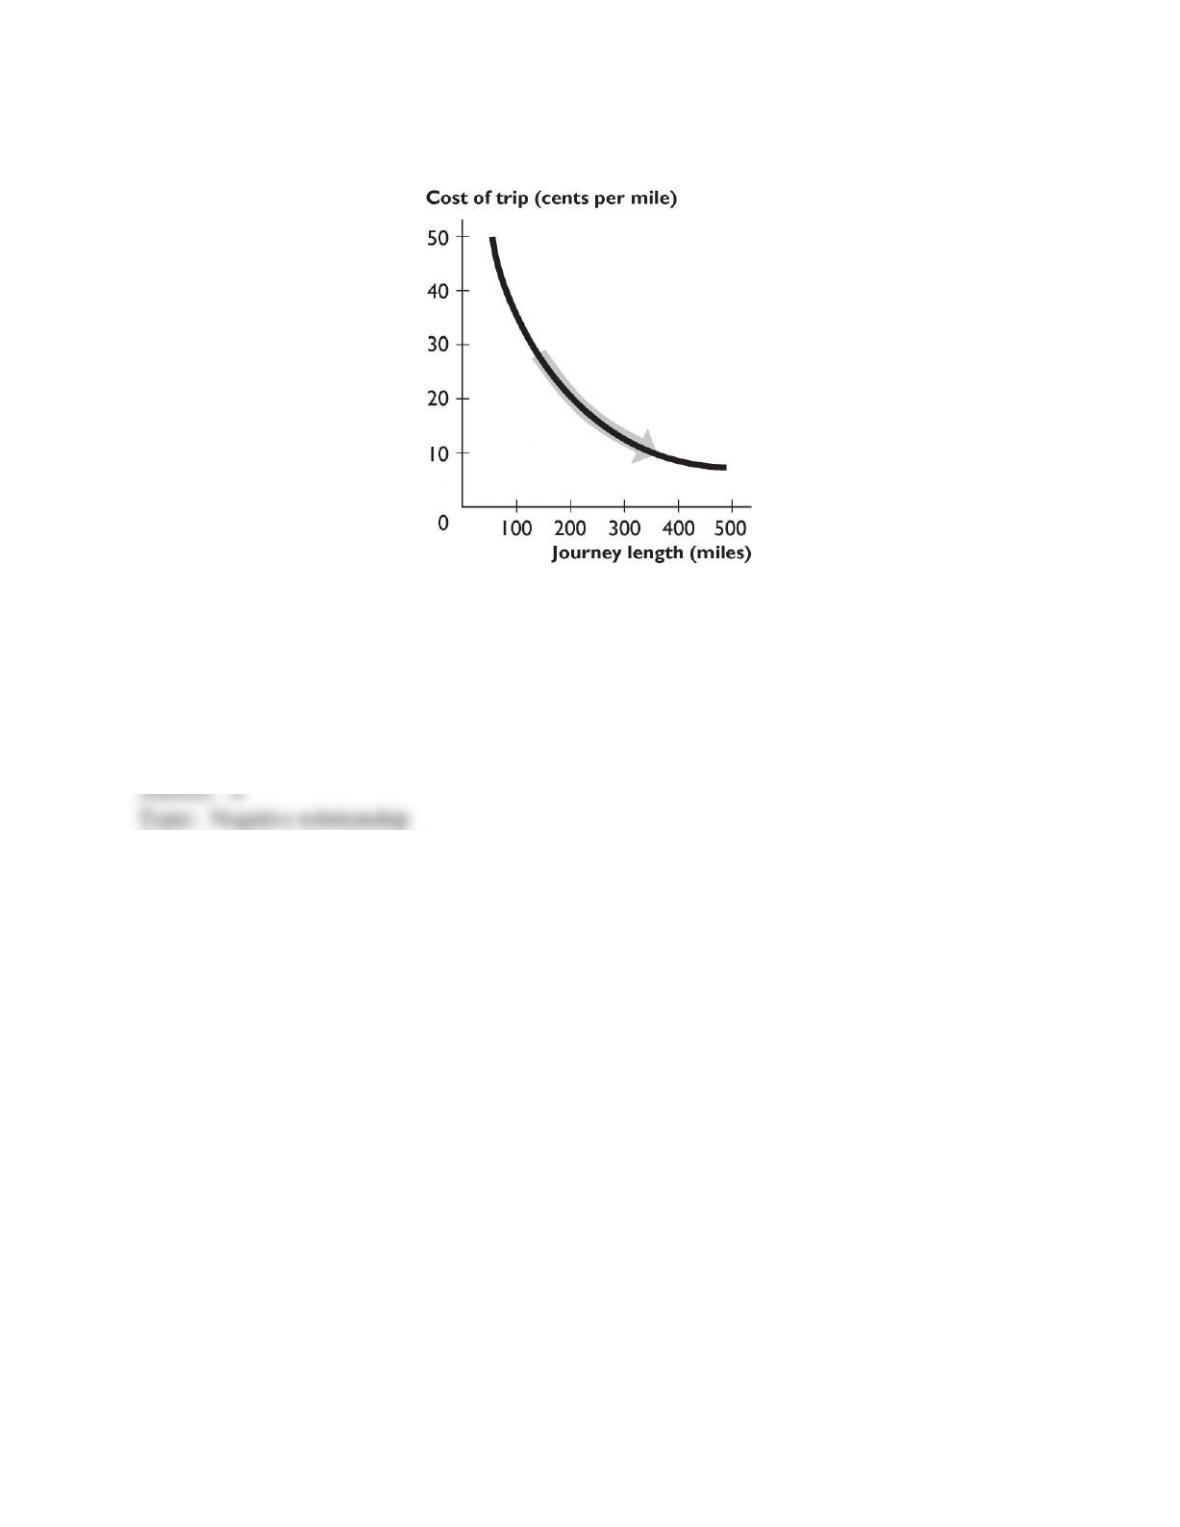
117
Copyright © 2011 Pearson Education, Inc.
5) The figure above shows the relationship between the journey length and the cost of trip per
mile. The curve becomes flatter because as the journey length increases,
A) the fall in the cost per mile becomes smaller.
B) the fall in the cost per mile becomes greater.
C) the cost per mile decreases.
D) the cost per mile increases.
E) the cost per mile remains unchanged.
Skill: Level 2: Using definitions
Section: Chapter 1 Appendix – Checkpoint 3
Author: CO
AACSB: Analytical reasoning
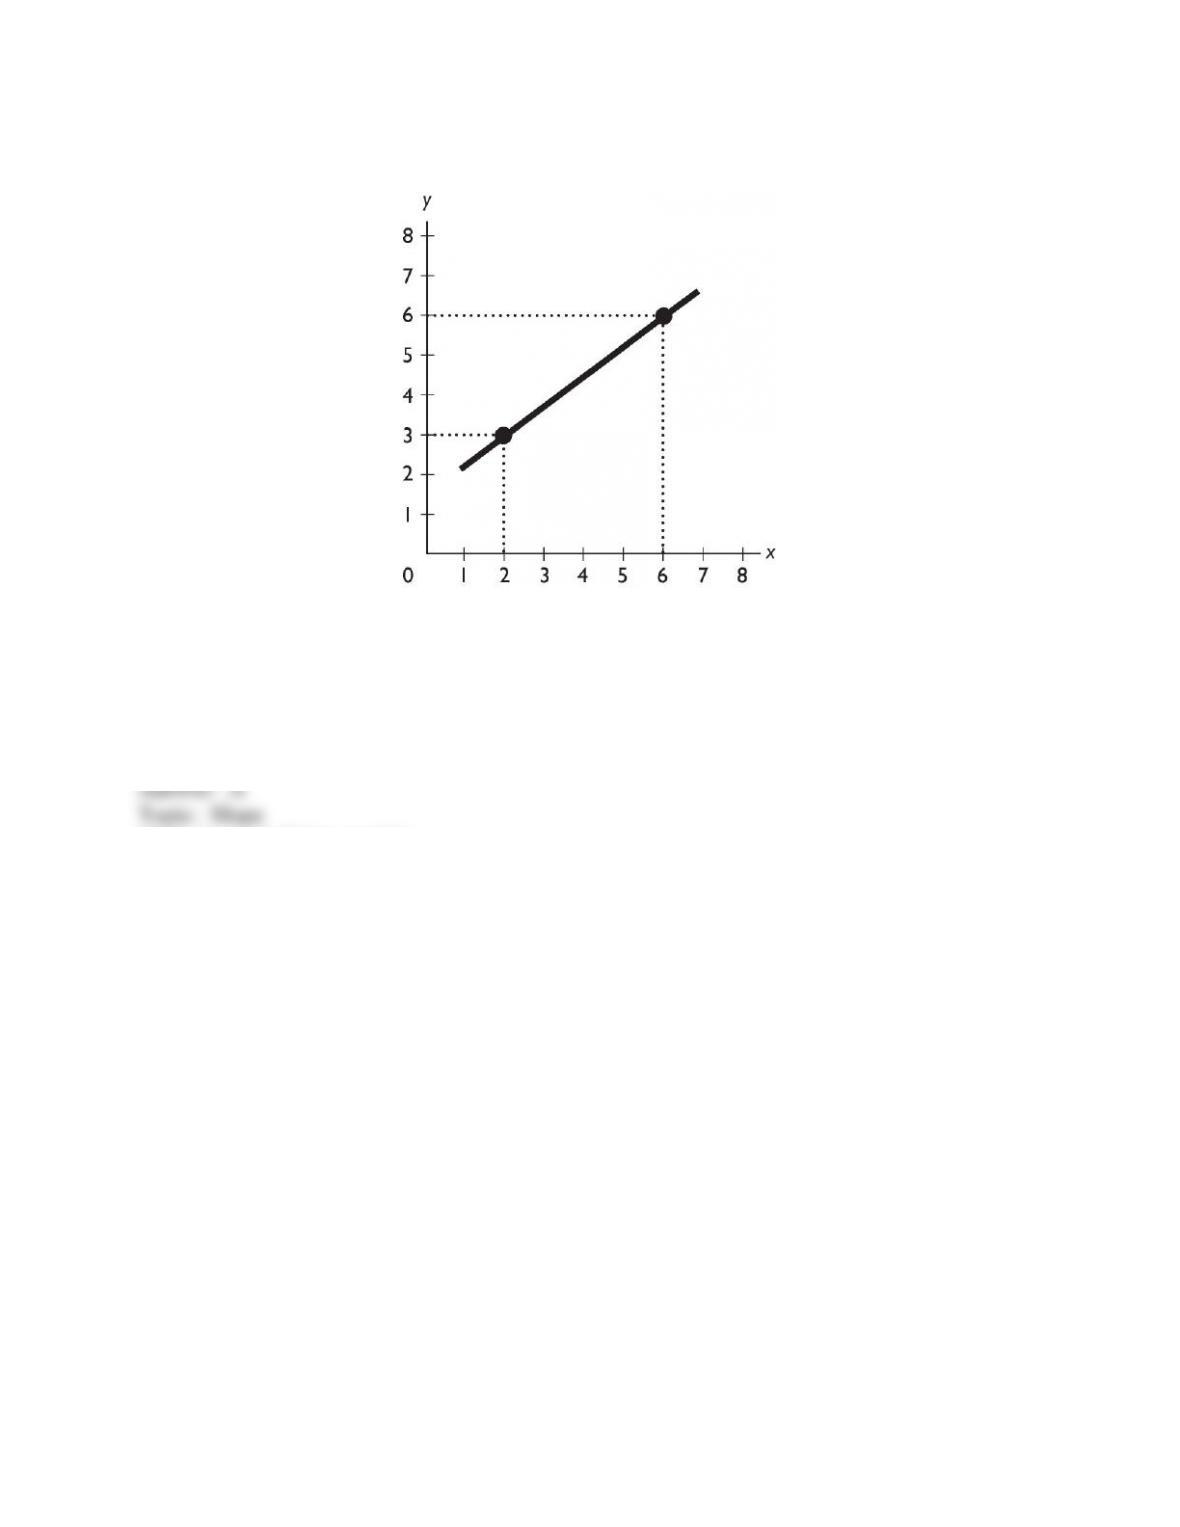
118
Copyright © 2011 Pearson Education, Inc.
6) What is the slope of the line in the figure above?
A) 0.75
B) -0.75
C) 1.33
D) -1.33
E) Zero
Skill: Level 3: Using models
Section: Chapter 1 Appendix – Checkpoint 3
Author: CO
AACSB: Analytical reasoning
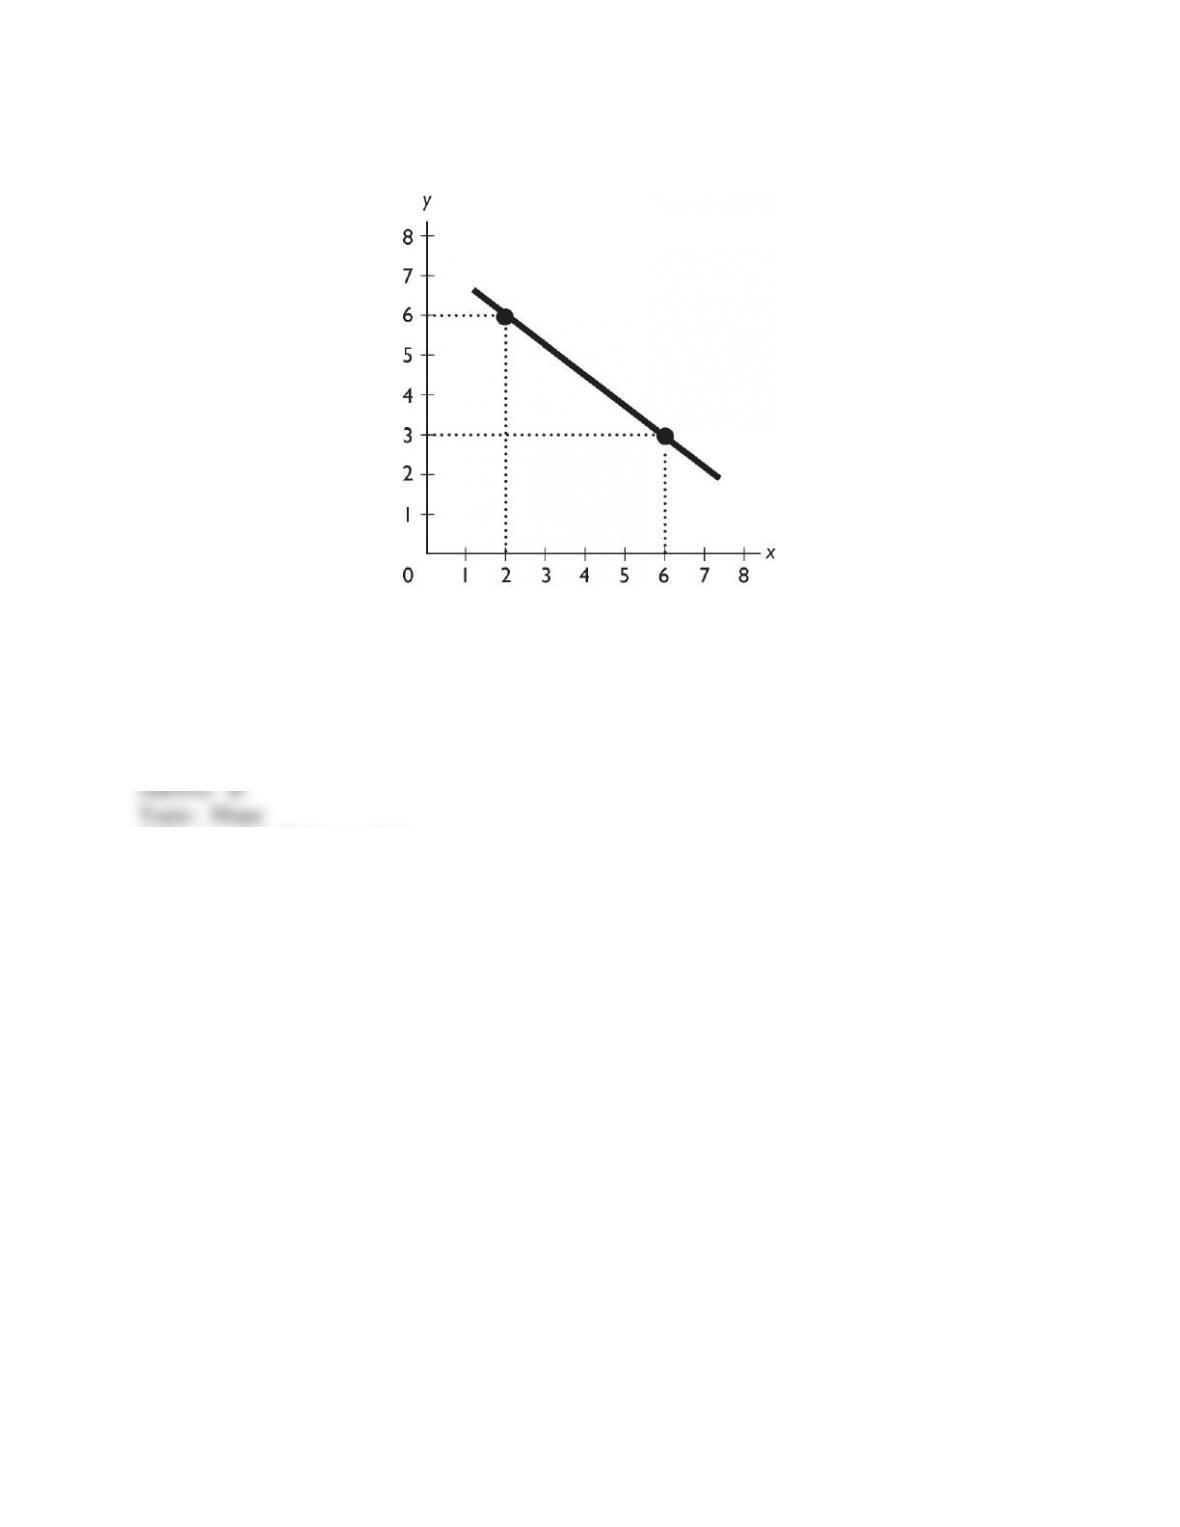
119
Copyright © 2011 Pearson Education, Inc.
7) What is the slope of the line in the figure above?
A) 0.75
B) -0.75
C) 1.33
D) -1.33
E) Zero
Skill: Level 3: Using models
Section: Chapter 1 Appendix – Checkpoint 3
Author: CO
AACSB: Analytical reasoning
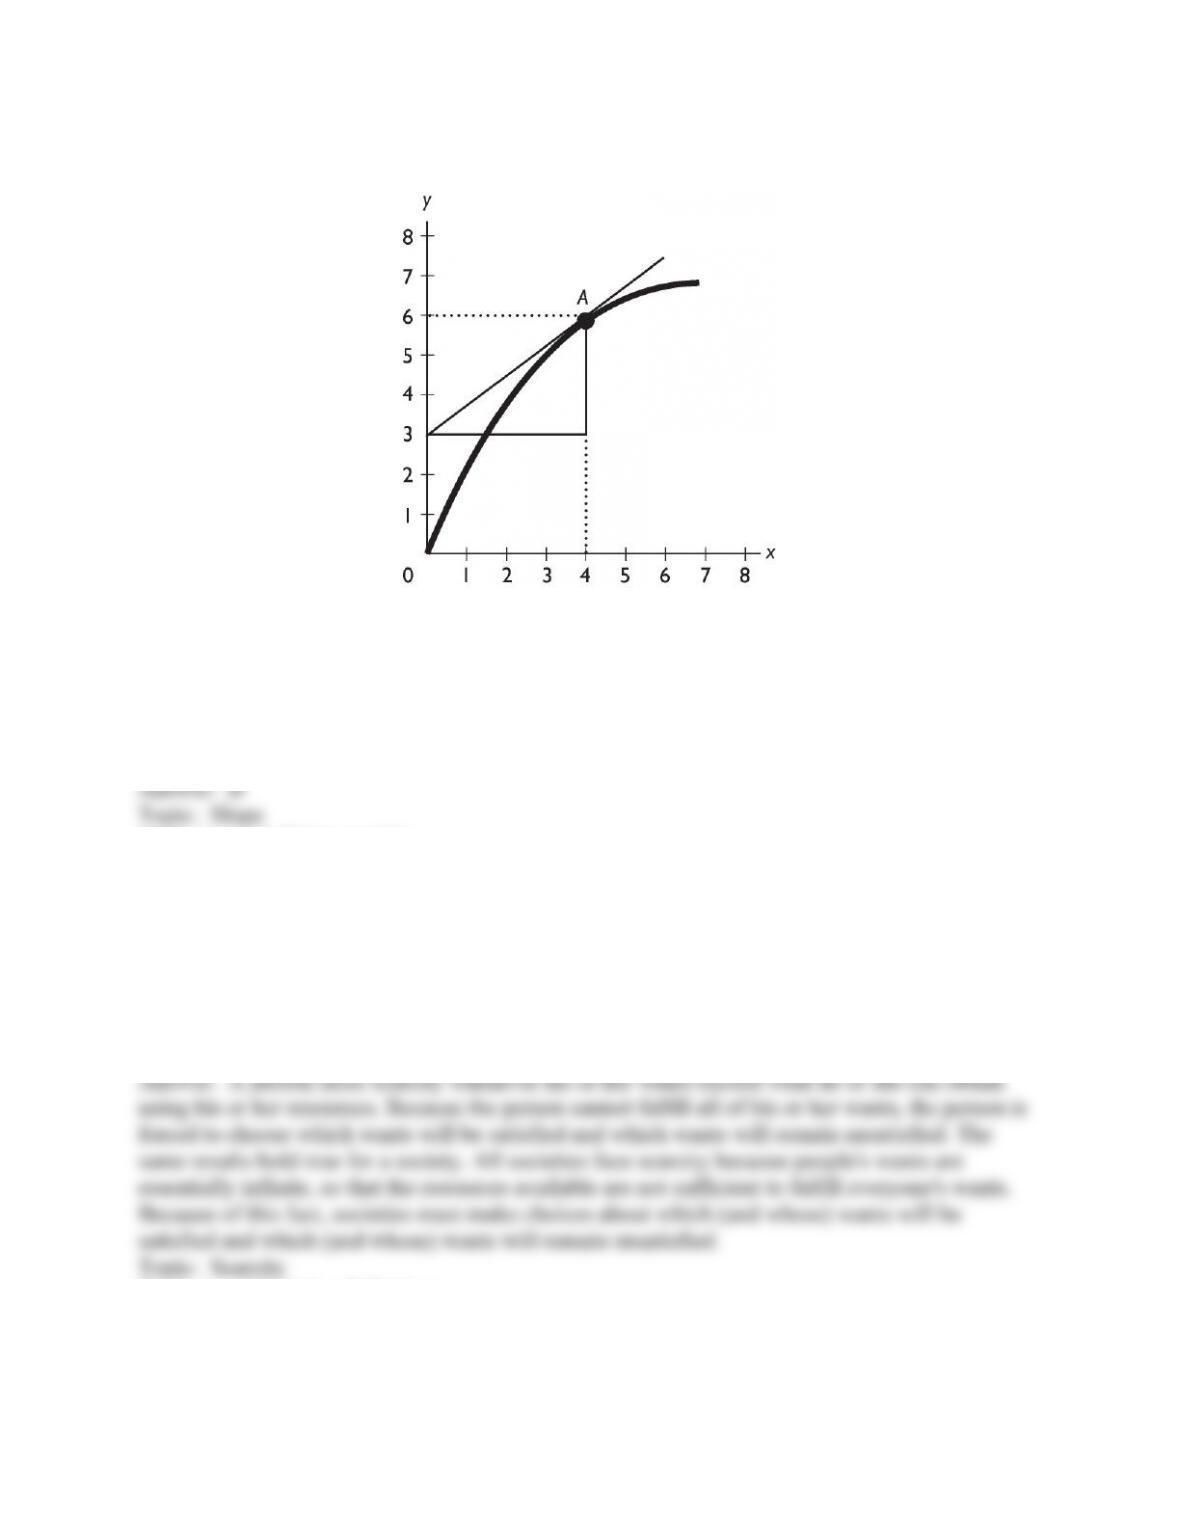
120
Copyright © 2011 Pearson Education, Inc.
8) In the figure above, what is the slope of the curve at point A?
A) 0.75
B) -0.75
C) 1.33
D) -1.33
E) Zero
Skill: Level 3: Using models
Section: Chapter 1 Appendix – Checkpoint 3
Author: CO
AACSB: Analytical reasoning
1.6 Essay: Definition and Questions
1) What is the relationship between wants, resources, scarcity, and choices? Discuss the
relationship for an individual and for a society.
Skill: Level 2: Using definitions
Section: Checkpoint 1.1
Author: PH
AACSB: Communication
121
Copyright © 2011 Pearson Education, Inc.
2) Why do economists say that even very rich people face scarcity?
Skill: Level 3: Using models
Section: Checkpoint 1.1
Author: MR
AACSB: Communication
3) What do economists mean when they discuss “scarcity”?
Skill: Level 2: Using definitions
Section: Checkpoint 1.1
Author: MR
AACSB: Communication
4) Define economics and describe its branches of study.
Skill: Level 2: Using definitions
Section: Checkpoint 1.1
Author: PH
AACSB: Communication
122
Copyright © 2011 Pearson Education, Inc.
5) Why does scarcity lead to the what, how, and for whom questions?
Skill: Level 1: Definition
Section: Checkpoint 1.1
Author: TS
AACSB: Communication
6) List and explain the three fundamental economic questions that must be answered by all
economic systems.
Skill: Level 1: Definition
Section: Checkpoint 1.1
Author: PH
AACSB: Communication
7) Pumpkins are grown in New Mexico with the aid of fertilizer. Hence, fertilizer is a partial
answer to which of the three economic question?
Skill: Level 3: Using models
Section: Checkpoint 1.1
Author: JC
AACSB: Reflective thinking
123
Copyright © 2011 Pearson Education, Inc.
8) Different nations answer the what, how, and for whom questions differently. China, for
instance, builds dams using many workers and only a little capital equipment. The United States
builds dams using a few workers and a lot of capital equipment. Which economic question are
these two nations answering and why do the answers differ?
Skill: Level 4: Applying models
Section: Checkpoint 1.1
Author: MR
AACSB: Communication
9) The question “Will doctors or lawyers have higher annual incomes?” represents which of the
three basic economic questions?
Skill: Level 3: Using models
Section: Checkpoint 1.1
Author: JC
AACSB: Communication
1.7 Essay: The Economic Way of Thinking
1) What is an opportunity cost? Give an example.
Skill: Level 1: Definition
Section: Checkpoint 1.2
Author: CD
AACSB: Communication
124
Copyright © 2011 Pearson Education, Inc.
2) Your friend is preparing for this exam and in your practice session makes the following
statement: “Instead of attending microeconomics class for two hours, Kiki could have played
tennis or watched a movie. Therefore, the opportunity cost of attending class is the tennis and the
movie she had to give up.” Is your friend’s analysis correct or not? Explain your answer.
Skill: Level 3: Using models
Section: Checkpoint 1.2
Author: SA
AACSB: Communication
3) Rather than go out to eat by yourself, you decide to stay at home and fix dinner for yourself
and your two roommates. Your roommates applaud your decision.
a. Your first roommate tells you that your decision to eat at home has no opportunity cost
because you already have all the dinner ingredients in your pantry. Is this roommate’s comment
correct?
b. When preparing dinner, you use some milk that has a pull-date of tomorrow, so that the milk
would not be good tomorrow. Your second roommate notices the date on the carton, and
comments that the cost of the milk you are using is a sunk cost. Is this roommate’s comment
correct?
Skill: Level 3: Using models
Section: Checkpoint 1.2
Author: JC
AACSB: Communication
125
Copyright © 2011 Pearson Education, Inc.
4) Shaniq can spend the next hour studying for a finance test, hiking along the Oregon coast,
watching reruns of Lost on television, or napping. If she decides to study, what is the opportunity
cost of her choice: hiking, watching television, or napping?
Skill: Level 3: Using models
Section: Checkpoint 1.2
Author: JC
AACSB: Communication
5) Why is the benefit of something measured by what you are willing to give up?
Skill: Level 2: Using definitions
Section: Checkpoint 1.2
Author: MR
AACSB: Communication
6) Define marginal cost and marginal benefit.
Skill: Level 1: Definition
Section: Checkpoint 1.2
Author: CD
AACSB: Reflective thinking
126
Copyright © 2011 Pearson Education, Inc.
7) In New State, the bottling law requires that people get a refund of five cents when they return
an empty bottle or can. Why does the state pay people to return bottles? In your answer, be sure
to mention the role played by rational choice.
Skill: Level 3: Using models
Section: Checkpoint 1.2
Author: SA
AACSB: Communication
8) Must a rational choice always work out well? In other words, is it possible for someone to
regret a rational decision?
Skill: Level 2: Using definitions
Section: Checkpoint 1.2
Author: JC
AACSB: Communication
9) Discuss what is necessary to make rational decisions. Be sure to mention opportunity cost,
marginal cost, and marginal benefit.
Skill: Level 2: Using definitions
Section: Checkpoint 1.2
Author: SB
AACSB: Communication
127
Copyright © 2011 Pearson Education, Inc.
10) What is the difference between microeconomics and macroeconomics?
Skill: Level 2: Using definitions
Section: Checkpoint 1.2
Author: MR
AACSB: Communication
11) What is a positive statement? Give an example.
Skill: Level 1: Definition
Section: Checkpoint 1.2
Author: CD
AACSB: Reflective thinking
12) What is the difference between positive and normative statements?
Skill: Level 2: Using definitions
Section: Checkpoint 1.2
Author: JC
AACSB: Communication
128
Copyright © 2011 Pearson Education, Inc.
13) Two economists can agree that raising the minimum wage creates unemployment yet one
might argue that raising the minimum wage is a good policy and the other that it is a bad policy.
Why can this difference exist? Be sure to use the terms positive and normative in your answer.
Skill: Level 2: Using definitions
Section: Checkpoint 1.2
Author: MR
AACSB: Communication
14) Explain whether the statement, “There is life on Mars,” is a normative or positive statement.
Skill: Level 2: Using definitions
Section: Checkpoint 1.2
Author: MR
AACSB: Communication
15) Explain whether the statement, “Hillary Clinton was elected President of the United States in
2008,” is a normative or positive statement.
Skill: Level 3: Using models
Section: Checkpoint 1.2
Author: MR
AACSB: Communication
129
Copyright © 2011 Pearson Education, Inc.
16) What is a normative statement? Give an example.
Skill: Level 1: Definition
Section: Checkpoint 1.2
Author: CD
AACSB: Reflective thinking
17) Explain whether the statement “The government should increase tariffs on Japanese cars to
protect the American car industry from competition,” is a normative or positive statement.
Skill: Level 2: Using definitions
Section: Checkpoint 1.2
Author: SA
AACSB: Reflective thinking
18) What does ceteris paribus mean and why do economists use it?
Skill: Level 2: Using definitions
Section: Checkpoint 1.2
Author: TS
AACSB: Reflective thinking
19) For spring break, Melanie will either stay home or go to Daytona Beach. At home, Melanie
pays $10 per day for food and earns $90 a day at her job. At Daytona Beach, Melanie will stay
with friends and so has no lodging cost. She will pay $20 per day for food. In terms of dollars,
Melanie’s opportunity cost per day of going to Daytona Beach is how much?
Skill: Level 3: Using models
Section: Checkpoint 1.2
Author: JC
AACSB: Reflective thinking
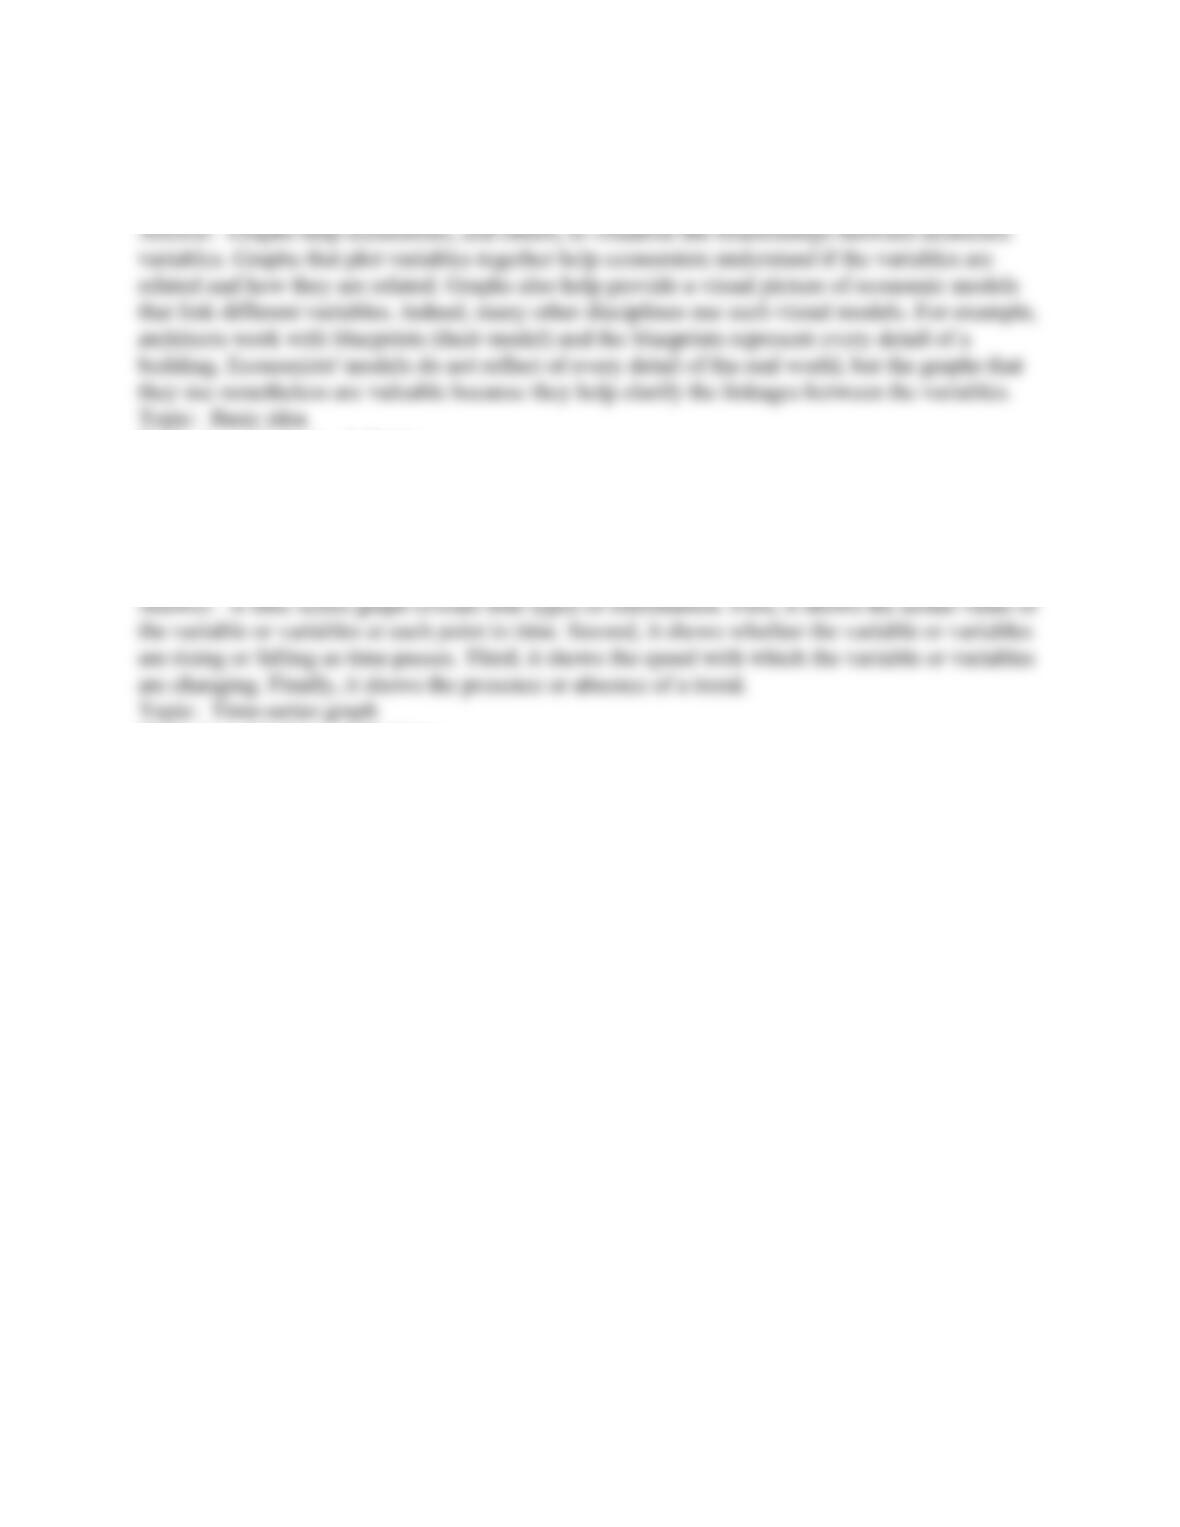
130
Copyright © 2011 Pearson Education, Inc.
1.8 Essay: Appendix
1) Why do economists use graphs?
Skill: Level 2: Using definitions
Section: Chapter 1 Appendix – Checkpoint 1
Author: PH
AACSB: Analytical reasoning
2) What kind of information is conveyed in a time-series graph?
Skill: Level 2: Using definitions
Section: Chapter 1 Appendix – Checkpoint 1
Author: SB
AACSB: Analytical reasoning
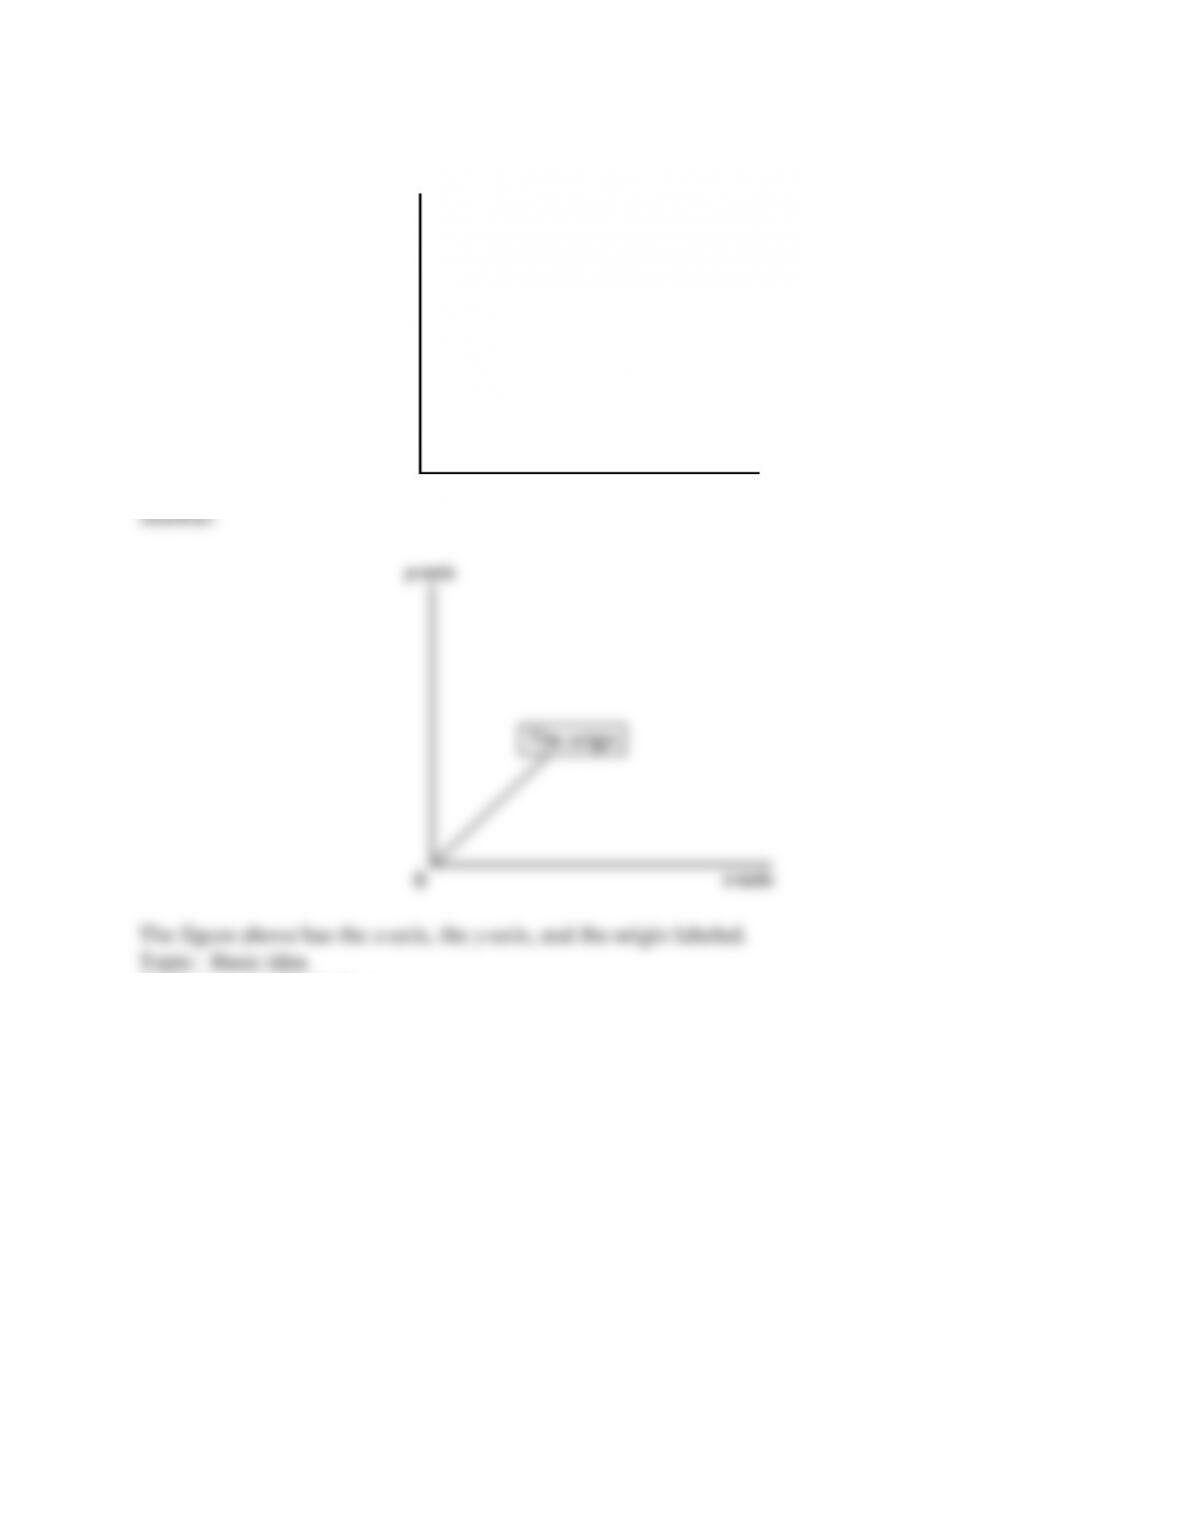
131
Copyright © 2011 Pearson Education, Inc.
3) In the diagram below, label the x-axis, the y-axis, and the origin.
Skill: Level 1: Definition
Section: Chapter 1 Appendix – Checkpoint 1
Author: MR
AACSB: Analytical reasoning
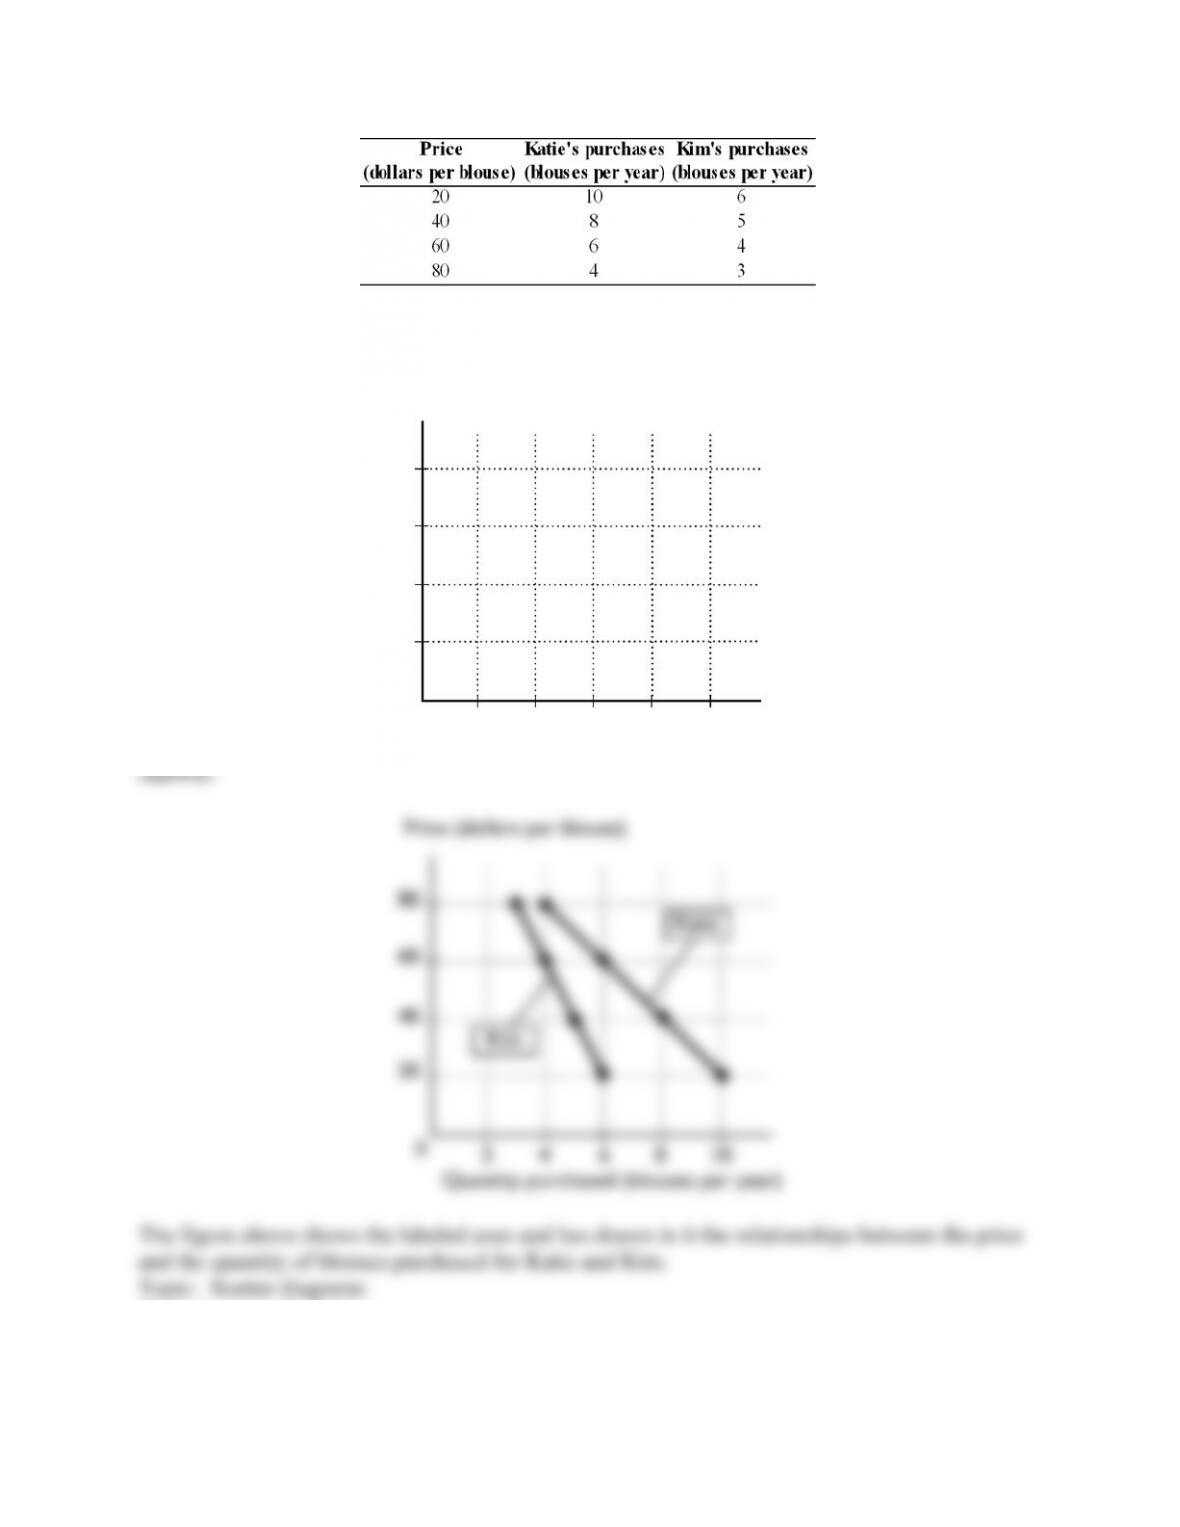
132
Copyright © 2011 Pearson Education, Inc.
4) The table above shows how many blouses Katie and Kim will purchase at different prices for
a blouse. In the figure, label the axes and put the price on the y-axis and the quantity of blouses
on the x-axis. Plot the data for Katie in the figure. Then, plot the data for Kim in the figure.
Skill: Level 1: Definition
Section: Chapter 1 Appendix – Checkpoint 1
Author: SB
AACSB: Analytical reasoning
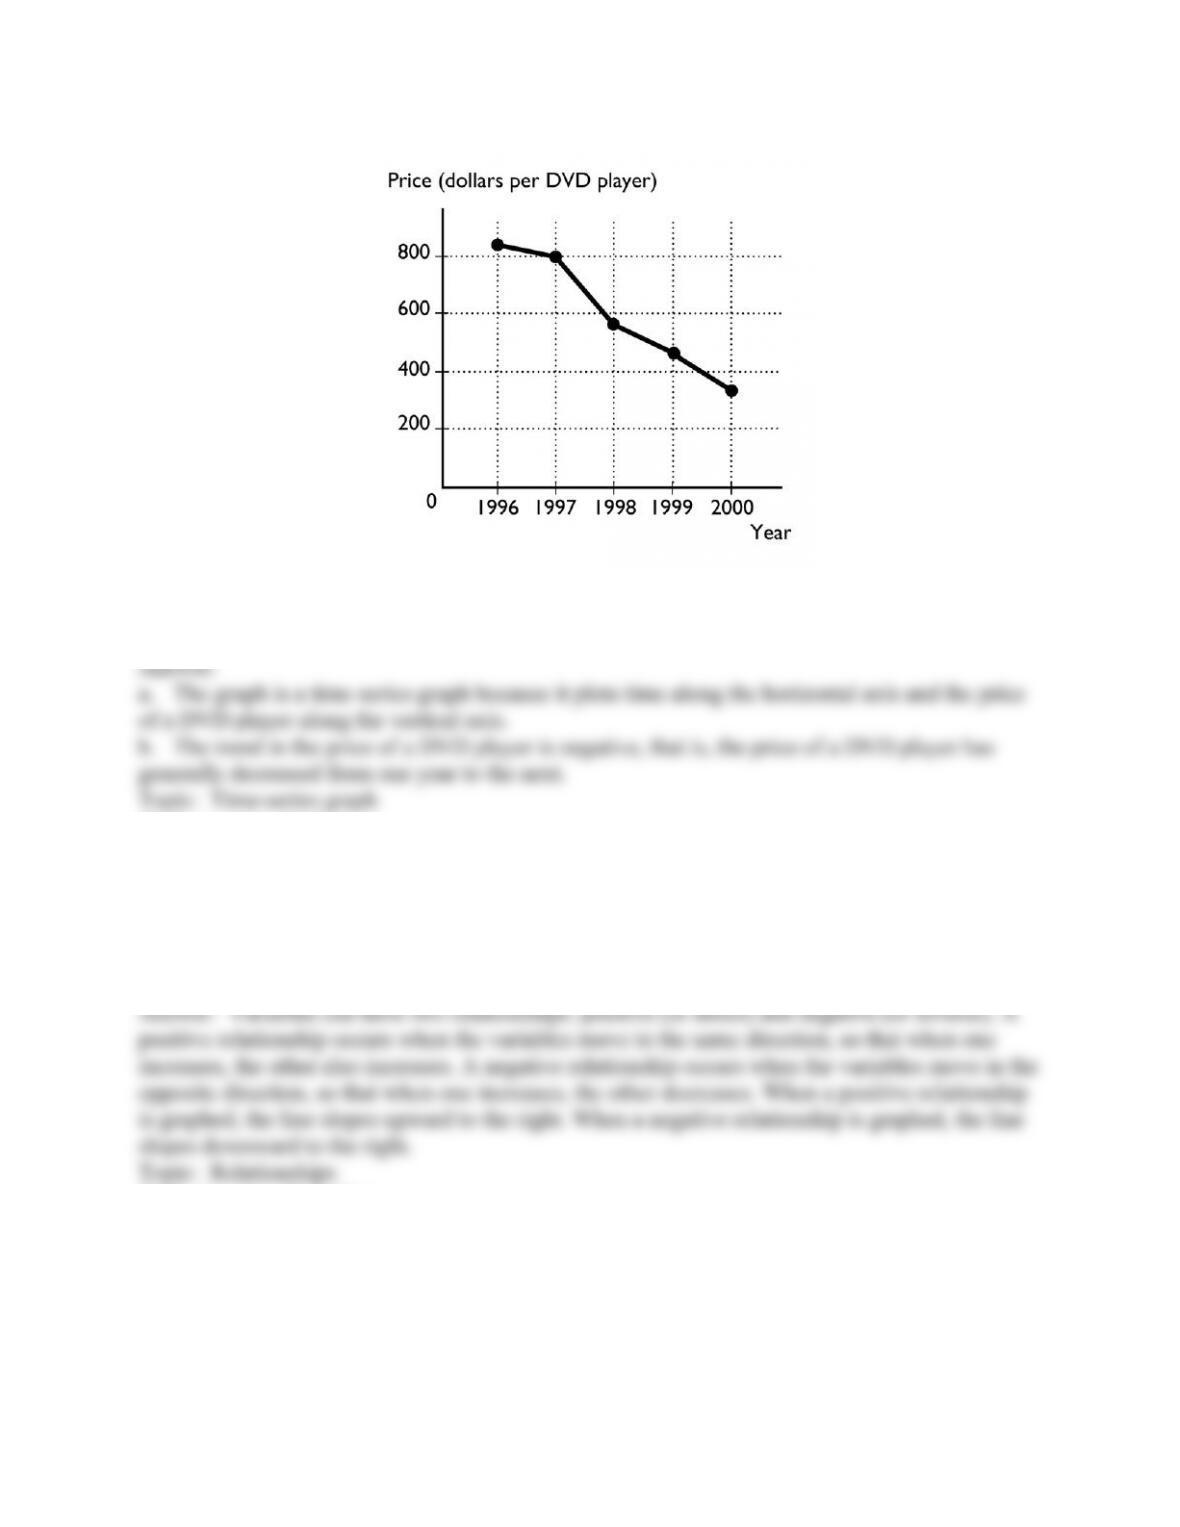
133
Copyright © 2011 Pearson Education, Inc.
5) The figure above shows the price of a DVD player from 1996 to 2000.
a. What type of graph is illustrated above?
b. What is the trend in the price of a DVD player?
Skill: Level 1: Definition
Section: Chapter 1 Appendix – Checkpoint 1
Author: MR
AACSB: Analytical reasoning
6) What are the two different types of relationships that variables can have? Explain each. What
do these relationships look like when they are graphed?
Skill: Level 1: Definition
Section: Chapter 1 Appendix – Checkpoint 2
Author: SB
AACSB: Analytical reasoning
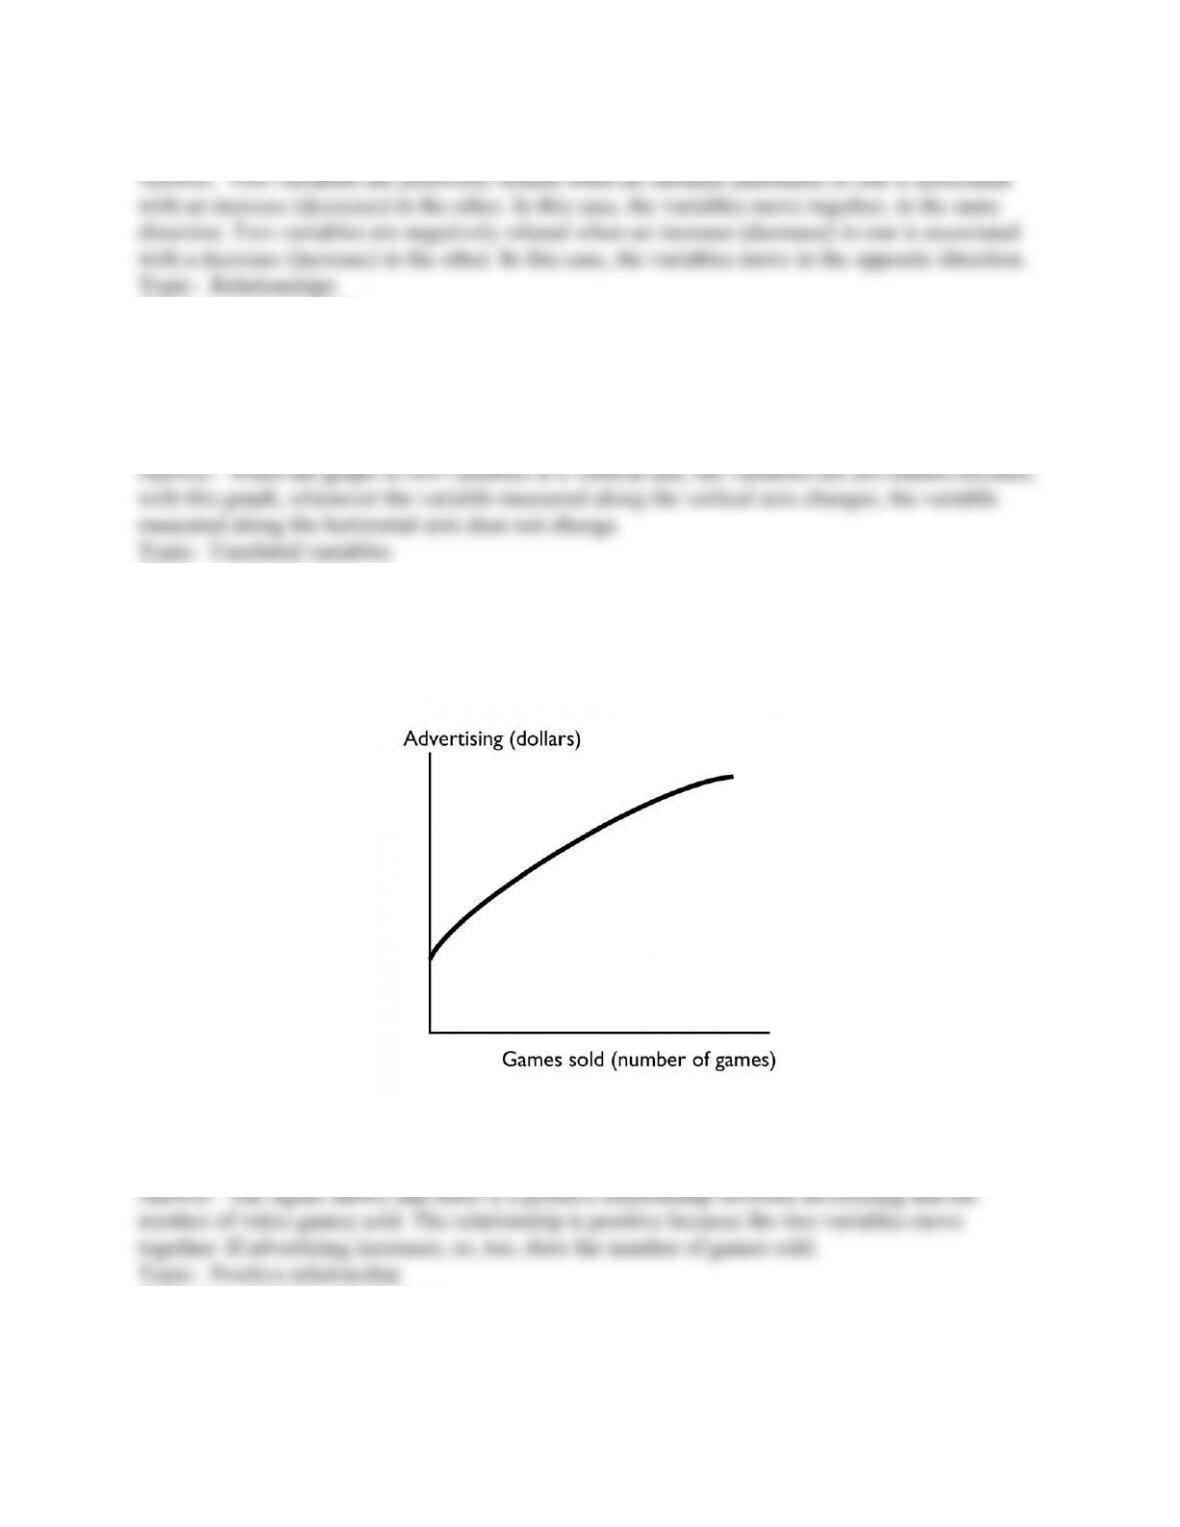
134
Copyright © 2011 Pearson Education, Inc.
7) What is the difference between a positive and a negative relationship?
Skill: Level 1: Definition
Section: Chapter 1 Appendix – Checkpoint 2
Author: MR
AACSB: Analytical reasoning
8) A graph of two variables is a vertical line. What is the interpretation of this result?
Skill: Level 1: Definition
Section: Chapter 1 Appendix – Checkpoint 2
Author: MR
AACSB: Analytical reasoning
9) The figure above shows how the sales of the video game “Tomb Raider–Lara Retires” change
when the advertising spent on the game changes. Is the relationship between advertising and the
number of games sold positive, negative, or neither? Explain your answer.
Skill: Level 2: Using definitions
Section: Chapter 1 Appendix – Checkpoint 2
Author: MR
AACSB: Analytical reasoning
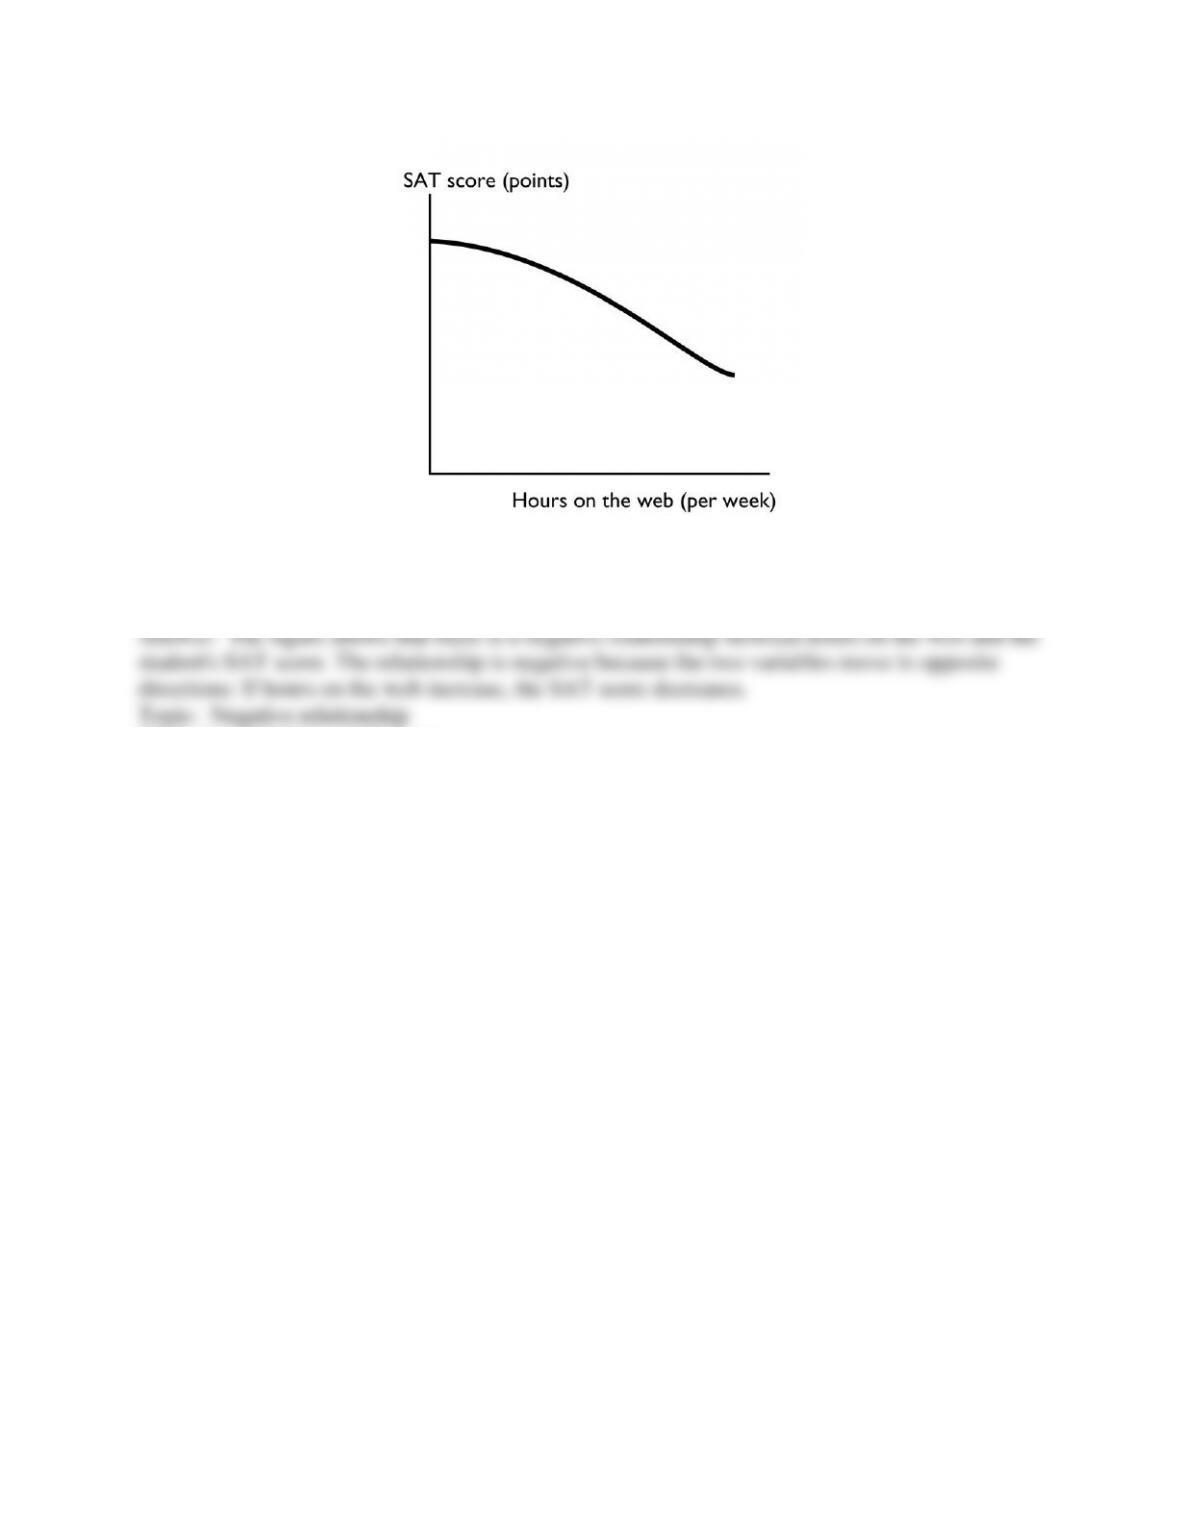
135
Copyright © 2011 Pearson Education, Inc.
10) The figure above shows how the relationship between the number of hours per week a high
school student spends on the web and the student’s SAT score. Is the relationship between hours
on the web and the SAT score positive, negative, neither? Explain your answer.
Skill: Level 2: Using definitions
Section: Chapter 1 Appendix – Checkpoint 2
Author: MR
AACSB: Analytical reasoning
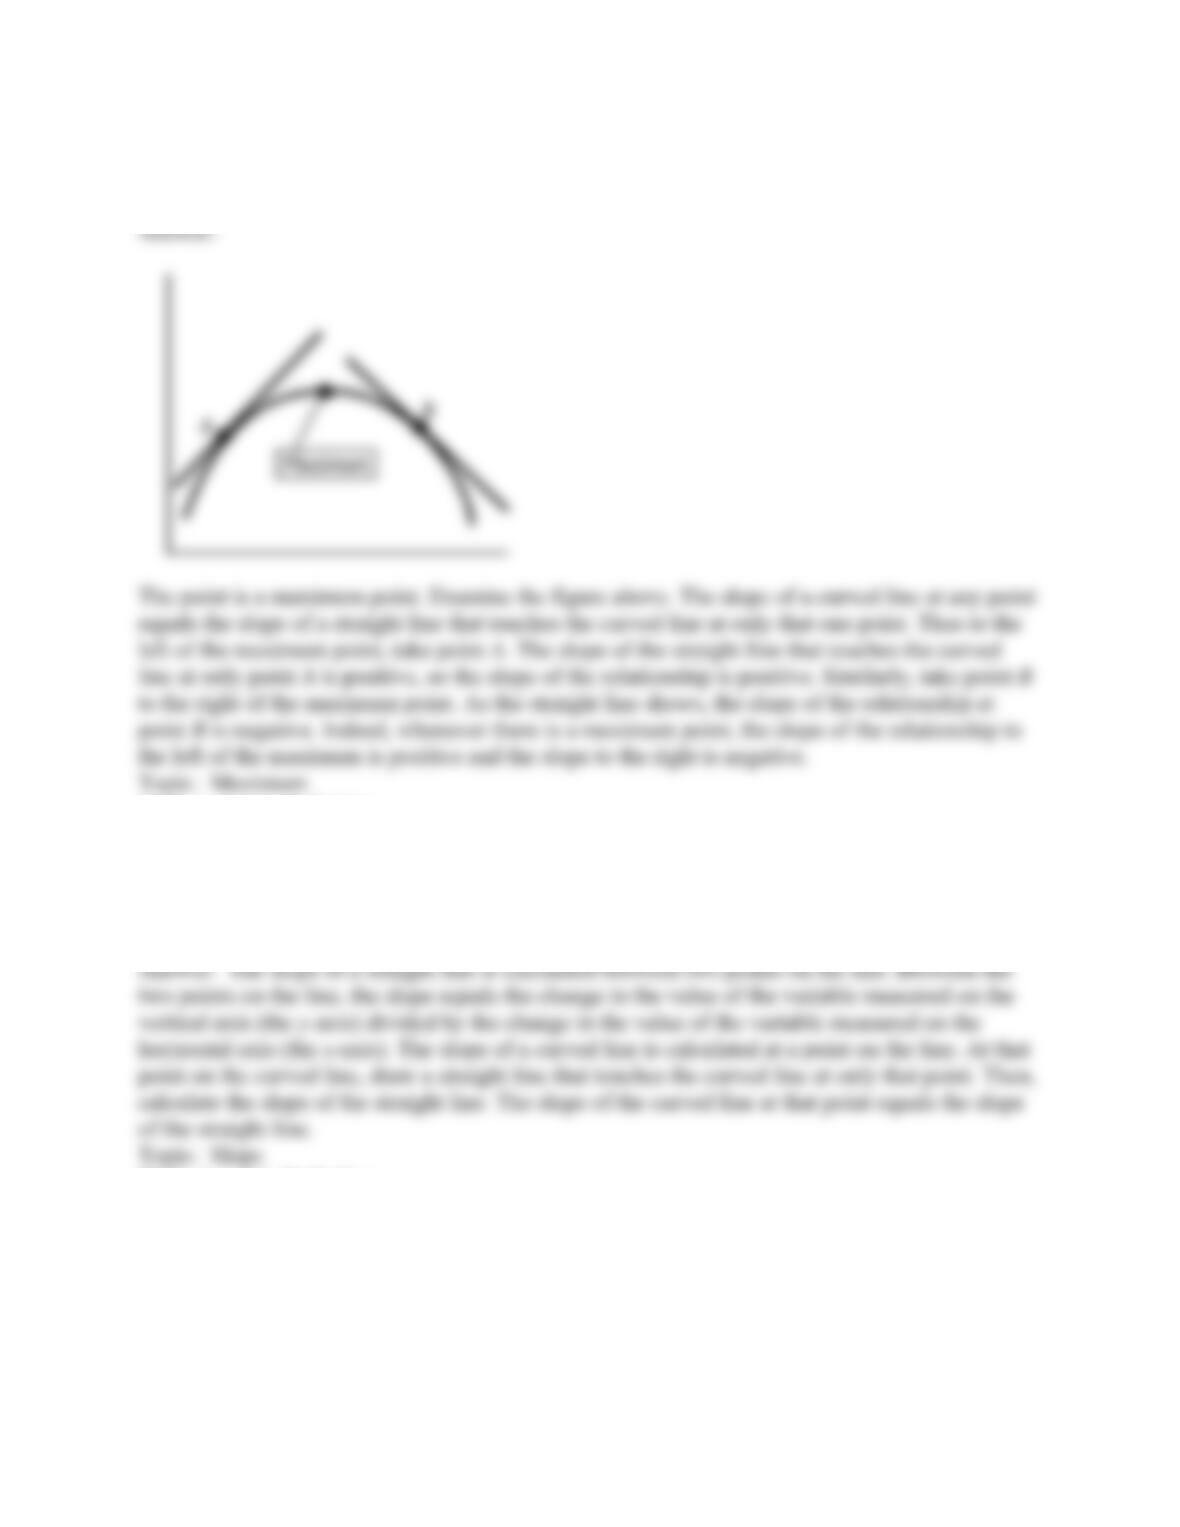
136
Copyright © 2011 Pearson Education, Inc.
11) A graph has a point that is either a maximum or a minimum. To the left of the point, the
slope of relationship is positive. To the right of the point, the slope is negative. Is the point a
maximum point or a minimum point? Be sure to draw a figure that supports your answer.
Skill: Level 1: Definition
Section: Chapter 1 Appendix – Checkpoint 2
Author: MR
AACSB: Analytical reasoning
12) What does the slope of a straight line equal? How is the slope of a curved line calculated?
Skill: Level 1: Definition
Section: Chapter 1 Appendix – Checkpoint 3
Author: MR
AACSB: Analytical reasoning
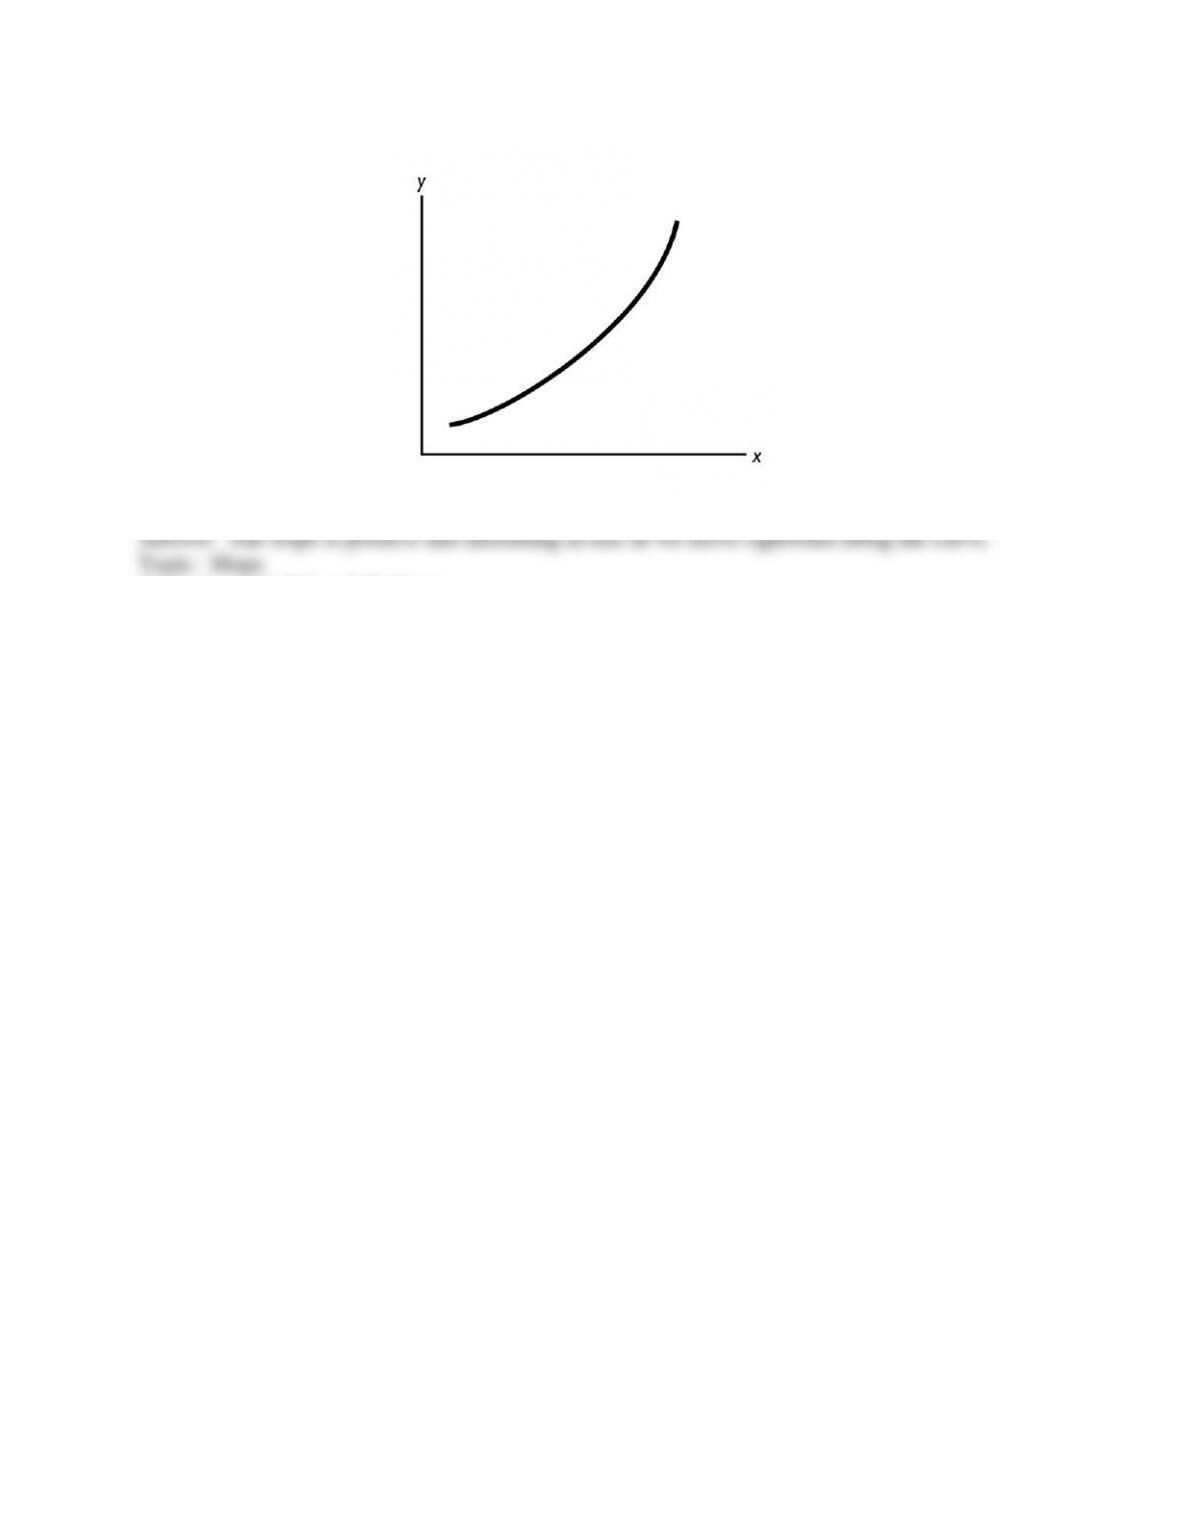
137
Copyright © 2011 Pearson Education, Inc.
13) In the figure above, what can you deduce about the slope of the curve?
Skill: Level 2: Using definitions
Section: Chapter 1 Appendix – Checkpoint 3
Author: MR
AACSB: Analytical reasoning
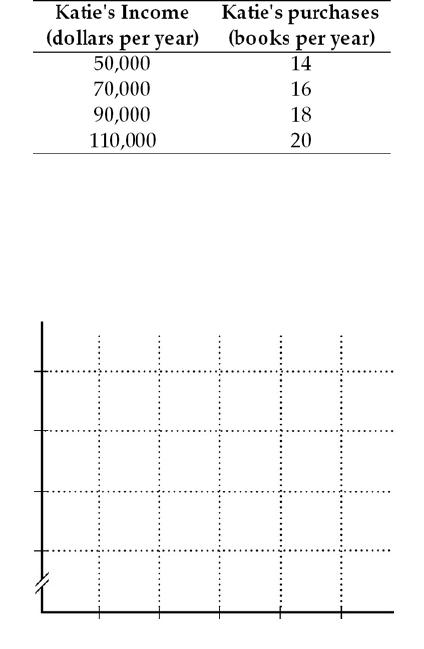
138
Copyright © 2011 Pearson Education, Inc.
14) The table above shows how the number of books Katie buys each year depends on her
income
a. What kind of relationship exists between Katie’s income and the number of books she
purchases?
b. Plot the relationship between Katie’s income and the number of books she purchases in the
above figure. Measure income along the vertical axis and the number of books along the
horizontal axis. Be sure to label the axes.
c. What is the slope of the relationship between $50,000 and $70,000 of income?
d. What is the slope of the relationship between $90,000 and $110,000 of income?
e. Comment on the similarity or dissimilarity of your answers to parts (c) and (d).
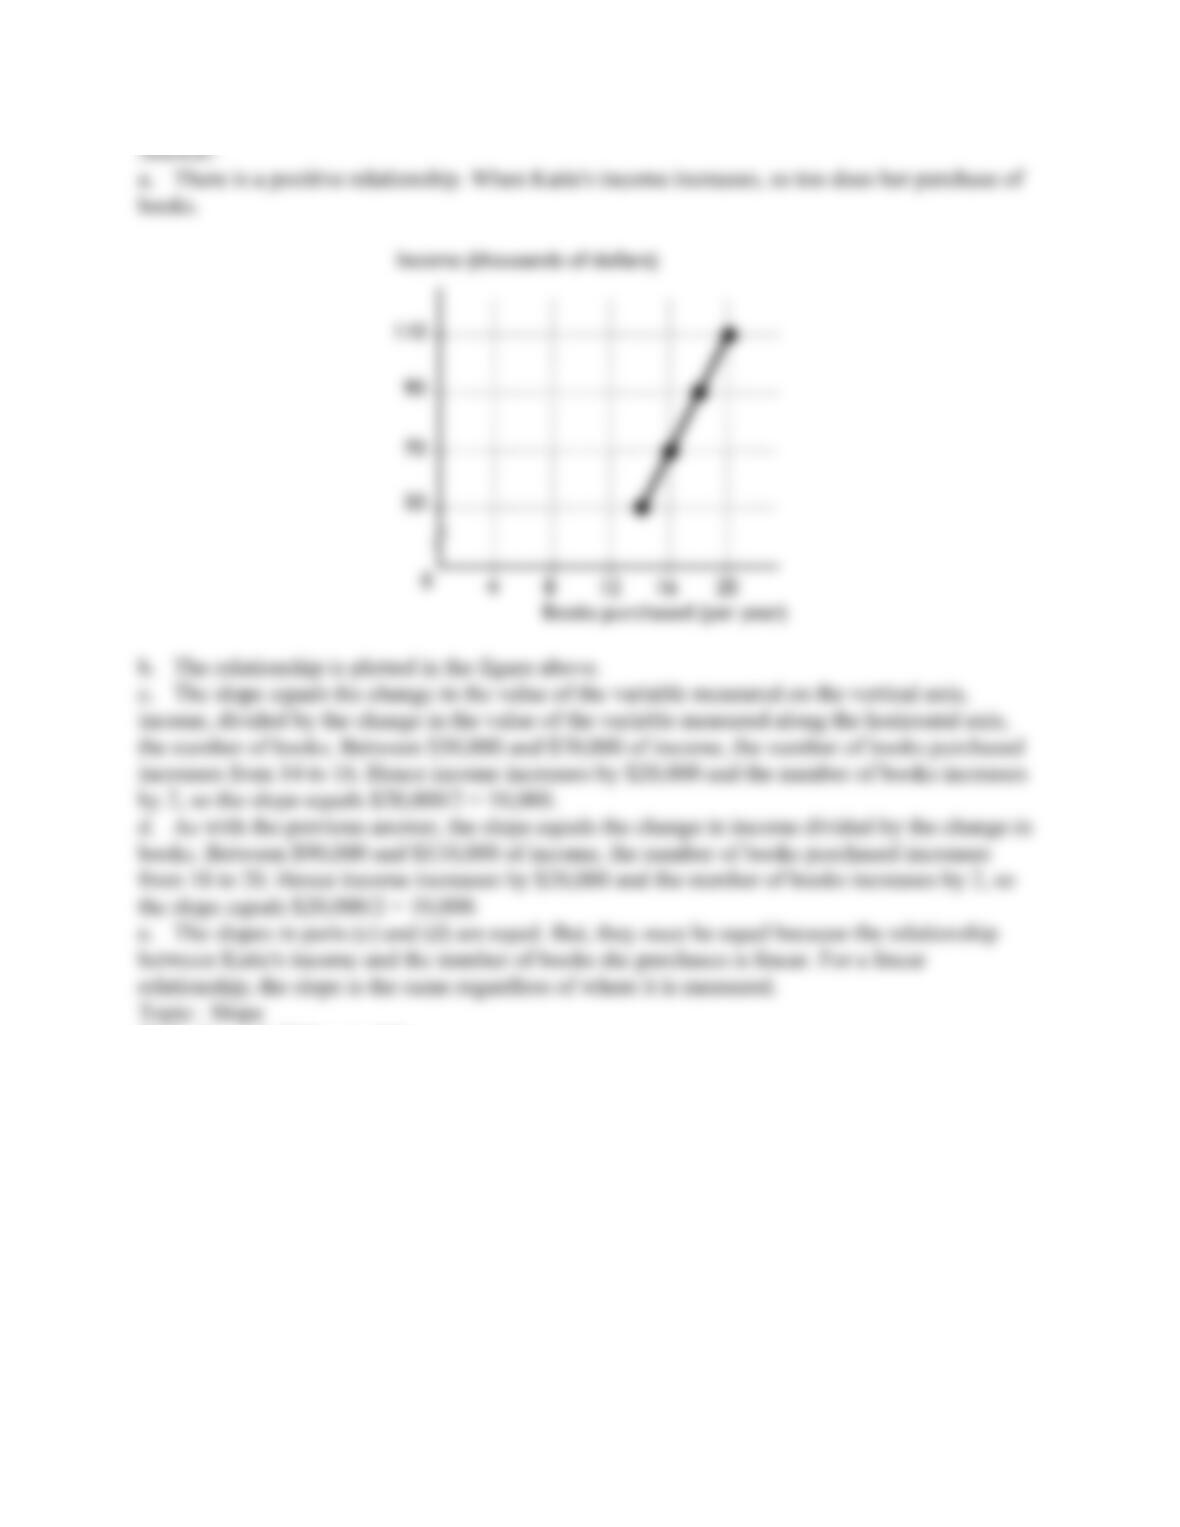
139
Copyright © 2011 Pearson Education, Inc.
Skill: Level 3: Using models
Section: Chapter 1 Appendix – Checkpoint 3
Author: PH
AACSB: Analytical reasoning
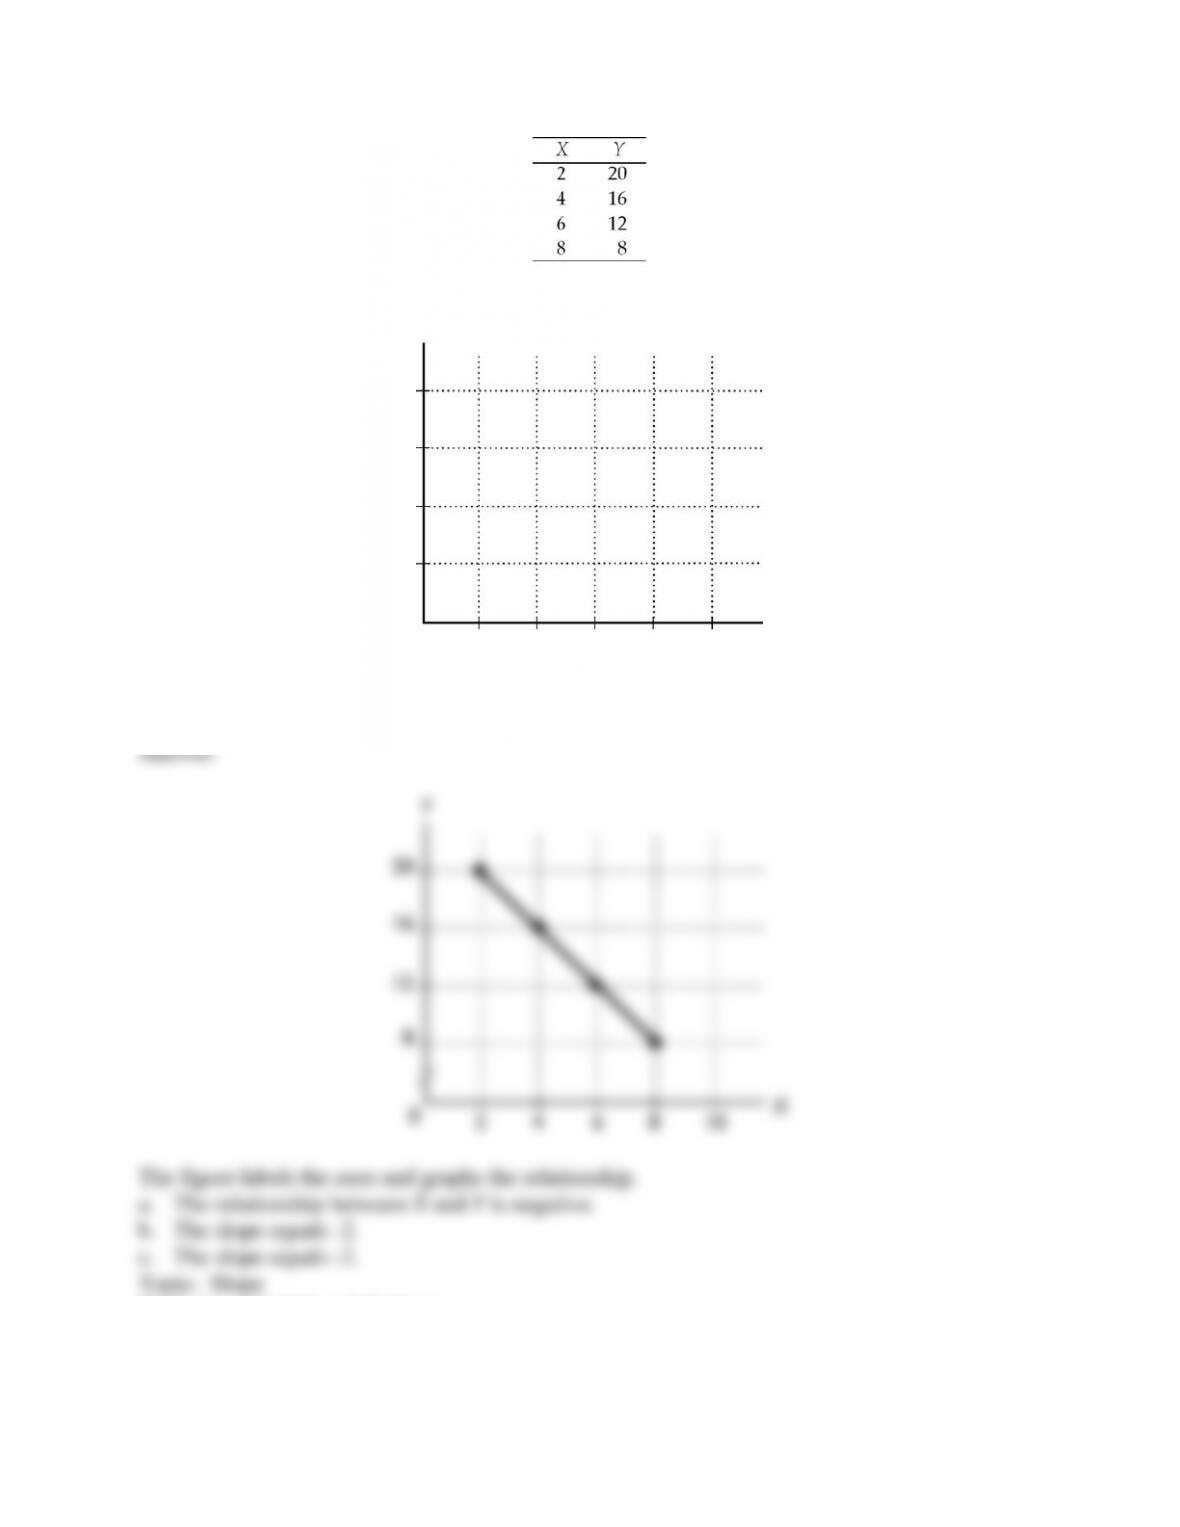
140
Copyright © 2011 Pearson Education, Inc.
15) Graph the data in the table above in the figure. Label the axes.
a. Is the relationship between X and Y positive or negative?
b. What is the slope when X = 4?
c. What is the slope when X = 8?
Skill: Level 2: Using definitions
Section: Chapter 1 Appendix – Checkpoint 3
Author: SB
AACSB: Analytical reasoning
141
Copyright © 2011 Pearson Education, Inc.
16) In the diagram below, draw a straight line with a slope of zero.
Skill: Level 2: Using definitions
Section: Chapter 1 Appendix – Checkpoint 3
Author: MR
AACSB: Analytical reasoning
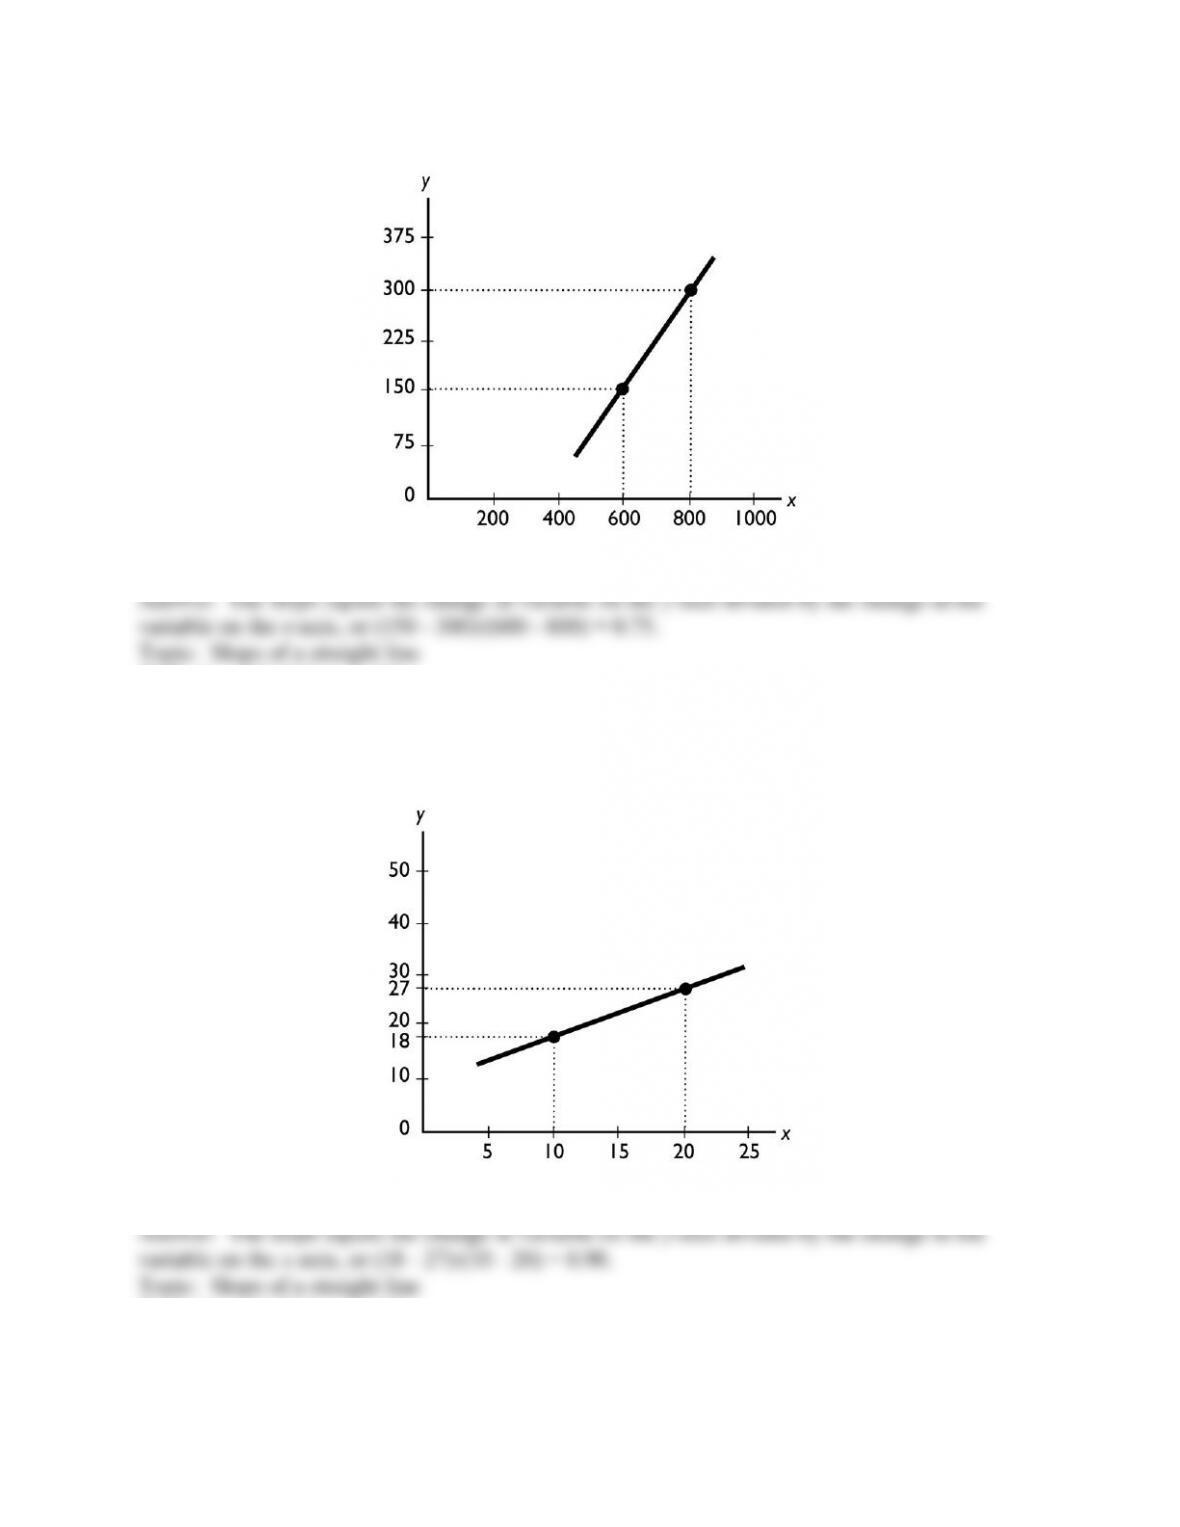
142
Copyright © 2011 Pearson Education, Inc.
17) What does the slope of the line shown in the above figure equal?
Skill: Level 3: Using models
Section: Chapter 1 Appendix – Checkpoint 3
Author: MR
AACSB: Analytical reasoning
18) What does the slope of the line shown in the above figure equal?
Skill: Level 3: Using models
Section: Chapter 1 Appendix – Checkpoint 3
Author: MR
AACSB: Analytical reasoning
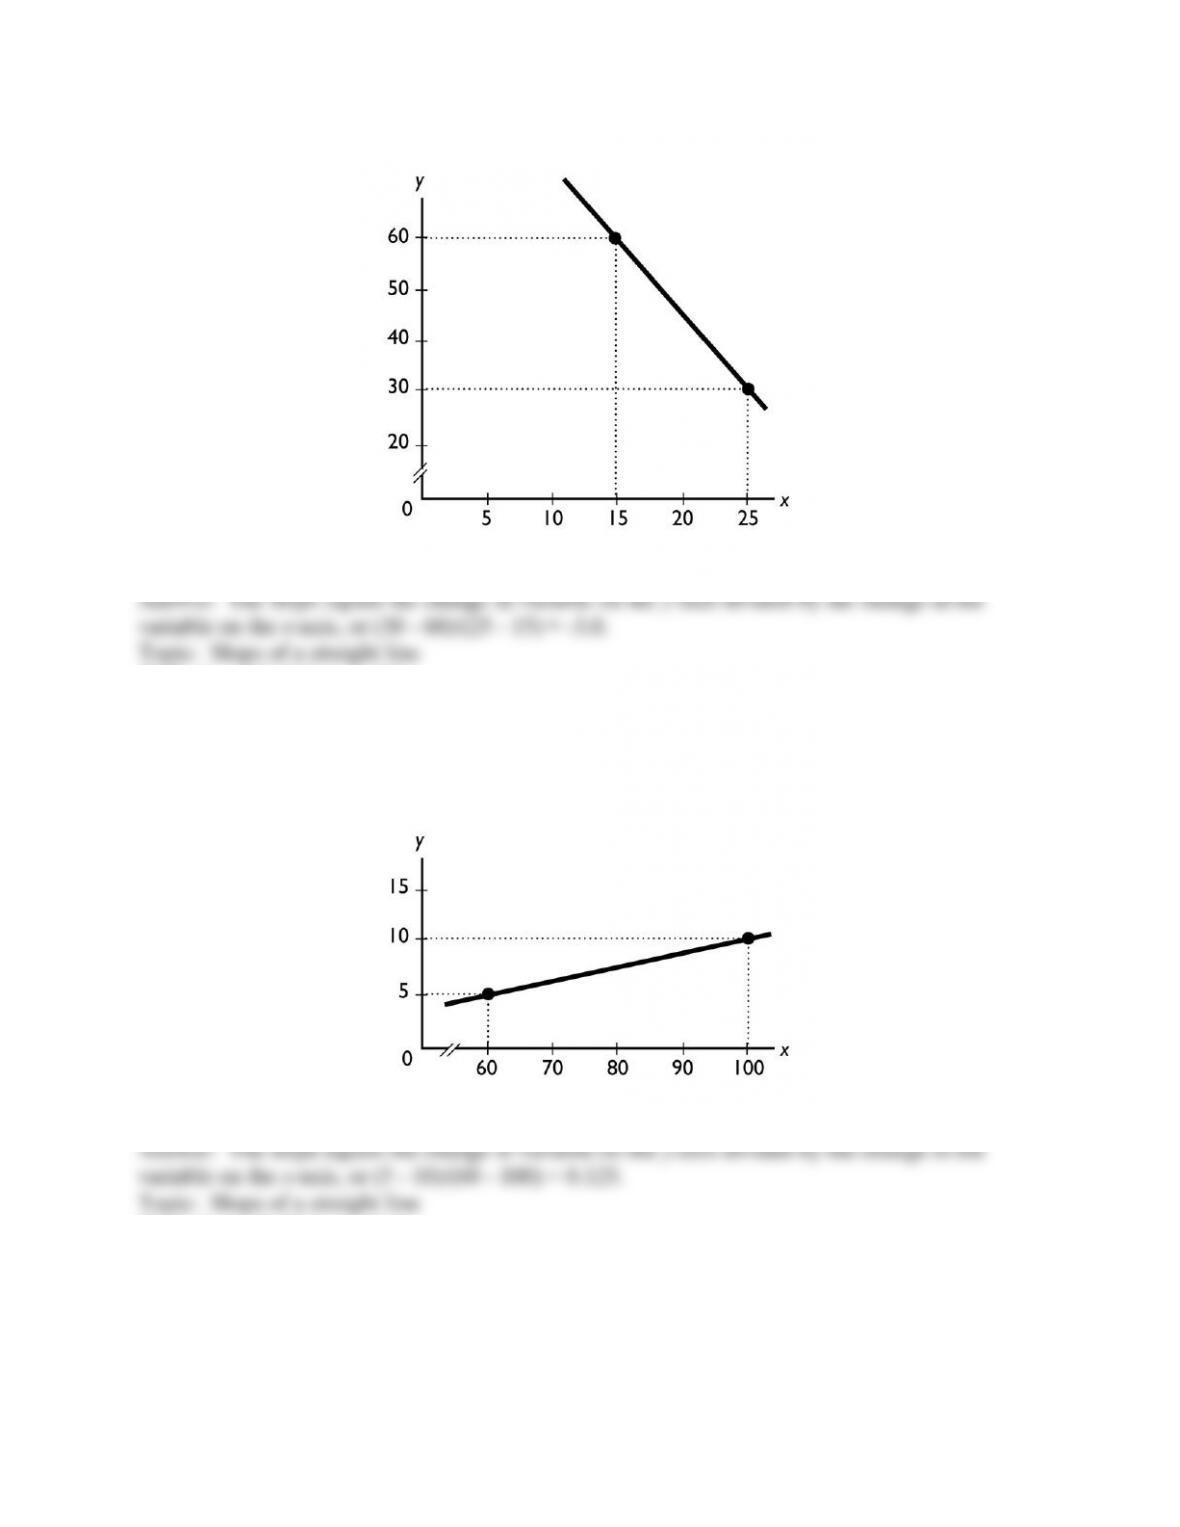
143
Copyright © 2011 Pearson Education, Inc.
19) What does the slope of the line shown in the above figure equal?
Skill: Level 3: Using models
Section: Chapter 1 Appendix – Checkpoint 3
Author: MR
AACSB: Analytical reasoning
20) What does the slope of the line shown in the above figure equal?
Skill: Level 3: Using models
Section: Chapter 1 Appendix – Checkpoint 3
Author: MR
AACSB: Analytical reasoning
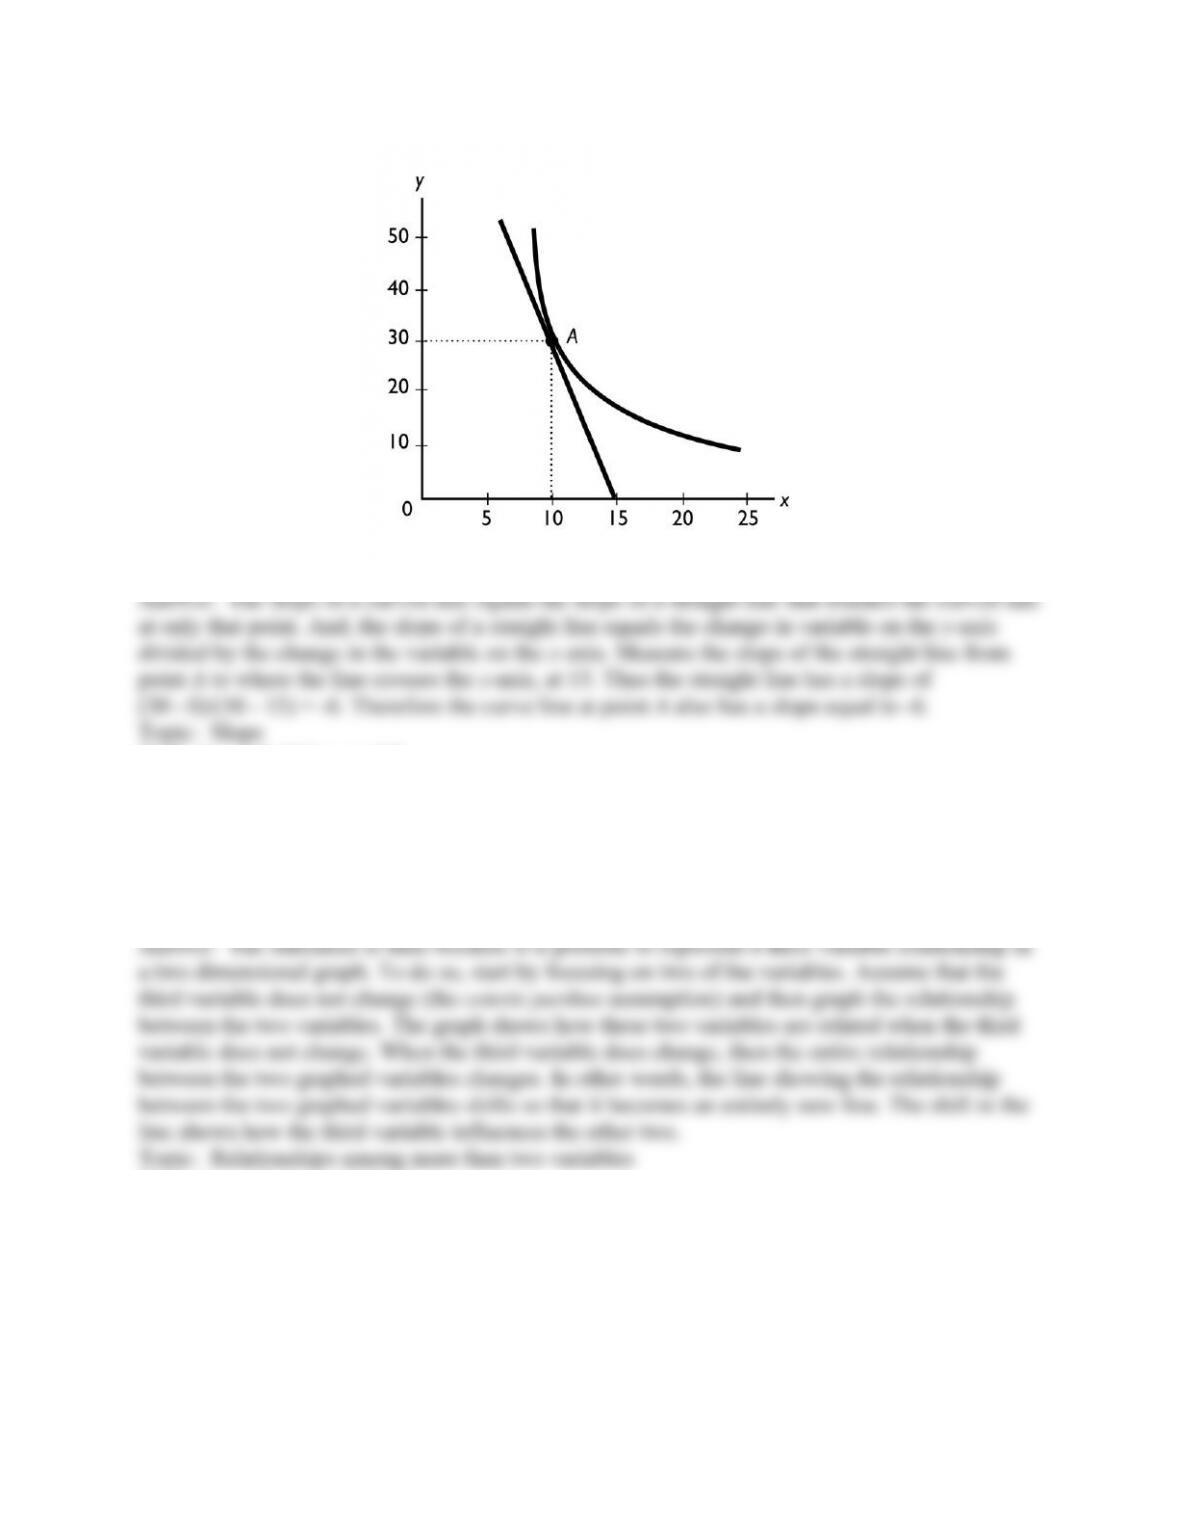
144
Copyright © 2011 Pearson Education, Inc.
21) What does the slope of the curved line at point A shown in the above figure equal?
Skill: Level 3: Using models
Section: Chapter 1 Appendix – Checkpoint 3
Author: MR
AACSB: Analytical reasoning
22) “It is impossible to represent a three variable relationship in a two-dimensional graph.” Is this
statement true or false? Explain your answer.
Skill: Level 2: Using definitions
Section: Chapter 1 Appendix – Checkpoint 4
Author: SB
AACSB: Analytical reasoning
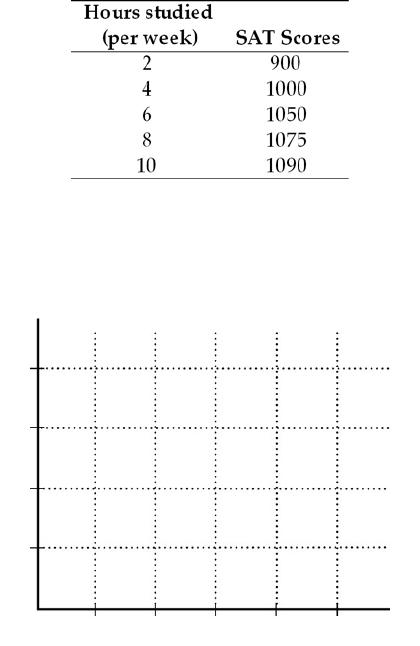
145
Copyright © 2011 Pearson Education, Inc.
23) Jamie is preparing to take his SAT tests. The table above shows how Jamie’s score depends
on the number of hours a week Jamie studies
a. Plot the relationship in the figure, putting the hours studied on the horizontal axis.
b. Is the relationship you plotted positive or negative?
c. What happens to the slope of the relationship as hours studied increase?
d. Suppose Jamie can enroll in an SAT prep course and, by so doing, for every possible number
of hours he studies, his score will be 100 points higher. Plot the new relationship between the
number of hours studied and Jamie‘s SAT score in the figure.
e. How many variables are involved in the figure you just completed?
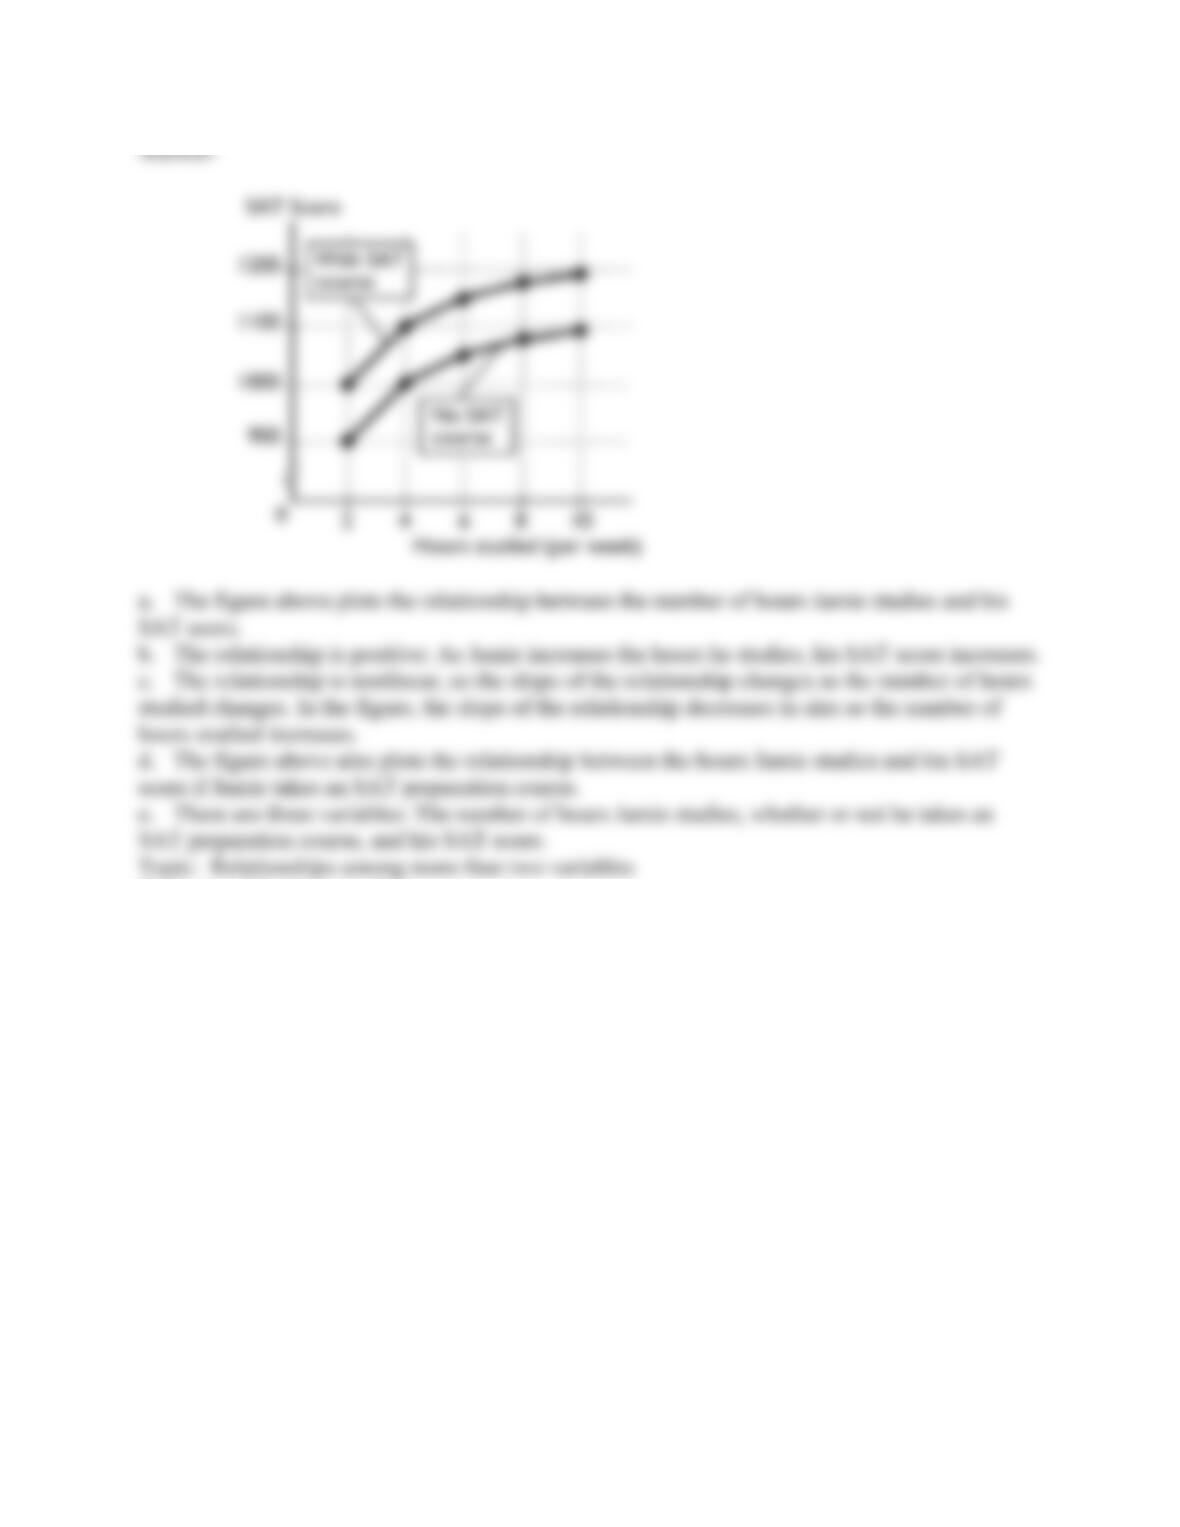
146
Copyright © 2011 Pearson Education, Inc.
Skill: Level 3: Using models
Section: Chapter 1 Appendix – Checkpoint 4
Author: MR
AACSB: Analytical reasoning