1
Copyright © 2011 Pearson Education, Inc.
Foundations of Microeconomics, 5e (Bade/Parkin)
Chapter 19 Inequality and Poverty
19.1 Economic Inequality in the United States
1) In the United States, the poorest 20 percent of the household receive approximately ________
percent of market income.
A) 0.9
B) 7.5
C) 9.5
D) 12.5
E) 20.0
Skill: Level 1: Definition
Section: Checkpoint 19.1
Author: SA
AACSB: Reflective thinking
2) In the United States, the poorest 20 percent of households receive somewhat less than
________ percent of market income.
A) 21
B) 13
C) 19
D) 1
E) 8
Skill: Level 1: Definition
Section: Checkpoint 19.1
Author: JC
AACSB: Reflective thinking
3) In the United States, the richest 20 percent of households receive approximately ________
percent of total income.
A) 33
B) 12
C) 50
D) 75
E) 20
Skill: Level 1: Definition
Section: Checkpoint 19.1
Author: JC
AACSB: Reflective thinking
2
Copyright © 2011 Pearson Education, Inc.
4) In the United States, the poorest 20 percent of households receive about ________ percent of
total income while the richest 20 percent receive about ________ percent of total income.
A) 1; 50
B) 8; 71
C) 12.; 32
D) 13; 68
E) 20; 20
Skill: Level 2: Using definitions
Section: Checkpoint 19.1
Author: PH
AACSB: Reflective thinking
5) Which of the following statements is true regarding the distribution of income in the United
States?
A) The Lorenz curve shows that incomes are distributed fairly.
B) The line of equality shows that incomes are distributed equally.
C) Income inequality occurs because the richest 20 percent of households receive about 50
percent of income.
D) The inequality in the distribution of income can be seen because the Lorenz curve lies above
the line of equality.
E) Both answers C and D are correct.
Skill: Level 3: Using models
Section: Checkpoint 19.1
Author: CD
AACSB: Reflective thinking
6) As a tool that is used to measure inequality in the distribution of income, the Lorenz curve
graphs
A) the cumulative percentage of income against the cumulative percentage of households.
B) the percentage of total income received by each given percentage of households.
C) the mean income, median income, and mode income against the percentage of households.
D) the mean income received by households over time.
E) the cumulative percentage of income against the mean and median income.
Skill: Level 1: Definition
Section: Checkpoint 19.1
Author: MR
AACSB: Reflective thinking
3
Copyright © 2011 Pearson Education, Inc.
7) A Lorenz curve for income shows the
A) demand for Lorenz cough drops.
B) average income graphed against the average number of people in the household.
C) cumulative percentage of income graphed against cumulative percentage of households.
D) relationship between income and wealth.
E) total amount of income graphed against the total number of households.
Skill: Level 1: Definition
Section: Checkpoint 19.1
Author: TS
AACSB: Reflective thinking
8) Lorenz curves are
A) horizontal.
B) vertical.
C) upward sloping.
D) downward sloping.
E) straight lines.
Skill: Level 2: Using definitions
Section: Checkpoint 19.1
Author: SB
AACSB: Reflective thinking
9) A Lorenz curve
A) is identical to the straight line sloping up at a 45° angle.
B) lies above the straight line sloping up at a 45° angle.
C) lies below the straight line sloping up at a 45° angle.
D) starts below the straight line sloping up at a 45° angle and then ends above this line.
E) starts above the straight line sloping up at a 45° angle and then ends below this line.
Skill: Level 2: Using definitions
Section: Checkpoint 19.1
Author: TS
AACSB: Reflective thinking
4
Copyright © 2011 Pearson Education, Inc.
10) If the Lorenz curve for income moves upward toward the 45° line, then the
A) distribution of income has become more unequal.
B) distribution of income has become more equal.
C) mean (average) household income increased.
D) total household income increased.
E) total household income decreased.
Skill: Level 3: Using models
Section: Checkpoint 19.1
Author: TS
AACSB: Reflective thinking
11) If all households in a nation receive the same income, the nation’s Lorenz curve
A) is horizontal.
B) is vertical.
C) is a 45° line.
D) runs along the horizontal axis until it reaches 50 percent of households and then runs
vertically up to 100 percent of income.
E) runs along the horizontal axis until it reaches 100 percent of households and then runs
vertically up to 100 percent of income.
Skill: Level 3: Using models
Section: Checkpoint 19.1
Author: WM
AACSB: Reflective thinking
12) Country A has a more equal distribution of income than country B if
A) country A’s Lorenz curve is closer to the line of equality than is country B’s Lorenz curve.
B) country B’s Lorenz curve is closer to the line of equality than is country A’s Lorenz curve.
C) country A’s Lorenz curve is just as close to the line of equality as is country B’s Lorenz curve.
D) country A’s Lorenz curve lies below country B’s Lorenz curve at low levels of income and
above it at high levels of income.
E) None of the above because it is impossible to compare income inequalities across countries.
Skill: Level 2: Using definitions
Section: Checkpoint 19.1
Author: MR
AACSB: Reflective thinking
5
Copyright © 2011 Pearson Education, Inc.
13) Looking at the Lorenz curves for income distribution in all the world’s nations, we would
find that
A) some nations have Lorenz curves that lie above the 45° line, other nations have Lorenz curves
that lie below the 45° line, but no nation has a Lorenz curve that lie on the 45° line.
B) all nations have Lorenz curves that lie above the 45° line.
C) all nations have Lorenz curves that lie below the 45° line.
D) some nations have Lorenz curves that lie above the 45° line, other nations have Lorenz curves
that lie below the 45° line, and still other nations have a Lorenz curve that lies on the 45° line.
E) None of the above answers is correct.
Skill: Level 5: Critical thinking
Section: Checkpoint 19.1
Author: WM
AACSB: Reflective thinking
Group Percent of
income
Poorest 20% 5
Second poorest
20% 10
Middle 20% 15
Second richest
20% 25
Richest 20% 45
The table gives the distribution of income in Miseria.
14) What percent of income is earned by the richest forty percent?
A) 5 percent
B) 20 percent
C) 70 percent
D) 55 percent
E) More information is needed to answer the question.
Skill: Level 3: Using models
Section: Checkpoint 19.1
Author: MR
AACSB: Analytical reasoning

6
Copyright © 2011 Pearson Education, Inc.
15) What percent of income is earned by the richest 60 percent of the population?
A) 25 percent
B) 30 percent
C) 55 percent
D) 85 percent
E) More information is needed to answer the question.
Skill: Level 3: Using models
Section: Checkpoint 19.1
Author: MR
AACSB: Analytical reasoning
16) What percent of income is earned by the poorest 60 percent of the population?
A) 25 percent
B) 30 percent
C) 55 percent
D) 15 percent
E) More information is needed to answer the question.
Skill: Level 3: Using models
Section: Checkpoint 19.1
Author: MR
AACSB: Analytical reasoning
17) What percent of wealth is owned by the poorest forty percent of the population?
A) 0 percent
B) 2 percent
C) 5 percent
D) 10 percent
Skill: Level 3: Using models
Section: Checkpoint 19.1
Author: MR
AACSB: Analytical reasoning
7
Copyright © 2011 Pearson Education, Inc.
18) What percent of income is earned by the richest 80 percent of the population?
A) 25 percent
B) 95 percent
C) 100 percent
D) 5 percent
E) More information is needed to answer the question.
Skill: Level 3: Using models
Section: Checkpoint 19.1
Author: MR
AACSB: Analytical reasoning
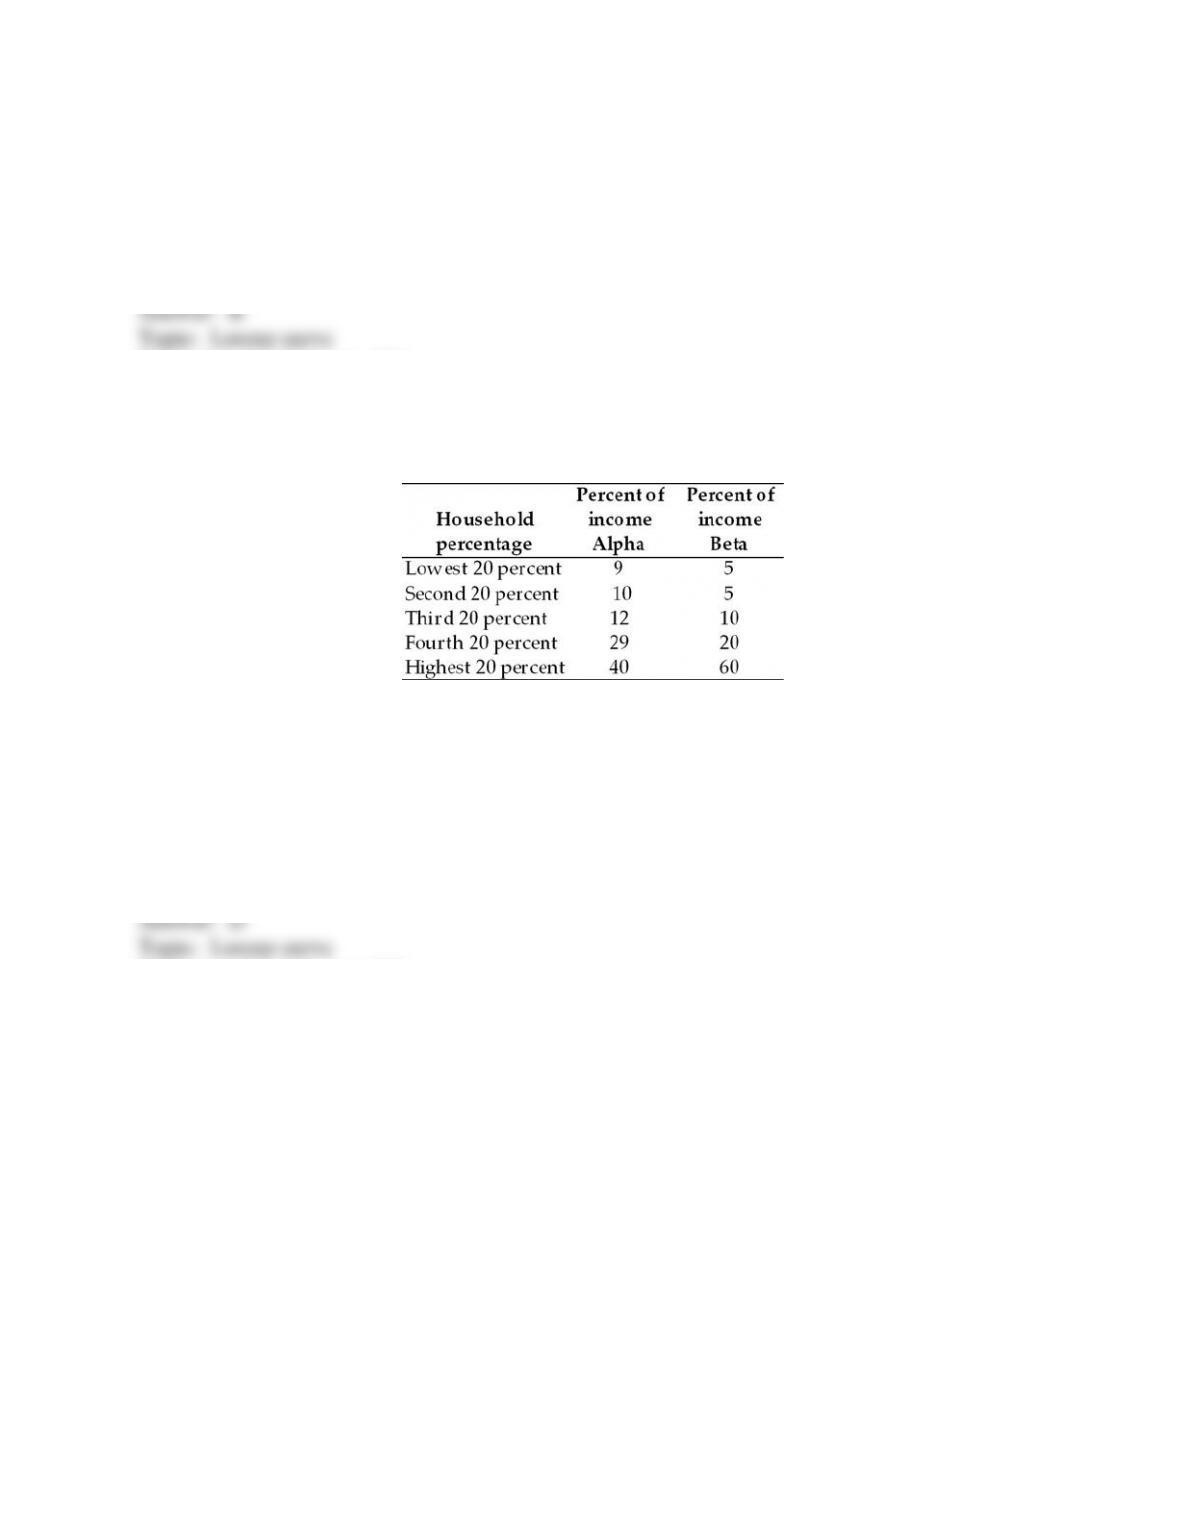
19) The above table shows the distribution of income in two countries, Alpha and Beta. Based on
these distributions of income,
A) Country Beta has more equal income distribution than does Country Alpha.
B) both countries have equal distributions because 100 percent of the incomes are accounted for.
C) the Lorenz Curve for country Beta is closer to the line of equality.
D) Country Alpha has a more equal distribution of income than does Country Beta.
E) It is impossible to answer the question without more information.
Skill: Level 3: Using models
Section: Checkpoint 19.1
Author: CD
AACSB: Analytical reasoning
8
Copyright © 2011 Pearson Education, Inc.
20) The above table shows the distribution of income in two countries, Alpha and Beta. In
Country Alpha, the poorest 20 percent receive ________ percent of total income.
A) 5
B) 9
C) 1
D) 19
E) 14
Skill: Level 3: Using models
Section: Checkpoint 19.1
Author: CD
AACSB: Analytical reasoning
21) The above table shows the distribution of income in two countries, Alpha and Beta. In
Country Beta, the richest 40 percent of households receive ________ percent of total income.
A) 20
B) 40
C) 60
D) 80
E) 100
Skill: Level 3: Using models
Section: Checkpoint 19.1
Author: CD
AACSB: Analytical reasoning
9
Copyright © 2011 Pearson Education, Inc.
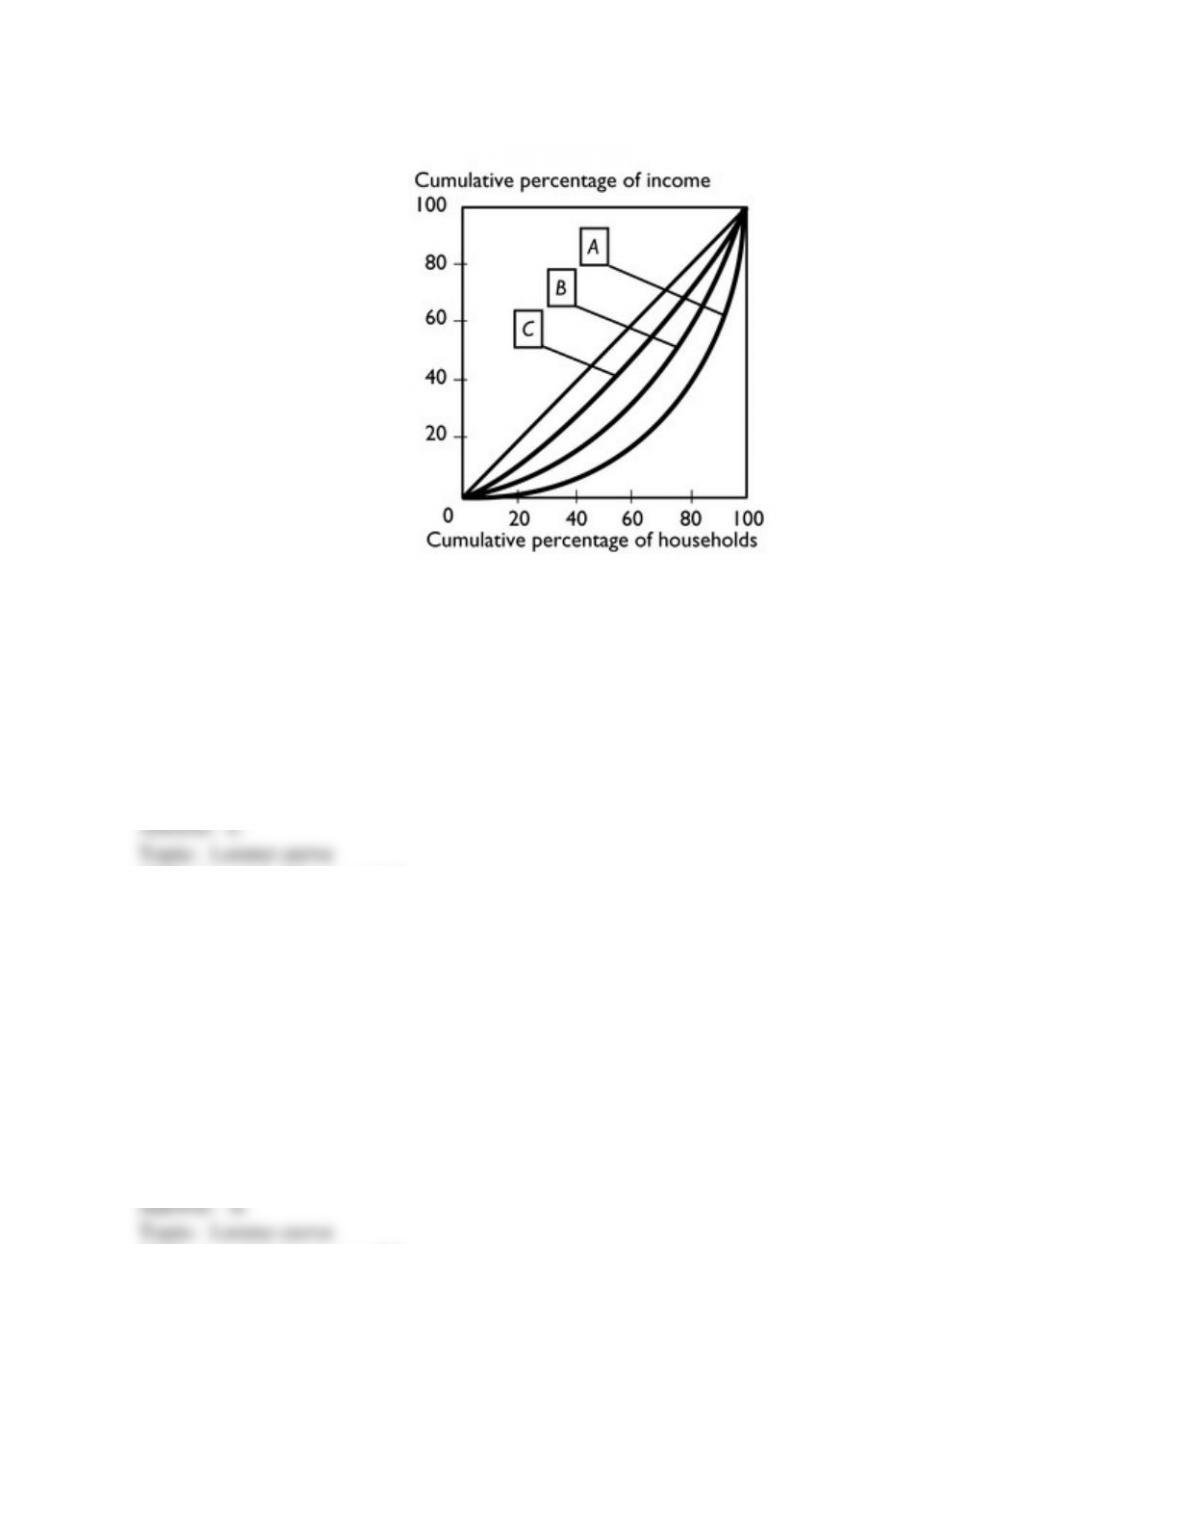
22) In the figure above, the nation with the most equal distribution of income is nation
A) A.
B) B.
C) C.
D) The distribution of income is the same in all three nations because their Lorenz curves can be
plotted on the same diagram.
E) It is impossible to determine with the information given.
Skill: Level 3: Using models
Section: Checkpoint 19.1
Author: PH
AACSB: Analytical reasoning
23) In the figure above, the nation with the least equal distribution of income is nation
A) A.
B) B.
C) C.
D) The distribution of income is the same in all three nations because their Lorenz curves can be
plotted on the same diagram.
E) It is impossible to determine with the information given.
Skill: Level 3: Using models
Section: Checkpoint 19.1
Author: MR
AACSB: Analytical reasoning
10
Copyright © 2011 Pearson Education, Inc.
24) In the figure above, the nation with the highest average income is nation
A) A.
B) B.
C) C.
D) The average income is the same in all three nations because their Lorenz curves can be
plotted on the same diagram.
E) It is impossible to determine with the information given.
Skill: Level 3: Using models
Section: Checkpoint 19.1
Author: MR
AACSB: Analytical reasoning
25) In the United States, it is the case that
A) both income and wealth are equally distributed.
B) wealth is equally distributed but income is distributed unequally.
C) income is equally distributed but wealth is distributed unequally.
D) both income and wealth are unequally distributed and wealth is distributed more unequally
than is income.
E) both income and wealth are unequally distributed and income is distributed more unequally
than is wealth.
Skill: Level 1: Definition
Section: Checkpoint 19.1
Author: TS
AACSB: Reflective thinking
26) Comparing the wealth and income distribution in the United States, we see that
A) wealth is distributed less equally than income.
B) because wealth and income are different terms for the same thing, the distributions are the
same.
C) income is distributed less equally than wealth.
D) we cannot compare the distribution of wealth and income.
E) None of the above answers is correct.
Skill: Level 2: Using definitions
Section: Checkpoint 19.1
Author: WM
AACSB: Reflective thinking
11
Copyright © 2011 Pearson Education, Inc.
27) In the United States, the
A) distribution of income has become more equal since 1967.
B) Lorenz curve for income and the Lorenz curve for wealth are equally close to the line of
equality.
C) Lorenz curve for income is closer to the line of equality than is the Lorenz curve for wealth.
D) Lorenz curve for wealth is closer to the line of equality than is the Lorenz curve for income.
E) None of the above answers is correct.
Skill: Level 4: Applying models
Section: Checkpoint 19.1
Author: CD
AACSB: Reflective thinking
28) Which of the following statements is correct?
A) Wealth inequality in the United States is greater than income inequality.
B) Income inequality in the United States is greater than wealth inequality.
C) Income includes all the things owned by a household at a certain point in time.
D) The top fifth of households have a greater share of the nation’s income than the nation’s
wealth.
E) The fraction of wealth owned by the bottom 20 percent of households is larger than the
fraction income earned by the bottom 20 percent of households.
Skill: Level 2: Using definitions
Section: Checkpoint 19.1
Author: SA
AACSB: Reflective thinking
29) Looking at the income distribution in the United States since 1968, we see that
A) only the lowest 20 percent and highest 20 percent increased their shares of income.
B) the lower 50 percent increased its share of income and the upper 50 percent stayed the same.
C) the highest 20 percent increased its share of income.
D) all the 20 percent groups increased their shares of income.
E) the lower 50 percent increased its share of income and the upper 50 percent decreased its
share of income.
Skill: Level 2: Using definitions
Section: Checkpoint 19.1
Author: WM
AACSB: Reflective thinking
12
Copyright © 2011 Pearson Education, Inc.
30) In the United States, since 1968 the share of income received by the richest 20 percent of
households has ________ and the share received by the other 80 percent of households has
________.
A) increased; increased
B) increased; decreased
C) decreased; increased
D) not changed; not changed
E) increased; not changed
Skill: Level 2: Using definitions
Section: Checkpoint 19.1
Author: PH
AACSB: Reflective thinking
31) In the United States since 1968 income has become ________ equally distributed and since
the 1970s economic mobility among income groups has ________.
A) more; increased
B) more; decreased
C) less; increased
D) less; decreased
E) None of the above answers is correct because economic mobility among income groups
cannot be measured.
Skill: Level 2: Using definitions
Section: Checkpoint 19.1
Author: TS
AACSB: Reflective thinking
32) Since 1968 in the United States, the distribution of income has changed and the group that
benefited the most has been the
A) better educated.
B) less educated.
C) low-skilled workers.
D) middle class, that is the group in the middle 20 percent of the income distribution.
E) None of the above answers is correct because all groups benefited equally.
Skill: Level 5: Critical thinking
Section: Checkpoint 19.1
Author: TS
AACSB: Reflective thinking
13
Copyright © 2011 Pearson Education, Inc.
33) The factor that leads to the largest difference in households’ incomes is
A) race.
B) education.
C) gender.
D) size of household.
E) location of household.
Skill: Level 2: Using definitions
Section: Checkpoint 19.1
Author: SA
AACSB: Reflective thinking
34) ________ is the single biggest factor affecting income distribution in the United States.
A) Location of household
B) Type of household
C) Education
D) Age of household
E) Gender
Skill: Level 1: Definition
Section: Checkpoint 19.1
Author: MR
AACSB: Reflective thinking
35) Of the following major characteristics that lead to income disparity, the factor with the
smallest impact is
A) sex.
B) race.
C) region of the country.
D) education.
E) number of people in the household.
Skill: Level 2: Using definitions
Section: Checkpoint 19.1
Author: WM
AACSB: Reflective thinking
14
Copyright © 2011 Pearson Education, Inc.
36) The highest-income household in the United States today is likely to be a college-educated
A) married white couple.
B) single white female.
C) married Asian couple.
D) single black male.
E) single black female.
Skill: Level 2: Using definitions
Section: Checkpoint 19.1
Author: JC
AACSB: Reflective thinking
37) Measured annual income inequality overstates actual lifetime inequality because
A) poverty levels vary across states.
B) homeless people are not always counted.
C) different households are in different stages in the life cycle.
D) people tend to overstate their incomes.
E) people differ in the amount of education they have attained.
Skill: Level 2: Using definitions
Section: Checkpoint 19.1
Author: SB
AACSB: Reflective thinking
38) The measured inequality of annual income ________ the actual inequality of lifetime income
because ________.
A) overstates; different households are at different stages in the life cycle
B) overstates; the Lorenz curves differ for income and wealth
C) understates; people live in different geographic areas
D) understates; people have different levels of education
E) overstates; different households have different amounts of wealth
Skill: Level 2: Using definitions
Section: Checkpoint 19.1
Author: CD
AACSB: Reflective thinking

15
Copyright © 2011 Pearson Education, Inc.
39) Poverty for a household is defined as the state of
A) having a total income that is below the median total income.
B) having an income that can be spent on food, shelter, and clothing that is below the median for
food, shelter, and clothing.
C) income below what is thought fair.
D) income below what is thought necessary for food, shelter, and clothing.
E) having an income that is below average.
Skill: Level 1: Definition
Section: Checkpoint 19.1
Author: WM
AACSB: Reflective thinking
40) In the United States in 2008, a family of four was considered to be living below the poverty
line only if its household income was less than approximately
A) $400 per year.
B) $4,000 per year.
C) $11,789 per year.
D) $22,800 per year.
E) $35,800 per year.
Skill: Level 2: Using definitions
Section: Checkpoint 19.1
Author: JC
AACSB: Reflective thinking
41) In the United States in 2008, the Census Bureau determined that approximately ________
million Americans lived in households that had incomes below the poverty line.
A) 39
B) 22
C) 84
D) 11
E) 112
Skill: Level 2: Using definitions
Section: Checkpoint 19.1
Author: JC
AACSB: Reflective thinking

16
Copyright © 2011 Pearson Education, Inc.
42) In 2008, the poverty rate in the United States level was approximately ________ percent.
A) 3
B) 13
C) 32
D) 20
E) 26
Skill: Level 2: Using definitions
Section: Checkpoint 19.1
Author: MR
AACSB: Reflective thinking
43) Looking at the U.S. poverty rate by race, we see that
A) the poverty rates by race are now equal.
B) whites have a higher poverty rate than do blacks.
C) Hispanics and blacks have a higher poverty rate than whites.
D) whites have a nearly zero poverty rate while Hispanics and blacks are near 20 percent.
E) whites and blacks have higher poverty rates than do Hispanics.
Skill: Level 3: Using models
Section: Checkpoint 19.1
Author: WM
AACSB: Reflective thinking
44) Which type of household has the lowest poverty rate?
A) black
B) Hispanic
C) white
D) White and Hispanic are almost tied.
E) White and black are almost tied.
Skill: Level 2: Using definitions
Section: Checkpoint 19.1
Author: SB
AACSB: Reflective thinking
17
Copyright © 2011 Pearson Education, Inc.
45) Which of the following is correct about the United States?
A) Income is equally distributed.
B) Wealth is equally distributed.
C) Income is equally distributed but wealth is unequally distributed because of inheritances.
D) Both wealth and income are unequally distributed.
E) Both wealth and income are equally distributed.
Skill: Level 2: Using definitions
Section: Checkpoint 19.1
Author: STUDY GUIDE
AACSB: Reflective thinking
46) If the income distribution is more unequal than the wealth distribution, then the
A) Lorenz curve for income will be farther away from the line of equality than the Lorenz curve
for wealth.
B) government has imposed a higher tax rate on income.
C) Lorenz curve for wealth will be farther away from the line of equality than the Lorenz curve
for income.
D) Lorenz curve for wealth will lie above the Lorenz curve for income.
E) It is not possible to draw the Lorenz curve for wealth on the same figure with the Lorenz
curve for income.
Skill: Level 3: Using models
Section: Checkpoint 19.1
Author: STUDY GUIDE
AACSB: Reflective thinking
47) In the United States since 1967, the share of money income received by the richest 20
percent of households has ________ and the share of income received by the lowest 20 percent
of households has ________.
A) increased; not changed
B) not changed; increased
C) not changed; decreased
D) decreased; increased
E) increased; decreased
Skill: Level 1: Definition
Section: Checkpoint 19.1
Author: STUDY GUIDE
AACSB: Reflective thinking
18
Copyright © 2011 Pearson Education, Inc.
48) In the United States in 2004, the wealthiest 1 percent of households held approximately
________ percent of all wealth.
A) 1
B) 13
C) 27
D) 34
E) 88
Skill: Level 1: Definition
Section: Checkpoint 19.1
Author: STUDY GUIDE
AACSB: Reflective thinking
49) Of all the characteristics that lead to income inequality, the factor with the largest impact is
A) race.
B) sex.
C) age.
D) education.
E) location.
Skill: Level 2: Using definitions
Section: Checkpoint 19.1
Author: STUDY GUIDE
AACSB: Reflective thinking
50) The inequality of annual income
A) overstates the amount of lifetime inequality.
B) understates the amount of lifetime inequality.
C) cannot change from one year to the next.
D) is about the same as the amount of lifetime inequality.
E) cannot be compared to the amount of lifetime inequality.
Skill: Level 2: Using definitions
Section: Checkpoint 19.1
Author: STUDY GUIDE
AACSB: Reflective thinking
19
Copyright © 2011 Pearson Education, Inc.
51) Which of the following statements about poverty is (are) correct?
i. Blacks and Hispanics have higher poverty rates than whites.
ii. Over the last 40 years, poverty rates for all groups have generally increased.
iii. Most household spells of poverty last well beyond 9 months.
A) i only
B) ii only
C) iii only
D) ii and iii
E) i, ii, and iii
Skill: Level 1: Definition
Section: Checkpoint 19.1
Author: STUDY GUIDE
AACSB: Reflective thinking
19.2 How Inequality and Poverty Arise
1) Workers who have invested in education and training
A) are more likely to find jobs that are not rewarding.
B) have a higher value of marginal product.
C) have a more difficult time finding a job because their wage rate is higher.
D) have identical supply curves to otherwise similar workers who have not invested in education
and training.
E) None of the above answers is correct.
Skill: Level 1: Definition
Section: Checkpoint 19.2
Author: SA
AACSB: Reflective thinking
2) The demand for labor
i. depends on the availability of labor.
ii. decreases when the supply of labor increases.
iii. depends on the value of the marginal product of labor.
A) i only
B) i and ii
C) iii only
D) i and iii
E) i, ii, and iii
Skill: Level 1: Definition
Section: Checkpoint 19.2
Author: SA
AACSB: Reflective thinking
20
Copyright © 2011 Pearson Education, Inc.
3) One reason why economists earn more than Taco Bell workers is because economists have a
________ value of marginal product of labor than Taco Bell workers.
A) lower
B) higher
C) similar
D) more convex
E) more concave
Skill: Level 2: Using definitions
Section: Checkpoint 19.2
Author: JC
AACSB: Reflective thinking
4) The gap between the salary of Tom Cruise and an unknown actor is over $15 million per
movie. This difference means that Mr. Cruise’s value of marginal product is
A) over $15 million greater than the value of the marginal product of the unknown actor.
B) less than $15 greater than value of the marginal product of the unknown actor.
C) $15 million greater than the value of the marginal product of the unknown actor.
D) equal to the value of the marginal product of the unknown actor.
E) More information is need to make the comparison.
Skill: Level 2: Using definitions
Section: Checkpoint 19.2
Author: JC
AACSB: Analytical reasoning
5) If a firm is willing to pay a high-skilled worker $25 per hour and a low-skilled worker $10 per
hour then the value of marginal product of skill is
A) $15.
B) $40.
C) $10.
D) $25
E) There is not enough information to answer this question.
Skill: Level 3: Using models
Section: Checkpoint 19.2
Author: MR
AACSB: Analytical reasoning
21
Copyright © 2011 Pearson Education, Inc.
6) Which of the following is true? At a given quantity of employment, if the
i. value of the marginal product of a high-skill worker is $35 and the value of the marginal
product of a low-skill worker is $10, the value of the marginal product of the skill is $25.
ii. value of the marginal product of a high-skill worker is $35 and the value of the marginal
product of a low-skill worker is $10, the cost of acquiring the skill is $25.
iii. value of the marginal product of a skill is $25, then the wage rate must be $25.
A) i only
B) ii only
C) iii only
D) i and iii
E) ii and iii
Skill: Level 2: Using definitions
Section: Checkpoint 19.2
Author: SA
AACSB: Reflective thinking
7) Which of the following is (are) a difference between high-skilled workers and low-skilled
workers?
i. High-skilled workers have a higher value of marginal product.
ii. High-skilled workers have incurred lower opportunity costs to acquire their skills.
iii. The demand for high-skilled workers exceeds that for low-skilled workers.
A) i only
B) ii and iii
C) i and ii
D) i and iii
E) i, ii, and iii
Skill: Level 2: Using definitions
Section: Checkpoint 19.2
Author: TS
AACSB: Reflective thinking
8) The demand curve for high-skilled workers
A) lies to the right of the demand curve for low-skilled workers.
B) lies to the left of the demand curve for low-skilled workers.
C) is vertical.
D) is horizontal.
E) lies to the right of the demand curve for low-skilled workers at high wages and to the left of
the demand curve for low-skilled workers at low wages.
Skill: Level 1: Definition
Section: Checkpoint 19.2
Author: SB
AACSB: Reflective thinking
22
Copyright © 2011 Pearson Education, Inc.
9) Suppose a supply curve for high-skilled labor is drawn in the same graph as a supply curve for
low-skilled labor. The vertical distance between these two curves represents the
A) wage rate paid to a high-skilled worker.
B) wage rate paid to a low-skilled worker.
C) compensation the high-skilled worker requires for the cost of acquiring the skill.
D) number of high-skill workers that will be hired.
E) difference in the value of the marginal product between the high-skilled workers and the low-
skilled workers.
Skill: Level 2: Using definitions
Section: Checkpoint 19.2
Author: SB
AACSB: Reflective thinking
10) Skills are costly to acquire. What forms do these costs take?
i. out-of-pocket expenditures to pay for more education
ii. a higher value of marginal product
iii. forgone earnings while attending higher education
A) i only
B) ii only
C) iii only
D) i and iii
E) i, ii, and iii
Skill: Level 2: Using definitions
Section: Checkpoint 19.2
Author: TS
AACSB: Reflective thinking
23
Copyright © 2011 Pearson Education, Inc.
11) How does the supply curve of high-skilled workers compare to the supply curve of low-
skilled workers?
A) Because skills are costly to acquire, at a given wage rate the quantity supplied of high-skilled
workers is greater than that of low-skilled workers.
B) Because skills are costly to acquire, at any given wage rate the quantity supplied of high-
skilled workers is less than that of low-skilled workers.
C) Because skills are inexpensive to acquire, at any given wage rate the quantity supplied of
high-skilled workers is less than that of low-skilled workers.
D) Because skills are inexpensive to acquire, at any given wage rate the quantity supplied of
high-skilled workers is greater than that of low-skilled workers.
E) None of the above answers is correct.
Skill: Level 1: Definition
Section: Checkpoint 19.2
Author: PH
AACSB: Reflective thinking
12) What determines the position of the supply curve of high-skilled workers relative to that of
low-skilled workers?
A) the cost of acquiring the skill
B) the difference in the demand curves for the two groups
C) Bureau of Labor Standard guidelines
D) the difference in the value of the marginal products
E) None of the above answers is correct.
Skill: Level 2: Using definitions
Section: Checkpoint 19.2
Author: TS
AACSB: Reflective thinking
13) The ________ distance between the supply curve of low-skilled labor and the supply curve
of high-skilled labor is the ________.
A) horizontal; value of marginal product of skill
B) horizontal; compensation for cost of acquiring skill
C) vertical; value of marginal product of skill
D) vertical; compensation for cost of acquiring skill
E) vertical; difference in the price of the product produced b y high-skilled labor minus the price
of the product produced by low-skilled labor
Skill: Level 3: Using models
Section: Checkpoint 19.2
Author: MR
AACSB: Analytical reasoning
24
Copyright © 2011 Pearson Education, Inc.
14) The higher the cost of acquiring skills, the ________ are the high-skilled and low-skilled
labor ________ curves.
A) closer together; demand
B) farther apart; demand
C) closer together; supply
D) farther apart; supply
Skill: Level 3: Using models
Section: Checkpoint 19.2
Author: MR
AACSB: Reflective thinking
15) Pete just started a new job as an assembler and is earning a wage of $10 per hour. Sam, who
is an experienced assembler assigned to train Pete, earns $15 per hour. The opportunity cost to
Pete of acquiring this skill is
A) $25 per hour.
B) $15 per hour.
C) $10 per hour.
D) $5 per hour.
E) $0 per hour because Pete is being paid a wage.
Skill: Level 2: Using definitions
Section: Checkpoint 19.2
Author: SB
AACSB: Reflective thinking
16) High-skilled workers earn more relative to low-skilled workers because the demand for high-
skilled workers is ________ that for low-skilled workers and the supply is ________ that for
low-skilled workers.
A) greater than; greater than
B) greater than; lower than
C) lower than; greater than
D) lower than; lower than
E) greater than; the same as
Skill: Level 2: Using definitions
Section: Checkpoint 19.2
Author: SB
AACSB: Reflective thinking
25
Copyright © 2011 Pearson Education, Inc.
17) The demand curve for high-skilled workers lies ________ the demand curve for low-skilled
workers and the supply curve of high-skilled workers lies ________ the supply curve of low-
skilled workers.
A) above; above
B) above; below
C) below; above
D) below; below
E) above; on
Skill: Level 2: Using definitions
Section: Checkpoint 19.2
Author: WM
AACSB: Reflective thinking
18) High-skilled workers earn more than low-skilled workers in part because the high-skilled
workers have
A) a higher value of marginal product.
B) a lower value of marginal product.
C) better health.
D) fewer deductions.
E) a greater supply than do low-skilled workers.
Skill: Level 2: Using definitions
Section: Checkpoint 19.2
Author: SB
AACSB: Reflective thinking
19) Compared to low-skilled workers, high-skilled workers have a ________ value of marginal
product and ________ opportunity cost of obtaining their skills.
A) higher; a higher
B) higher; a lower
C) lower; a higher
D) lower; a lower
E) higher; the same
Skill: Level 2: Using definitions
Section: Checkpoint 19.2
Author: WM
AACSB: Reflective thinking
26
Copyright © 2011 Pearson Education, Inc.
20) The ________ the value of marginal product of skill, the ________.
A) smaller; larger is the wage differential between low-skilled workers and high-skilled workers
B) larger; more elastic the supply curve of labor
C) larger; larger is the wage differential between low-skilled workers and high-skilled workers
D) smaller; less elastic the supply curve of labor
E) smaller; larger is the cost of acquiring the skill
Skill: Level 3: Using models
Section: Checkpoint 19.2
Author: CD
AACSB: Analytical reasoning
21) The larger the value of the marginal product of a skill, the
A) larger the vertical difference between the demand curves for high- and low-skilled labor.
B) smaller the vertical difference between the demand curves for high- and low-skilled labor.
C) larger the vertical distance between the supply curves for high- and low-skilled labor.
D) smaller the vertical distance between the supply curves for high- and low-skilled labor.
E) higher is the wage rate at which the demand curve for high-skilled workers crosses the
demand curve for low-skilled workers.
Skill: Level 3: Using models
Section: Checkpoint 19.2
Author: MR
AACSB: Reflective thinking
22) The more costly it is to acquire a skill, the
A) more people will go to school to learn the skill.
B) less employers are willing to pay for the skill.
C) greater the wage differential between high-skilled and low-skilled workers.
D) smaller the wage differential between high-skilled and low-skilled workers.
E) the demand for workers with that skill exceeds the demand for workers without that skill.
Skill: Level 3: Using models
Section: Checkpoint 19.2
Author: MR
AACSB: Analytical reasoning
27
Copyright © 2011 Pearson Education, Inc.
23) The rates of return on high school and college educations have
A) not been estimated, but are assumed to be high.
B) been estimated as negative, but these are still good options for most.
C) been estimated at 50 percent per year.
D) been estimated at between 5 to 10 percent per year.
E) been estimated to be essentially zero.
Skill: Level 2: Using definitions
Section: Checkpoint 19.2
Author: MR
AACSB: Reflective thinking
24) Discrimination by customers creates a wage differential between two groups by creating a
difference in the two groups’
A) supply of labor.
B) value of marginal product.
C) marginal cost of labor.
D) minimum wage.
E) opportunity cost of acquiring skills.
Skill: Level 2: Using definitions
Section: Checkpoint 19.2
Author: MR
AACSB: Reflective thinking
25) Increased discrimination results in ________ of the workers discriminated against being
hired and being paid ________ wage rates.
A) more; higher
B) more; lower
C) fewer; higher
D) fewer; lower
E) the same number; lower
Skill: Level 3: Using models
Section: Checkpoint 19.2
Author: WM
AACSB: Reflective thinking
28
Copyright © 2011 Pearson Education, Inc.
26) If buyers discriminate against women and minorities,
i. the value of the marginal product of women and minorities is less than otherwise.
ii. the wage rate paid to women and minorities is less than otherwise.
iii. more women and minorities are hired than otherwise.
A) i only
B) ii only
C) ii and iii
D) i and ii
E) i, ii, and iii
Skill: Level 2: Using definitions
Section: Checkpoint 19.2
Author: SA
AACSB: Reflective thinking
27) What economic effect works to eliminate sex and race discrimination?
A) Firms hire only the preferred races and sex.
B) Lower paid races and sexes give up working and drop out of the labor supply.
C) Customers who discriminate pay higher prices to buy from preferred races and sex.
D) The value of the marginal product of the less preferred races and sexes eventually increases.
E) Lower paid races and sexes decrease their demand for goods and services.
Skill: Level 2: Using definitions
Section: Checkpoint 19.2
Author: TS
AACSB: Reflective thinking
28) Looking at wage differentials between white men and other groups in the United States, we
see that
A) white men and black men earn about the same but women of all races earn less.
B) white men earn more than black men but white women earn less than black men.
C) black men earn less than white men and less than white women.
D) white men and white women earn about the same but minorities earn less.
E) black men and men of Hispanic origin earn about the same amount and both groups of men
are paid more than black women and women of Hispanic origin.
Skill: Level 2: Using definitions
Section: Checkpoint 19.2
Author: WM
AACSB: Reflective thinking
29
Copyright © 2011 Pearson Education, Inc.
29) Looking at wage differentials between white women and white men in the United States
since 1988, we see that the amount of the difference
A) has not changed.
B) has increased.
C) has decreased.
D) at first increased but in the last decade it decreased.
E) at first decreased but in the last decade it increased.
Skill: Level 2: Using definitions
Section: Checkpoint 19.2
Author: MR
AACSB: Reflective thinking
30) Which of the following is correct? On the average,
i. the wage differential between white males and white females has narrowed since 1988.
ii. black females are paid more than black males.
iii. the pay of black males and Hispanic males are essentially equal.
A) i only
B) ii only
C) ii and iii
D) i and iii
E) i, ii, and iii
Skill: Level 2: Using definitions
Section: Checkpoint 19.2
Author: SA
AACSB: Reflective thinking
31) Differences in skills
i. can arise partly from differences in education and/or partly from differences in on-the-job
training.
ii. can lead to large differences in earnings.
iii. result in different demand curves for high-skilled and low-skilled labor.
A) i only
B) ii only
C) ii and iii
D) i and iii
E) i, ii, and iii
Skill: Level 1: Definition
Section: Checkpoint 19.2
Author: STUDY GUIDE
AACSB: Reflective thinking
30
Copyright © 2011 Pearson Education, Inc.
32) Other things being equal, the demand curve for low-skilled workers ________ the demand
curve for high-skilled workers.
A) lies below
B) lies above
C) is the same as
D) is not comparable to
E) at high wages lies below and at low wages lies above
Skill: Level 1: Definition
Section: Checkpoint 19.2
Author: STUDY GUIDE
AACSB: Analytical reasoning
33) The cost of acquiring a skill accounts for why the
A) demand for high-skilled workers is different from the demand for low-skilled workers.
B) supply of high-skilled workers is different from the supply of low-skilled workers.
C) demand for high-skilled workers is different from the supply of high-skilled workers.
D) demand for high-skilled workers is different from the supply of low-skilled workers.
E) supply curves of high-skilled and low-skilled workers cross.
Skill: Level 1: Definition
Section: Checkpoint 19.2
Author: STUDY GUIDE
AACSB: Reflective thinking
34) The vertical distance between the supply curves for neurosurgeons and the supply curve for
fast-food servers
A) represents the difference in the demand for these two occupations.
B) is the compensation that neurosurgeons require for the cost of acquiring this skill.
C) is the difference in the value of the marginal product of the two professions.
D) is the difference in on-the-job training.
E) equals the difference in the equilibrium wages paid these two professions.
Skill: Level 1: Definition
Section: Checkpoint 19.2
Author: STUDY GUIDE
AACSB: Analytical reasoning
31
Copyright © 2011 Pearson Education, Inc.
35) The wage rate that high-skilled workers receive is ________ the wage rate that low-skill
workers receive.
A) greater than or equal to
B) equal to
C) less than or equal to
D) greater than
E) less than
Skill: Level 2: Using definitions
Section: Checkpoint 19.2
Author: STUDY GUIDE
AACSB: Reflective thinking
36) If discrimination against women decreases their value of marginal product, then women will
have ________ wage rate than men and there will be ________ high-paying jobs for women.
A) a lower; more
B) a higher; fewer
C) a lower; fewer
D) a higher; more
E) the same; fewer
Skill: Level 3: Using models
Section: Checkpoint 19.2
Author: STUDY GUIDE
AACSB: Analytical reasoning
37) Inequality in the distribution of income and wealth is increased by
A) the point that the children of the poorest find it difficult to get into college.
B) saving to redistribute an uneven income over the life cycle.
C) marrying outside one’s own socioeconomic class.
D) donating money to charities.
E) the U.S. income tax.
Skill: Level 3: Using models
Section: Checkpoint 19.2
Author: STUDY GUIDE
AACSB: Reflective thinking
32
Copyright © 2011 Pearson Education, Inc.
19.3 Income Redistribution
1) The three main ways that governments in the United States redistribute income are
A) using the rule of law, subsidized services, and income taxes.
B) private property rights, income taxes and the minimum wage.
C) income taxes, income maintenance programs, and subsidized services.
D) income taxes, rent control, and food stamps.
E) sales taxes, food stamps, and subsidized services.
Skill: Level 1: Definition
Section: Checkpoint 19.3
Author: JC
AACSB: Reflective thinking
2) Which of the following currently helps redistribute income in the United States?
i. negative income tax
ii. progressive income taxes
iii. Social Security
A) ii and iii
B) i and ii
C) i and iii
D) i, ii, and iii
E) iii only
Skill: Level 2: Using definitions
Section: Checkpoint 19.3
Author: CD
AACSB: Reflective thinking
3) A progressive income tax is a tax for which the average tax rate
A) increases as income increases.
B) becomes negative as income decreases.
C) decreases as income increases.
D) stays the same regardless of the income level.
E) first slowly decreases and then rapidly increases as income increases.
Skill: Level 1: Definition
Section: Checkpoint 19.3
Author: PH
AACSB: Reflective thinking

33
Copyright © 2011 Pearson Education, Inc.
4) A tax is progressive if the average tax rate
A) increases as income increases.
B) increases as income decreases.
C) is negative.
D) is positive.
Skill: Level 1: Definition
Section: Checkpoint 19.3
Author: MR
AACSB: Reflective thinking
5) A ________ tax is one that taxes income at an average rate that decreases with the level of
income.
A) regressive
B) progressive
C) flat
D) social security
E) proportional
Skill: Level 1: Definition
Section: Checkpoint 19.3
Author: JC
AACSB: Reflective thinking
6) A regressive income tax is a tax for which the average tax rate
A) increases as income increases.
B) becomes negative as income decreases.
C) decreases as income increases.
D) stays the same regardless of the income level.
E) first increases and then decreases as income increases.
Skill: Level 1: Definition
Section: Checkpoint 19.3
Author: PH
AACSB: Reflective thinking
34
Copyright © 2011 Pearson Education, Inc.
7) A ________ has a constant tax rate regardless of the level of income.
A) regressive tax
B) progressive tax
C) state tax
D) proportional tax
E) subsidy tax
Skill: Level 1: Definition
Section: Checkpoint 19.3
Author: PH
AACSB: Reflective thinking
8) In the United States, the federal and state income tax system is
A) progressive.
B) proportional.
C) regressive.
D) a flat-rate tax.
E) None of the above answers is correct.
Skill: Level 1: Definition
Section: Checkpoint 19.3
Author: SA
AACSB: Reflective thinking
9) Which of the following is(are) an example of an income maintenance program?
i. unemployment compensation
ii. welfare programs
iii. social security programs
A) i and iii
B) ii and iii
C) iii only
D) i and ii
E) i, ii, and iii
Skill: Level 1: Definition
Section: Checkpoint 19.3
Author: TS
AACSB: Reflective thinking
35
Copyright © 2011 Pearson Education, Inc.
10) Three types of income maintenance programs used by the United States are
A) income taxes, Social Security, and the earned income tax credit.
B) Social Security programs, OASDHI, and income taxes.
C) Social Security programs, unemployment compensation, and welfare programs.
D) welfare programs, income taxes, and the earned income tax credit.
E) income taxes, Social Security, and subsidized services.
Skill: Level 1: Definition
Section: Checkpoint 19.3
Author: WM
AACSB: Reflective thinking
11) Social Security is a ________ program paid for by ________.
A) compulsory; payroll taxes
B) compulsory; government money
C) voluntary; payroll taxes
D) voluntary; income taxes
E) compulsory; voluntary taxes on income
Skill: Level 1: Definition
Section: Checkpoint 19.3
Author: JC
AACSB: Reflective thinking
12) Social Security and unemployment compensation
A) are paid only to the poorest households.
B) are both funded by income taxes.
C) are distributed by individual states.
D) both redistribute income.
E) make the distribution of income less equal.
Skill: Level 2: Using definitions
Section: Checkpoint 19.3
Author: CD
AACSB: Reflective thinking
36
Copyright © 2011 Pearson Education, Inc.
13) ________ is a component of welfare programs.
A) A progressive income tax
B) Unemployment compensation
C) Medicaid
D) Social Security payroll taxes
E) The negative income tax
Skill: Level 1: Definition
Section: Checkpoint 19.3
Author: CD
AACSB: Reflective thinking
14) Looking at the results of government income redistribution programs, we find that the
income received by the
A) lowest 20 percent of households is almost unchanged because most don’t work.
B) highest 20 percent is left unaffected because they are able to shelter income from taxes.
C) lowest 20 percent increases and the income received by the highest 20 percent decreases.
D) lowest 20 percent increases somewhat but the income received by the next 20 percent
increases the most.
E) lowest 20 percent decreases because of government taxes and the income received by the
highest 20 percent increases because of government subsidies.
Skill: Level 2: Using definitions
Section: Checkpoint 19.3
Author: WM
AACSB: Reflective thinking
15) Passing the TANF welfare program has
A) has made welfare programs more open-ended entitlement programs.
B) limited assistance to five years.
C) eliminated work and public service requirements.
D) hurt economic incentives to work.
E) made it into a negative income tax program.
Skill: Level 2: Using definitions
Section: Checkpoint 19.3
Author: SB
AACSB: Reflective thinking
37
Copyright © 2011 Pearson Education, Inc.
16) A negative income tax is a system that, in part,
A) taxes lower-income households at a higher rate.
B) taxes higher-income households at a higher rate.
C) guarantees a minimum level of income for all households.
D) gives money from taxes paid by the poor to wealthy investors.
E) guarantees a minimum level of taxation for all households.
Skill: Level 1: Definition
Section: Checkpoint 19.3
Author: WM
AACSB: Reflective thinking
17) Which of the following characterizes the negative income tax concept?
A) It is a flat tax that lower-income households do not pay.
B) It is a progressive tax structure with enough deductions to provide refunds to some.
C) It is a regressive tax with low-income earners getting a refund back when taxes are filed.
D) It is a guaranteed annual income with earned incomes taxed at a flat rate.
E) It is an income tax that eliminates all the inefficiency that occurs with the current tax system.
Skill: Level 2: Using definitions
Section: Checkpoint 19.3
Author: TS
AACSB: Reflective thinking
18) A negative income tax
A) is a regressive income tax.
B) is currently in use in the United States.
C) makes the redistribution of income efficient.
D) provides every household with a guaranteed minimum annual income.
E) cannot be enacted in the United States because it is unconstitutional.
Skill: Level 2: Using definitions
Section: Checkpoint 19.3
Author: CD
AACSB: Reflective thinking
38
Copyright © 2011 Pearson Education, Inc.
19) With a negative income tax that has a $10,000 guaranteed income and a 25 percent tax rate, a
household that has a market income of $4,000 has a total income of
A) $15,000.
B) $14,000.
C) $13,000.
D) $10,000.
E) $7,000.
Skill: Level 3: Using models
Section: Checkpoint 19.3
Author: MR
AACSB: Analytical reasoning
20) Which of the following is a way income is redistributed in the United States?
i. subsidizing services
ii. income taxes
iii. income maintenance programs
A) i only
B) ii only
C) ii and iii
D) i and iii
E) i, ii, and iii
Skill: Level 2: Using definitions
Section: Checkpoint 19.3
Author: STUDY GUIDE
AACSB: Reflective thinking
21) A ________ tax is one that taxes income at an average rate that increases with the level of
income.
A) regressive
B) progressive
C) flat
D) consumption
E) proportional
Skill: Level 1: Definition
Section: Checkpoint 19.3
Author: STUDY GUIDE
AACSB: Reflective thinking
39
Copyright © 2011 Pearson Education, Inc.
22) Of the following types of income tax systems, the one that provides the greatest amount of
redistribution from the rich to the poor is a
A) progressive income tax.
B) proportional income tax.
C) regressive income tax.
D) flat-rate income tax.
E) money-income tax.
Skill: Level 2: Using definitions
Section: Checkpoint 19.3
Author: STUDY GUIDE
AACSB: Reflective thinking
23) The three major types of income maintenance programs are
A) Social Security programs, unemployment compensation, and welfare programs.
B) food stamps, unemployment compensation, and agricultural price supports.
C) student loans, rent control, and welfare programs.
D) corporate welfare, minimum wages, and affirmative action laws.
E) minimum wages, food stamps, and student loans.
Skill: Level 1: Definition
Section: Checkpoint 19.3
Author: STUDY GUIDE
AACSB: Reflective thinking
24) A household’s income earned from the markets for factors of production and with no
government redistribution is
A) money income.
B) welfare.
C) market income.
D) exploitative income.
E) factored income.
Skill: Level 1: Definition
Section: Checkpoint 19.3
Author: STUDY GUIDE
AACSB: Reflective thinking
40
Copyright © 2011 Pearson Education, Inc.
25) When government redistributes income, one dollar collected from a rich person translates
into ________ received by a poor person.
A) exactly one dollar
B) less than one dollar
C) more than one dollar
D) zero dollars
E) either exactly one dollar or, with some programs, more than one dollar
Skill: Level 2: Using definitions
Section: Checkpoint 19.3
Author: STUDY GUIDE
AACSB: Reflective thinking
26) With a negative income tax that has a $10,000 guaranteed minimum income and a 25 percent
tax rate, a household that has earned income of $16,000 has a total income of
A) $16,000.
B) $22,000.
C) $26,000.
D) $24,000.
E) $10,000.
Skill: Level 3: Using models
Section: Checkpoint 19.3
Author: STUDY GUIDE
AACSB: Analytical reasoning
41
Copyright © 2011 Pearson Education, Inc.
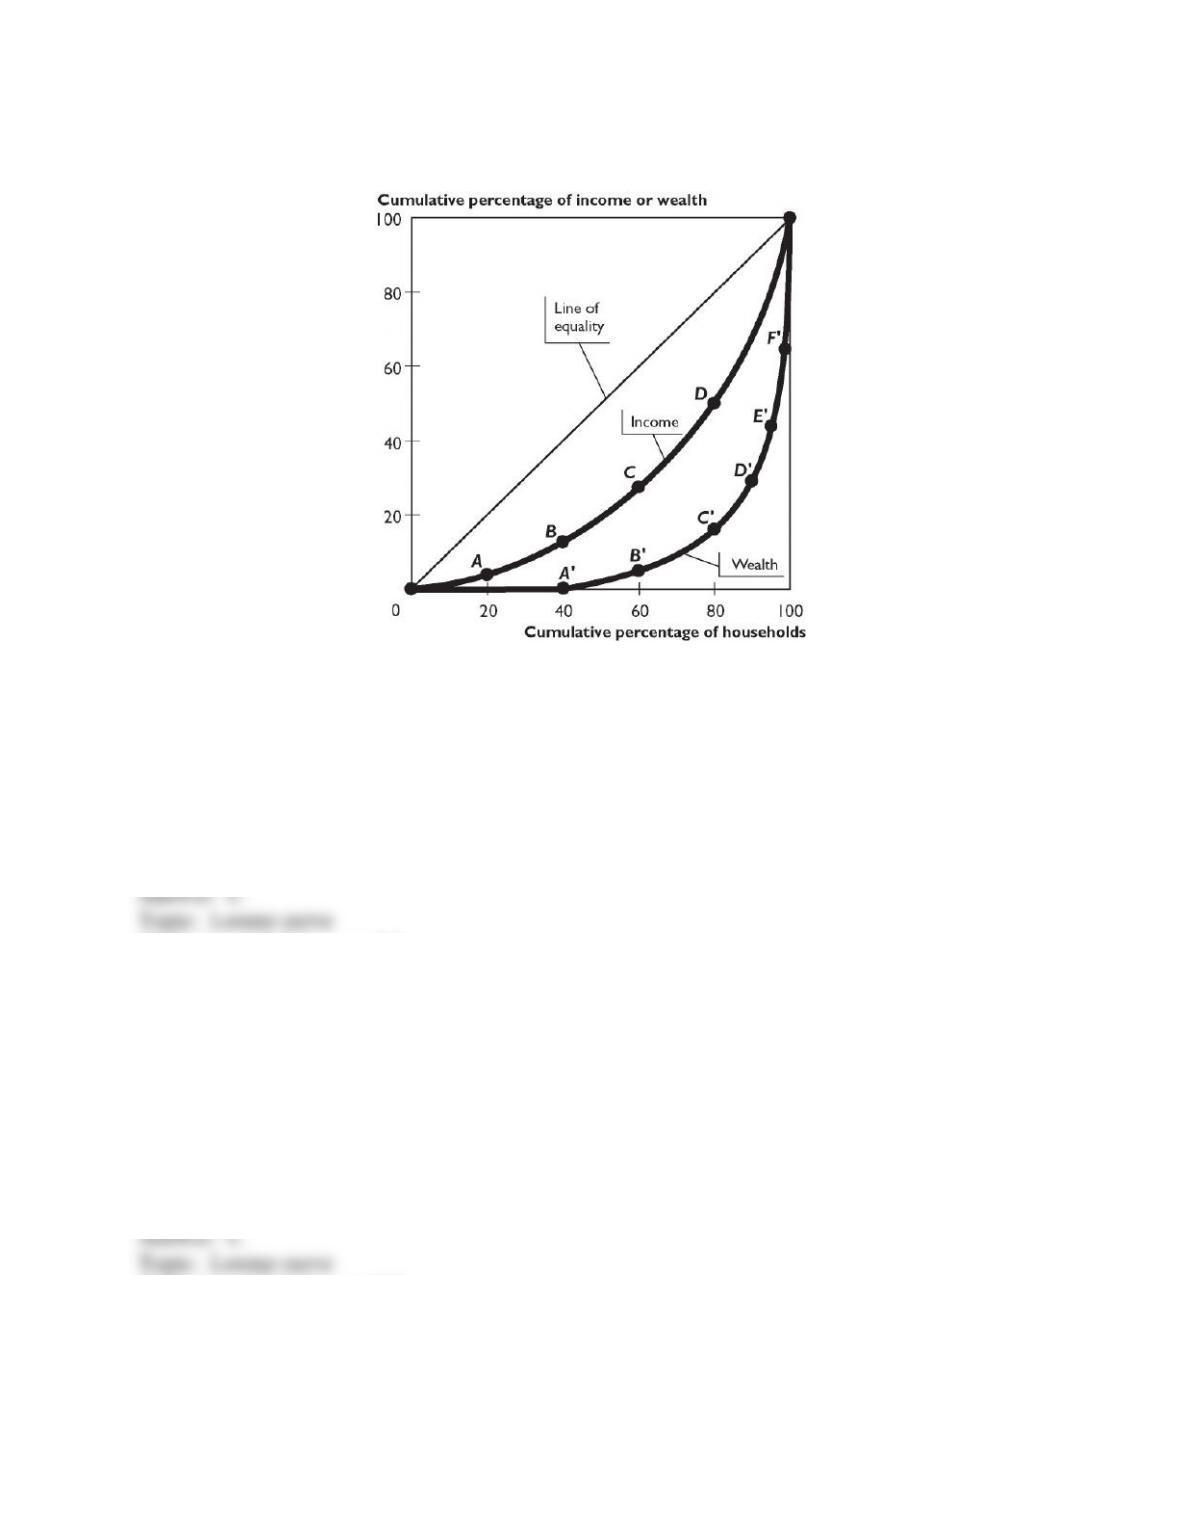
19.4 Chapter Figures
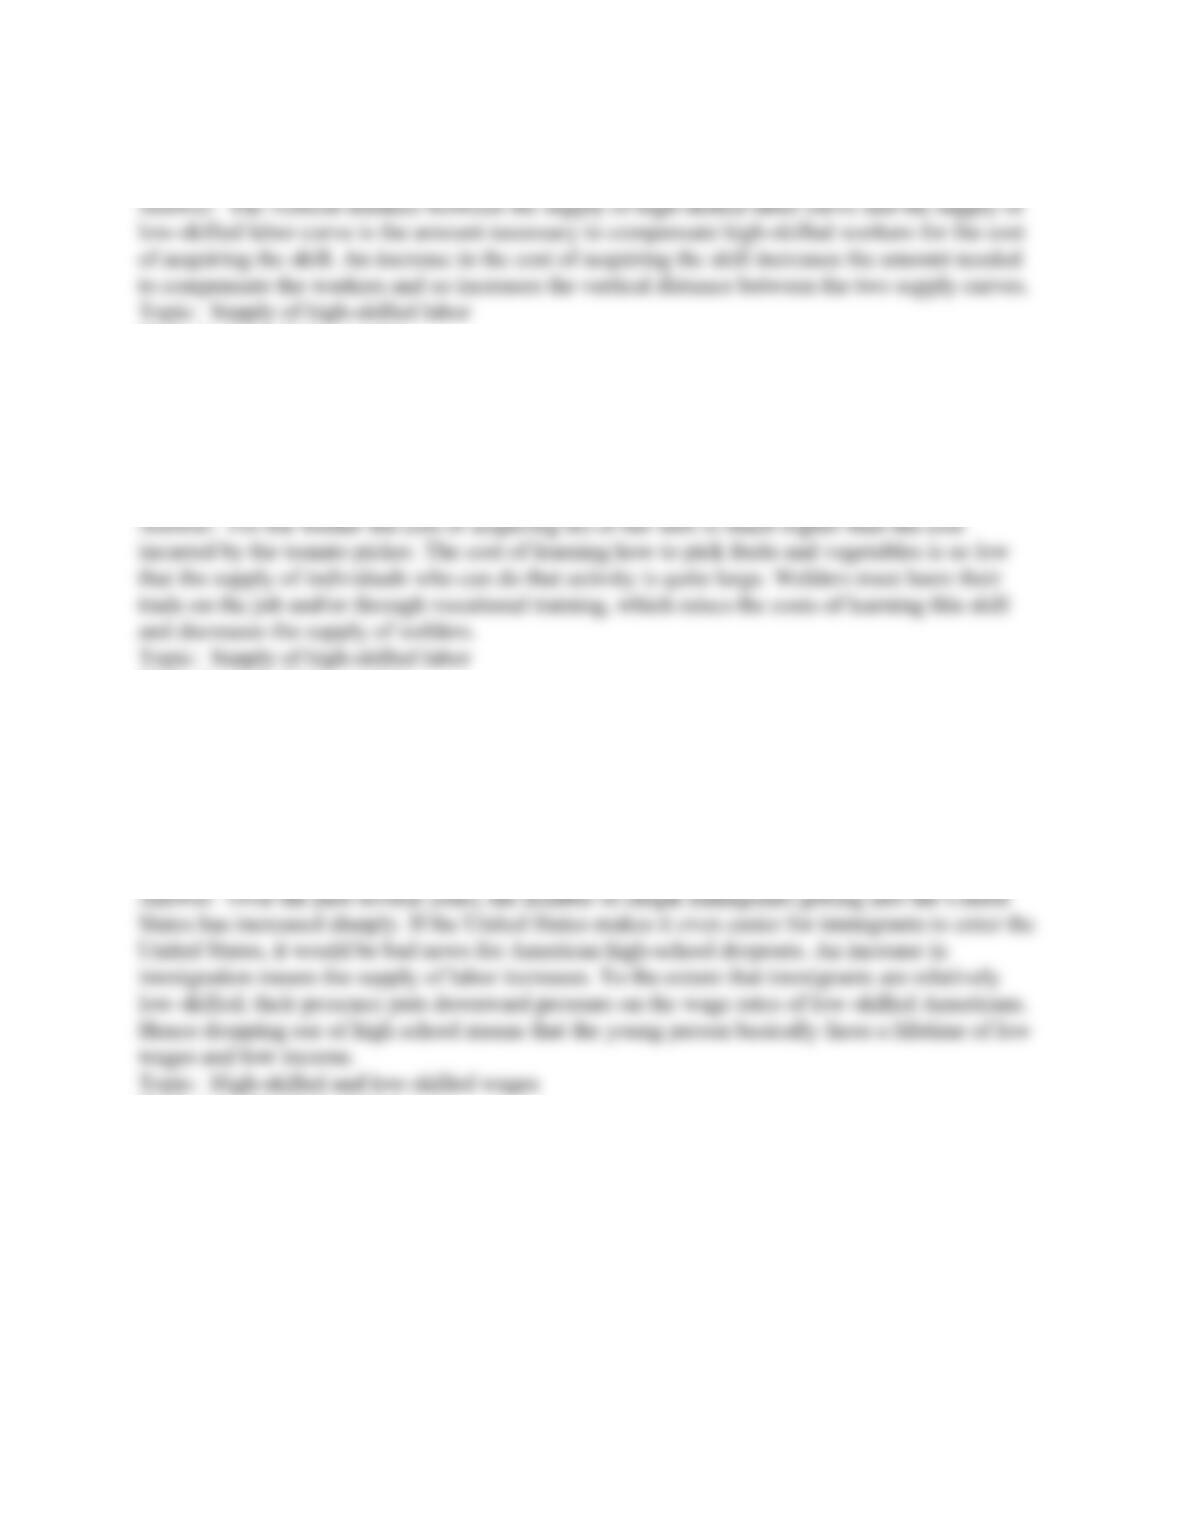
The figure above shows Lorenz curves for a nation.
1) Based on the figure above, if the poorest 20 percent group of households increased the share
of the nation’s income they receive, then
A) there is a movement up along the Lorenz curve for income.
B) there is a movement down along the Lorenz curve for income.
C) the Lorenz curve for income shifts toward the line of equality.
D) the Lorenz curve for income shifts away from the line of equality.
E) Both answers A and C are correct.
Skill: Level 3: Using models
Section: Checkpoint 19.1
Author: MR
AACSB: Analytical reasoning
2) Based on the figure above,
A) the average household’s income exceeds its wealth.
B) the average household’s wealth exceeds its income.
C) income is distributed more equally than wealth.
D) wealth is distributed more equally than income.
E) Both answers A and C are correct.
Skill: Level 3: Using models
Section: Checkpoint 19.1
Author: MR
AACSB: Analytical reasoning
42
Copyright © 2011 Pearson Education, Inc.
3) Based on the figure above,
A) wealth is distributed more equally than income.
B) the Lorenz curve for wealth shows that the poorest 40 percent of households receive about 40
percent of the nation’s wealth.
C) average income exceeds average wealth.
D) average wealth exceeds average income.
E) the Lorenz curve for income shows that the richest 20 percent of households receive about 50
percent of the nation’s income.
Skill: Level 3: Using models
Section: Checkpoint 19.1
Author: MR
AACSB: Analytical reasoning
4) Based on the figure above, which of the following can cause a movement from point C to
point D on the Lorenz curve for income?
A) an increase in income for the bottom 60 percent of households
B) an increase in income for the bottom 80 percent of households
C) a decrease in income for the bottom 60 percent of households
D) a decrease in income for the bottom 80 percent of households
E) None of the above answers is correct.
Skill: Level 3: Using models
Section: Checkpoint 19.1
Author: MR
AACSB: Analytical reasoning
43
Copyright © 2011 Pearson Education, Inc.
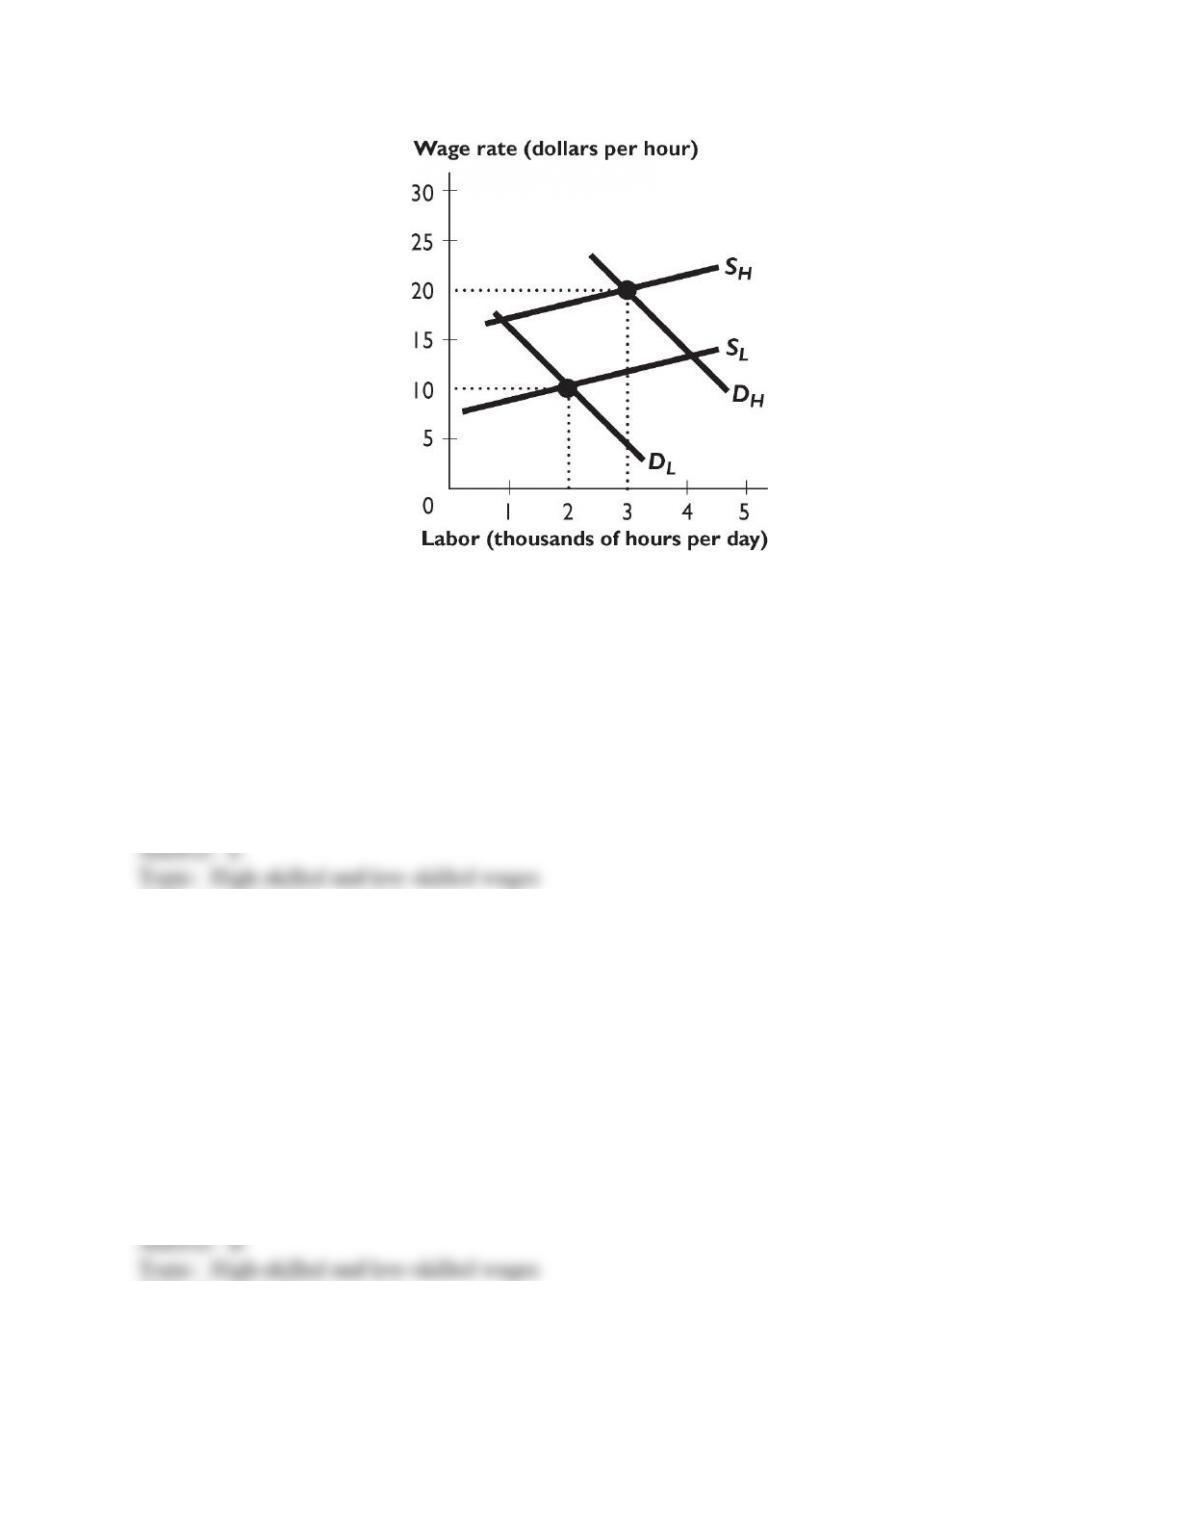
The figure above shows the demand and supply curves for high-skilled (indicated by an “H”
subscript) and low-skilled (indicated by an “L” subscript) workers.
5) In the figure above, the value of the marginal product of skill creates the difference between
the ________ curves and ________.
A) SL and SH; is equal to $10 per hour
B) SL and SH; exceeds $10 per hour
C) DL and DH; is less than $10 per hour
D) DL and DH; is equal to $10 per hour
E) DL and DH; exceeds $10 per hour
Skill: Level 3: Using models
Section: Checkpoint 19.2
Author: MR
AACSB: Analytical reasoning
6) In the figure above, the compensation for the cost of acquiring the skill creates the difference
between the ________ curves and ________.
A) SL and SH; is equal to $10 per hour
B) SL and SH; is less than $10 per hour
C) DL and DH; is less than $10 per hour
D) DL and DH; is equal to $10 per hour
E) SL and SH; exceeds $10 per hour
Skill: Level 3: Using models
Section: Checkpoint 19.2
Author: MR
AACSB: Analytical reasoning
44
Copyright © 2011 Pearson Education, Inc.
7) In the figure above, the equilibrium wage differential between high-skilled workers and low-
skilled workers is
A) zero.
B) $5.00 or less per hour.
C) between $5.01 and $10.00 per hour.
D) between $10.01 and $20.00 per hour.
E) more than $20.01 per hour.
Skill: Level 3: Using models
Section: Checkpoint 19.2
Author: MR
AACSB: Analytical reasoning
8) In the figure above, if the value of the marginal product of skill increased, then the
A) SL curve shifts leftward.
B) SH curve shifts leftward.
C) DH curve shifts rightward.
D) DH curve shifts leftward.
E) DL curve shifts leftward.
Skill: Level 3: Using models
Section: Checkpoint 19.2
Author: MR
AACSB: Analytical reasoning
9) In the figure above, if the cost of acquiring the skill decreased, then the
A) SL curve shifts leftward.
B) SH curve shifts leftward.
C) SH curve shifts rightward.
D) DH curve shifts leftward.
E) DL curve shifts leftward.
Skill: Level 3: Using models
Section: Checkpoint 19.2
Author: MR
AACSB: Analytical reasoning
45
Copyright © 2011 Pearson Education, Inc.
19.5 Integrative Questions
1) The wage differential between high-skilled and low-skilled workers is the result of
A) a difference in the value of marginal product.
B) the cost of acquiring skills.
C) a negative income tax.
D) Both answers A and B are correct.
E) Both answers B and C are correct.
Skill: Level 3: Using models
Section: Integrative
Author: CD
AACSB: Reflective thinking
2) Discrimination
A) can be corrected by imposing a negative income tax.
B) cannot explain economic inequality.
C) immediately results in an unequal ownership of capital.
D) is more likely to occur in a business where customers come into contact with minority
employees.
E) means that the costs paid by people who discriminate are lower than otherwise.
Skill: Level 4: Applying models
Section: Integrative
Author: CD
AACSB: Reflective thinking
3) Which of the following statements correctly describes how taxes redistribute income across
different households in an economy?
A) The richest 40 percent of households increase their share of income.
B) The poorest 60 percent of households increase their share of income.
C) Taxes have no effect on the distribution of income.
D) The poorest 20 percent of households receive 20 percent of their income from the
government.
E) The richest 20 percent of households increase their share of income and the poorest 20 percent
decrease their share of income.
Skill: Level 2: Using definitions
Section: Integrative
Author: CD
AACSB: Reflective thinking
46
Copyright © 2011 Pearson Education, Inc.
4) Suppose a state charges an in-state student $2000 in tuition for a college education and
charges an out-of -state student $10,000 in tuition. This differential
A) is a result of the state subsidizing education for its residents.
B) explains the difference between the demand curve for high-skilled and low-skilled labor.
C) explains the difference between the supply curve for high-skilled and low-skilled labor.
D) can be corrected via a negative income tax.
E) is an example of the positive theories of income redistribution.
Skill: Level 4: Applying models
Section: Integrative
Author: CD
AACSB: Reflective thinking
19.6 Essay: Economic Inequality in the United States
1) What is the difference between wealth and income?
Skill: Level 1: Definition
Section: Checkpoint 19.1
Author: SB
AACSB: Reflective thinking
2) In the United States, do the poorest 20 percent of the households receive more or less than 5
percent of market income?
Skill: Level 2: Using definitions
Section: Checkpoint 19.1
Author: AA
AACSB: Reflective thinking
3) Which is distributed more equally: income or wealth?
Skill: Level 2: Using definitions
Section: Checkpoint 19.1
Author: AA
AACSB: Communication
47
Copyright © 2011 Pearson Education, Inc.
4) What is a Lorenz curve?
Skill: Level 2: Using definitions
Section: Checkpoint 19.1
Author: JC
AACSB: Reflective thinking
5) “If the distribution of income was equal, the Lorenz curve would be a straight, 45° line.” Is the
previous statement correct or incorrect?
Skill: Level 2: Using definitions
Section: Checkpoint 19.1
Author: WM
AACSB: Reflective thinking
6) What do the Lorenz curves for wealth and income in the United States look like? Which is
closer to the line of equality?
Skill: Level 2: Using definitions
Section: Checkpoint 19.1
Author: AA
AACSB: Communication
7) “Over the past two decades, the distribution of income in the United States has become more
equal.” Is the previous statement correct or incorrect? Briefly explain your answer.
Skill: Level 2: Using definitions
Section: Checkpoint 19.1
Author: TS
AACSB: Communication
48
Copyright © 2011 Pearson Education, Inc.
8) Of age, marital status, family size, education, and race, which is the single biggest factor
affecting the household income distribution?
Skill: Level 2: Using definitions
Section: Checkpoint 19.1
Author: TS
AACSB: Reflective thinking
9) Describe the characteristics of the typical lowest income household in the United States and
the characteristics of the typical richest household in the United States.
Skill: Level 2: Using definitions
Section: Checkpoint 19.1
Author: CD
AACSB: Communication
10) Is the poverty rate the lowest among Hispanic households, black households, or white
households?
Skill: Level 2: Using definitions
Section: Checkpoint 19.1
Author: AA
AACSB: Reflective thinking
49
Copyright © 2011 Pearson Education, Inc.
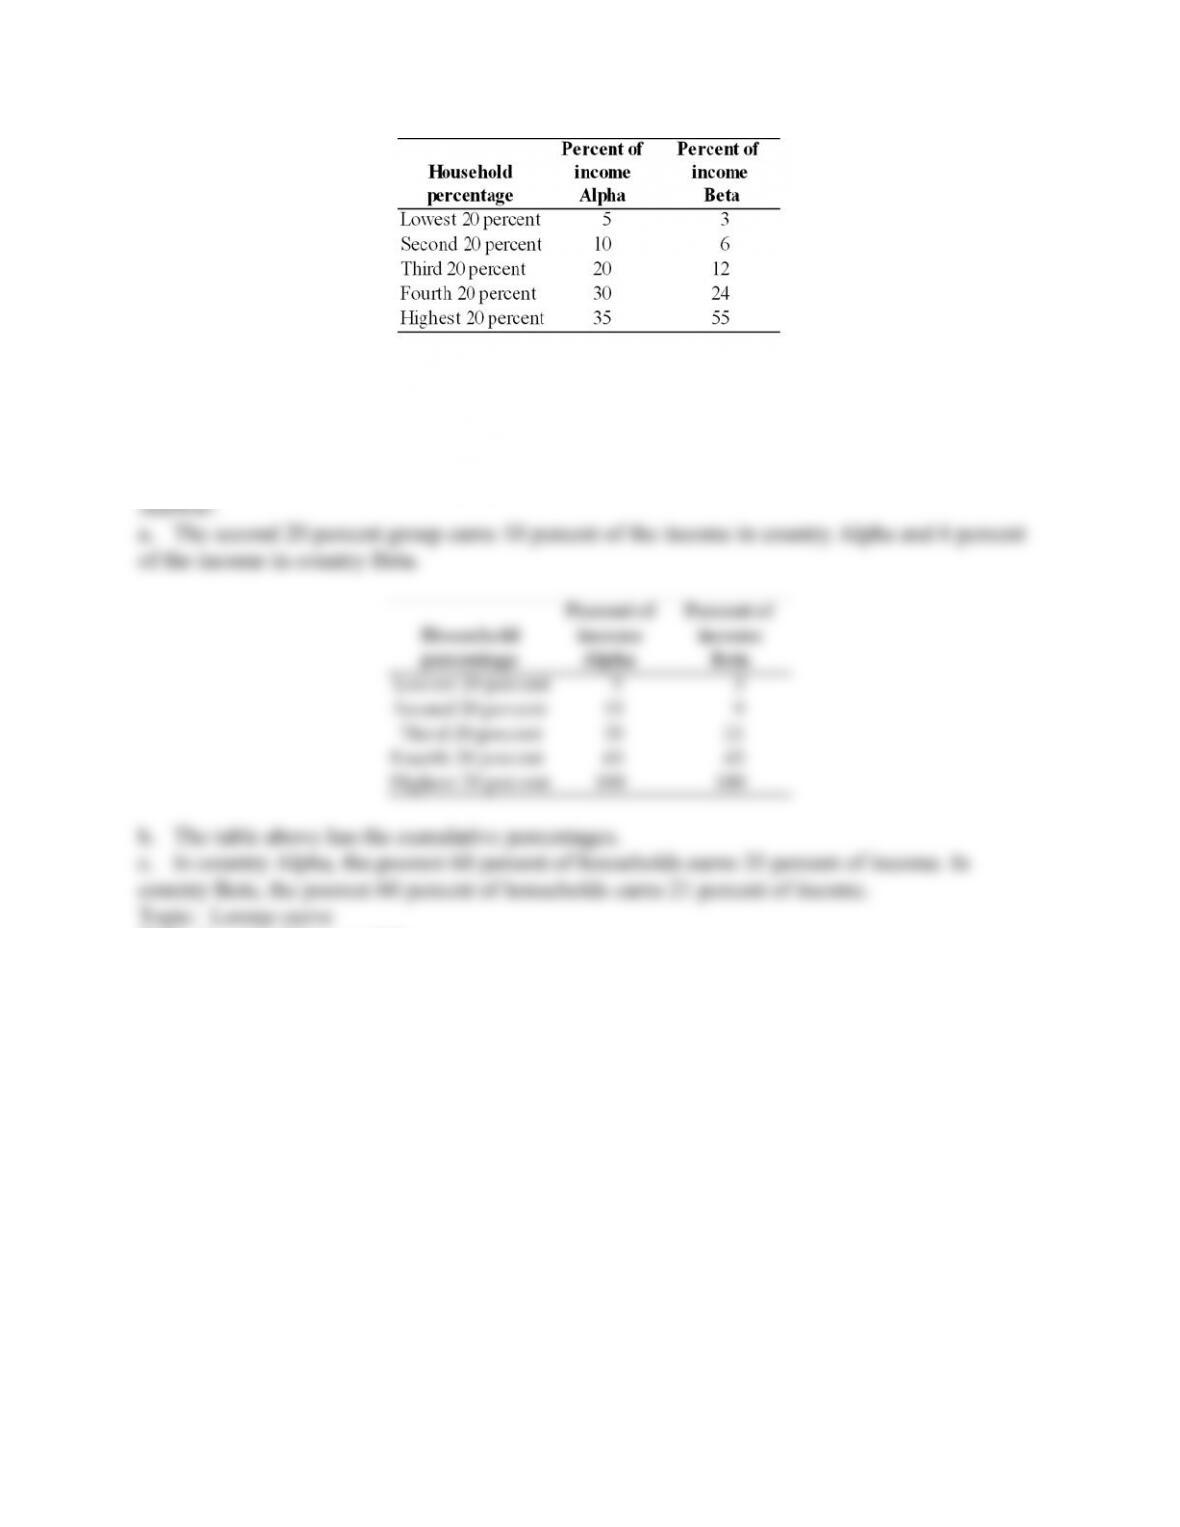
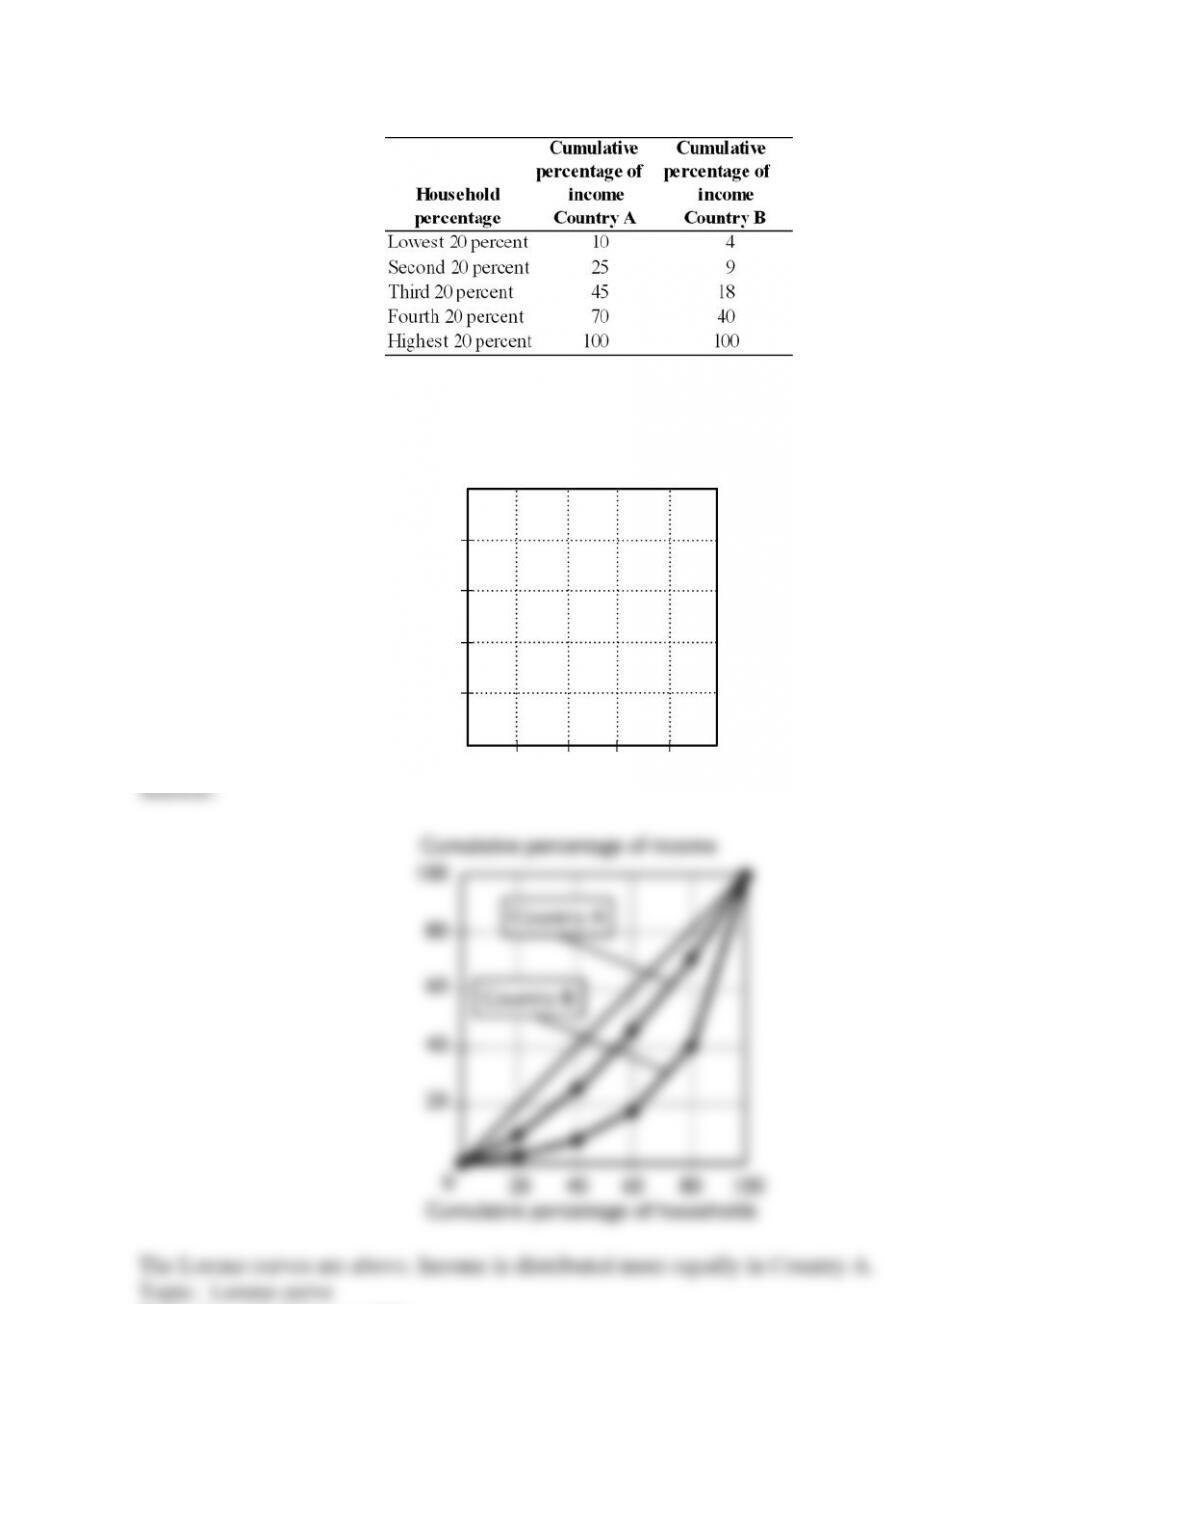
11) The above table shows the distribution of income in two imaginary countries, Alpha and
Beta.
a. What does the table tell you about the second 20 percent group in each country?
b. Calculate the cumulative percentage for both countries.
c. Interpret the cumulative percentage for the third 20 percent group in both countries.
Skill: Level 3: Using models
Section: Checkpoint 19.1
Author: SB
AACSB: Analytical reasoning
50
Copyright © 2011 Pearson Education, Inc.
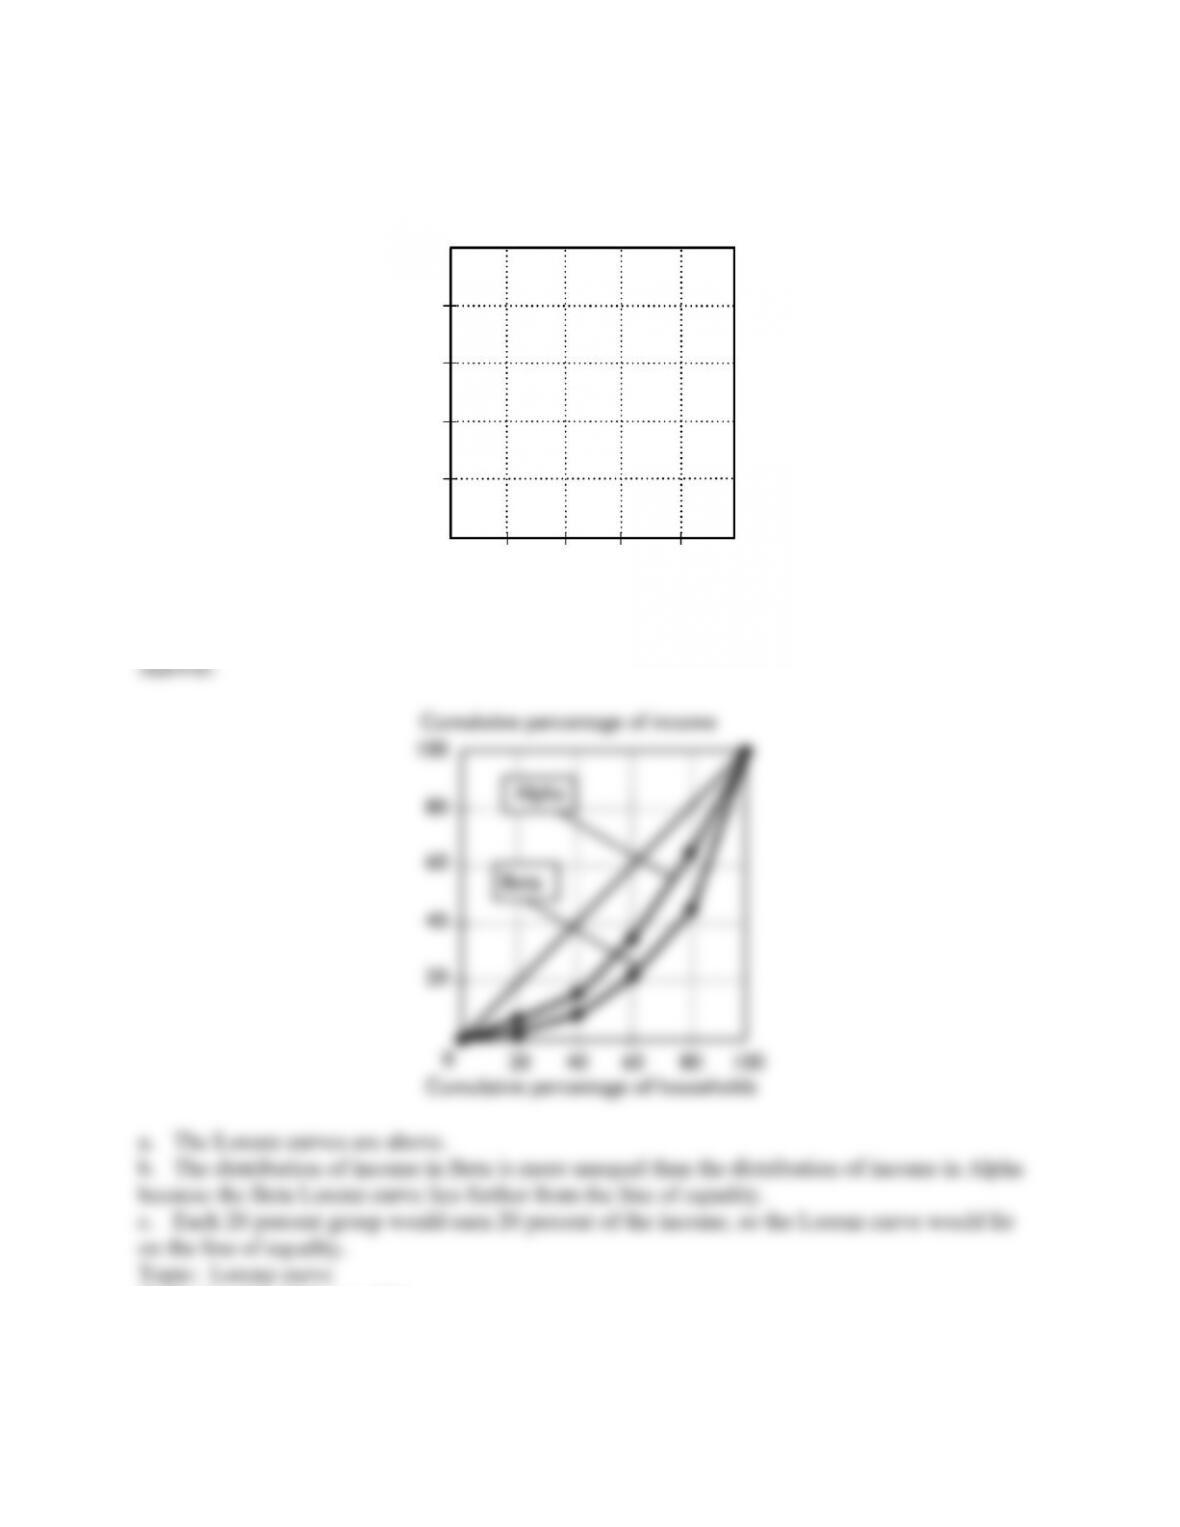
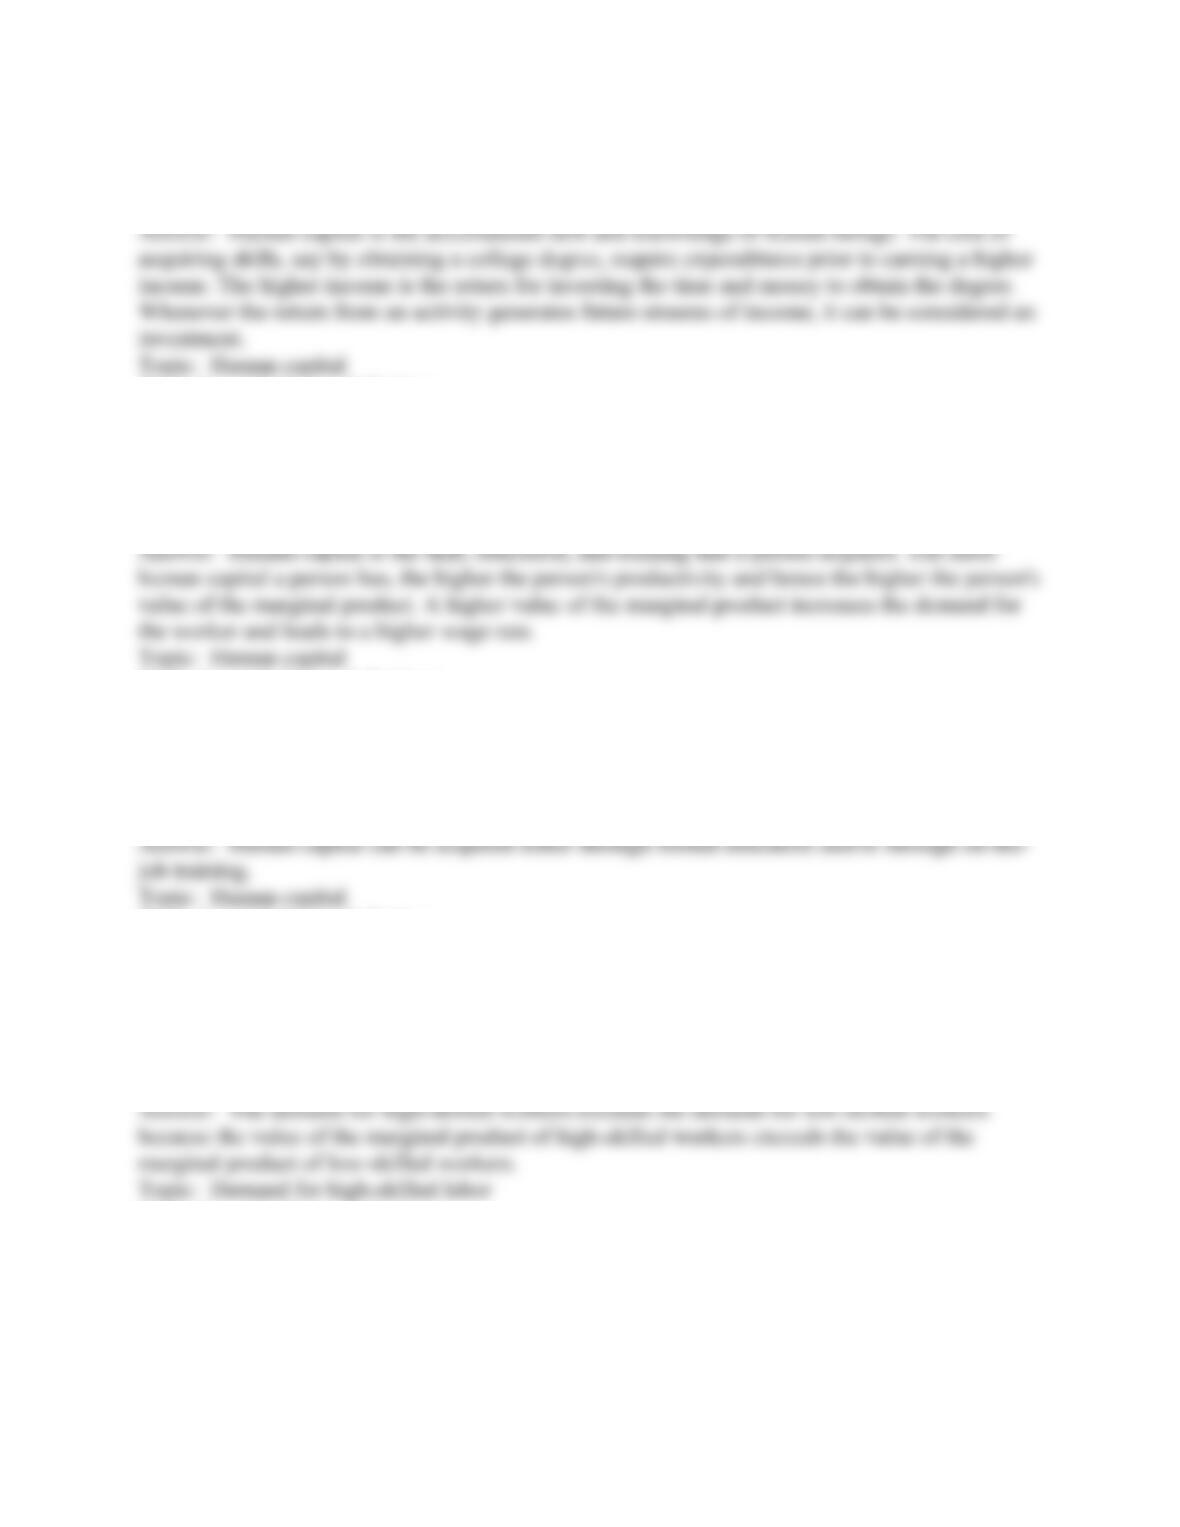
12) The above table shows the distribution of income in two imaginary countries, Alpha and
Beta.
a. In the figure below, draw the Lorenz curves for Alpha and Beta.
b. Compare the distribution of income in Alpha with that in Beta. Which distribution is more
unequal?
c. What would be the distribution of income in a country with perfect income equality?
Skill: Level 3: Using models
Section: Checkpoint 19.1
Author: SB
AACSB: Analytical reasoning
51
Copyright © 2011 Pearson Education, Inc.
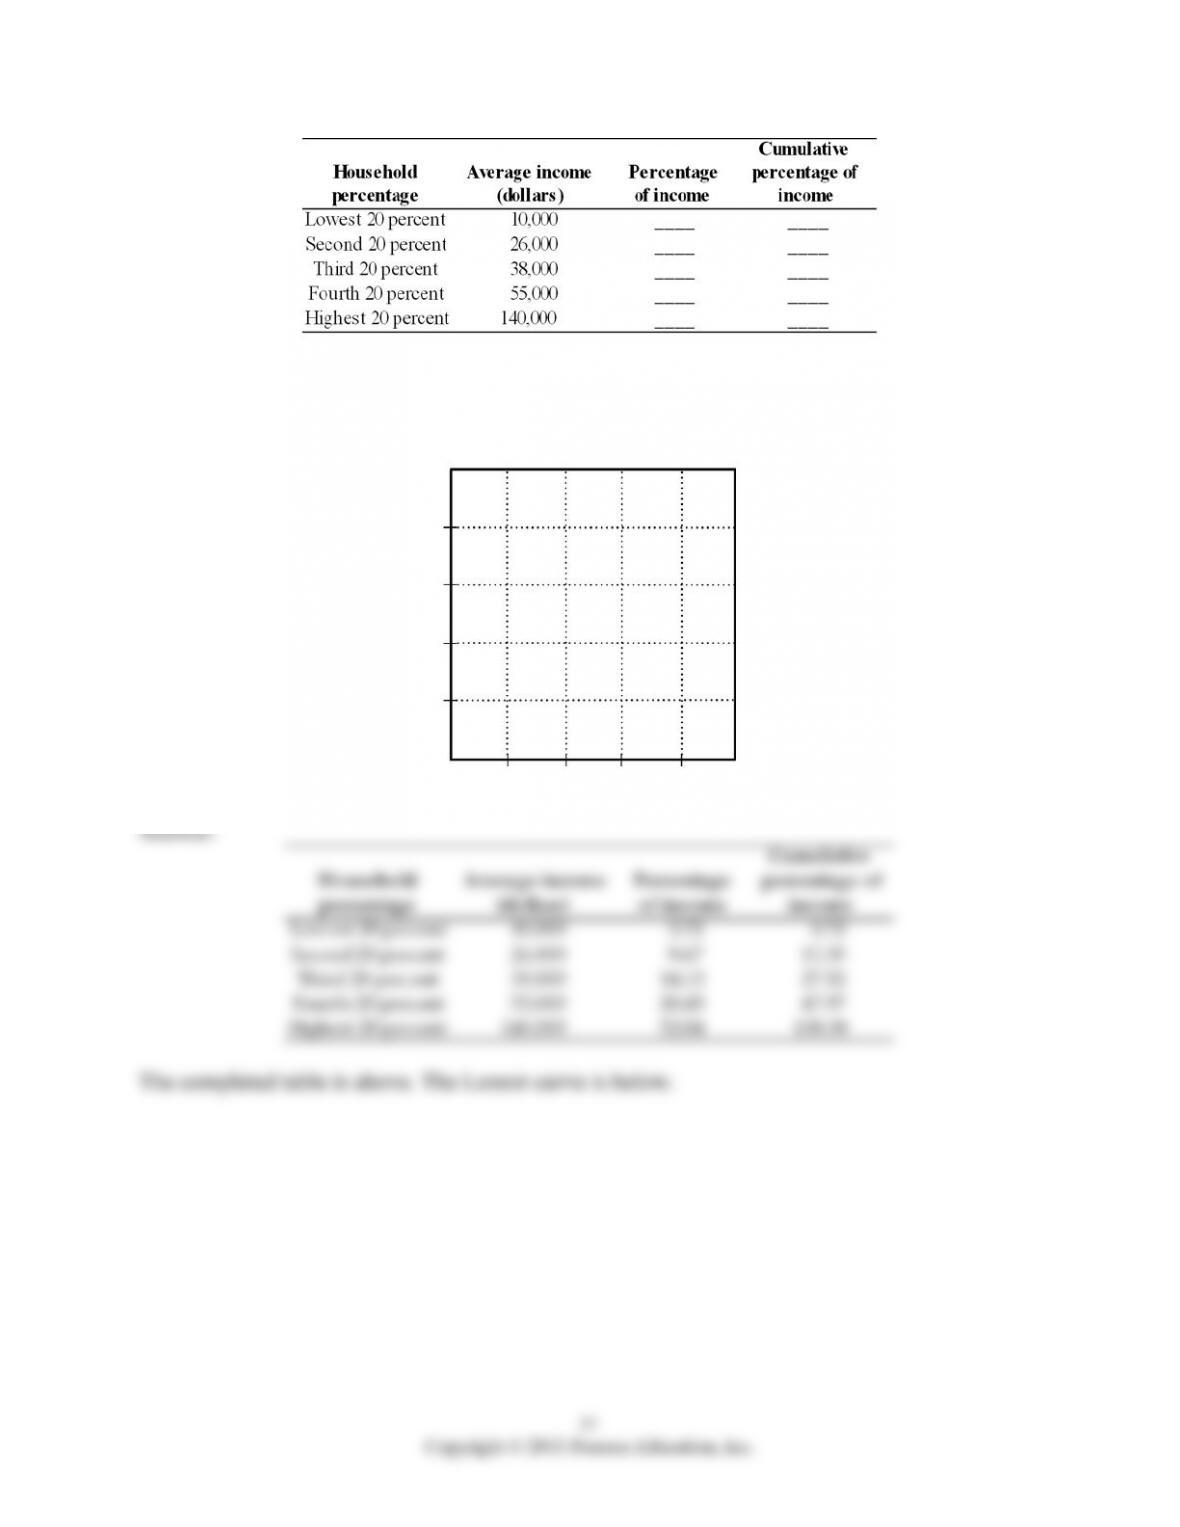
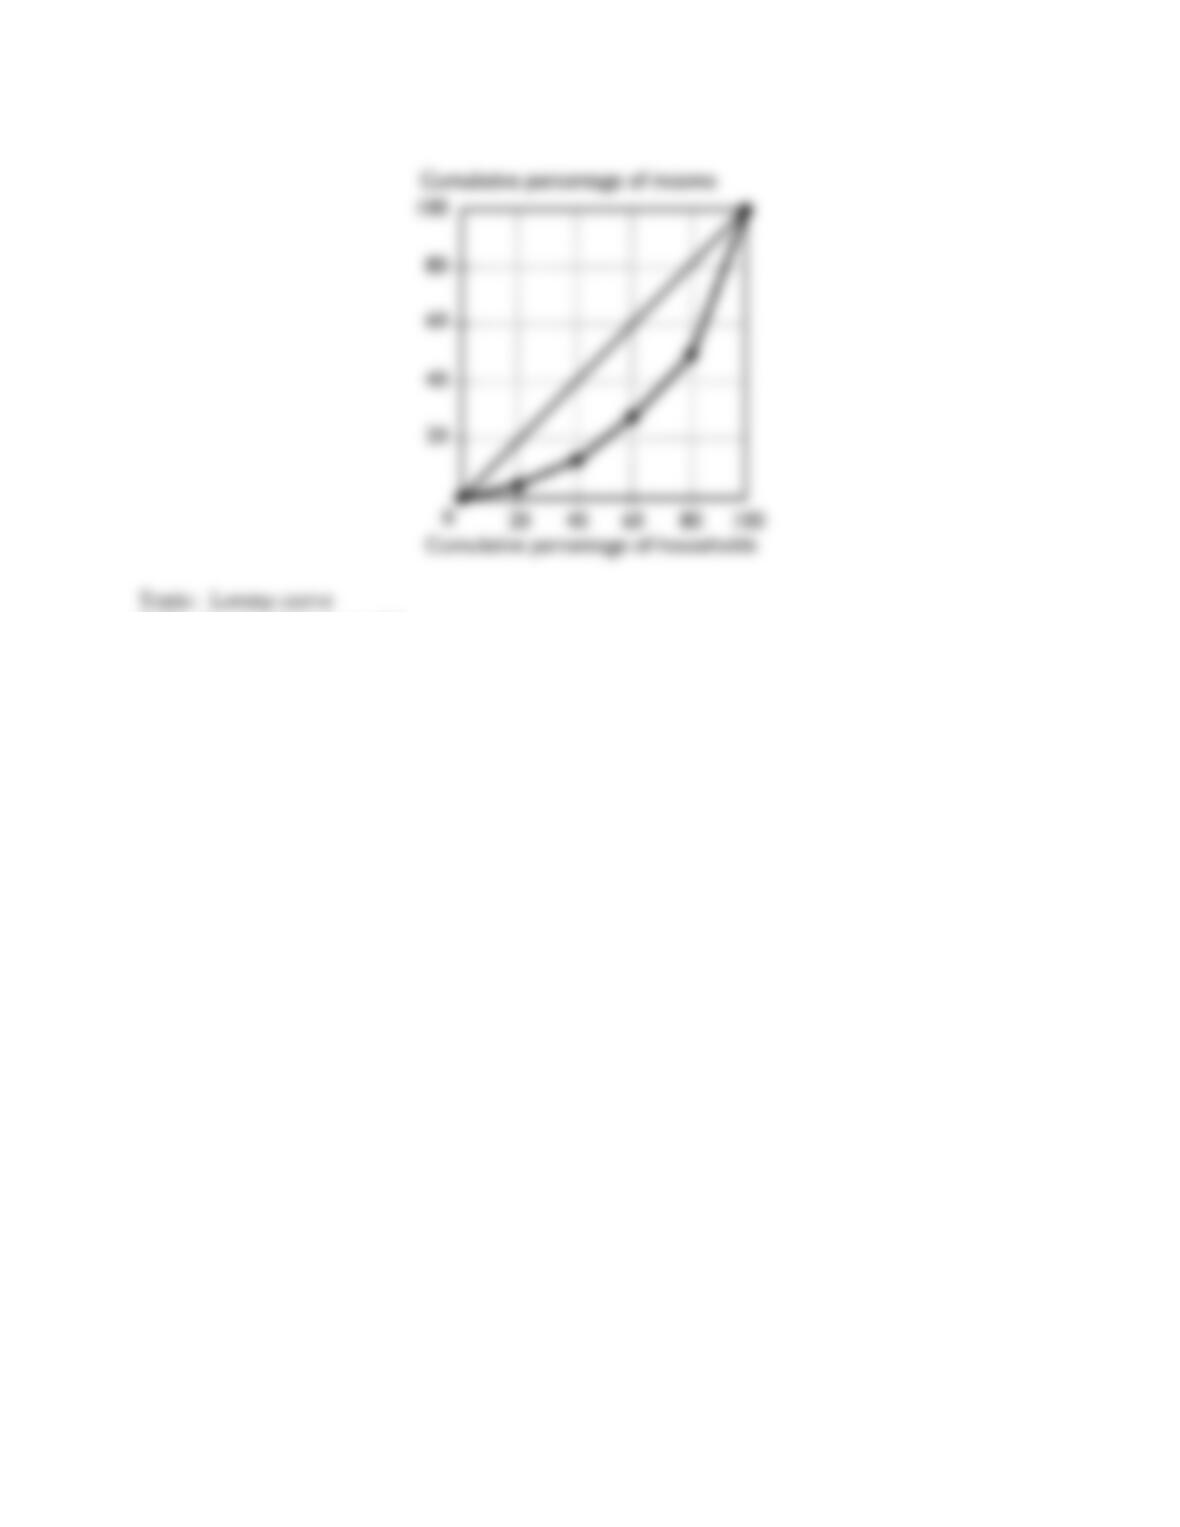
13) The table above gives the average income received by each 20 percent group of households.
Complete the table by finding the percentage of income earned by each group and the cumulative
percentage of income. Label the figure below and then plot the Lorenz curve.
52
Copyright © 2011 Pearson Education, Inc.
Topic: Lorenz curve
Skill: Level 3: Using models
Section: Checkpoint 19.1
Author: SA
AACSB: Analytical reasoning
53
Copyright © 2011 Pearson Education, Inc.
14) The table above gives cumulative percent of income received by each 20 percent group of
households. Label the figure below and then plot the Lorenz curves. In which nation is income
more equally distributed?
Skill: Level 3: Using models
Section: Checkpoint 19.1
Author: SA
AACSB: Analytical reasoning
54
Copyright © 2011 Pearson Education, Inc.
19.7 Essay: How Inequality and Poverty Arise
1) What is “human capital” and why is it considered an investment?
Skill: Level 2: Using definitions
Section: Checkpoint 19.2
Author: PH
AACSB: Communication
2) What is “human capital”? How is it important in the determination of a worker’s wage rate?
Skill: Level 2: Using definitions
Section: Checkpoint 19.2
Author: PH
AACSB: Communication
3) How is human capital acquired?
Skill: Level 2: Using definitions
Section: Checkpoint 19.2
Author: TS
AACSB: Reflective thinking
4) How does the demand for high-skilled workers compare to the demand for low-skilled
workers? Why does this difference exist?
Skill: Level 2: Using definitions
Section: Checkpoint 19.2
Author: WM
AACSB: Reflective thinking
55
Copyright © 2011 Pearson Education, Inc.
5) How does an increase in the cost to acquire a skill affect the vertical distance between the
supply curves of high-skilled and low-skilled workers?
Skill: Level 3: Using models
Section: Checkpoint 19.2
Author: PH
AACSB: Communication
6) At any wage rate, the quantity of welders willing to work is less than the quantity of tomato
pickers. Why?
Skill: Level 3: Using models
Section: Checkpoint 19.2
Author: JC
AACSB: Communication
7) Fully explain why it is a good idea for young people who are considering dropping out of high
school to stay in school if the U.S. government pursues more liberal immigration policies over
the next 20 years.
Skill: Level 5: Critical thinking
Section: Checkpoint 19.2
Author: JC
AACSB: Communication
56
Copyright © 2011 Pearson Education, Inc.
8) Describe the effect education and training have on outcomes in the labor market.
Skill: Level 3: Using models
Section: Checkpoint 19.2
Author: SB
AACSB: Communication
19.8 Essay: Income Redistribution
1) What are the three ways that the government redistributes income in the United States?
Briefly discuss each.
Skill: Level 2: Using definitions
Section: Checkpoint 19.3
Author: TS
AACSB: Communication
57
Copyright © 2011 Pearson Education, Inc.
2) What are three programs that redistribute income in the United States by making direct
payments to people? Who benefits from each program?
Skill: Level 2: Using definitions
Section: Checkpoint 19.3
Author: CD
AACSB: Communication
3) A government redistribution of income program is proposed with the aim of making the
income distribution the same as the 45° line in a Lorenz curve diagram. What implications does
the idea of the “big tradeoff” have for the program?
Skill: Level 5: Critical thinking
Section: Checkpoint 19.3
Author: JC
AACSB: Communication
58
Copyright © 2011 Pearson Education, Inc.
4) Describe how a negative income tax works.
Skill: Level 3: Using models
Section: Checkpoint 19.3
Author: CD
AACSB: Communication
59
Copyright © 2011 Pearson Education, Inc.
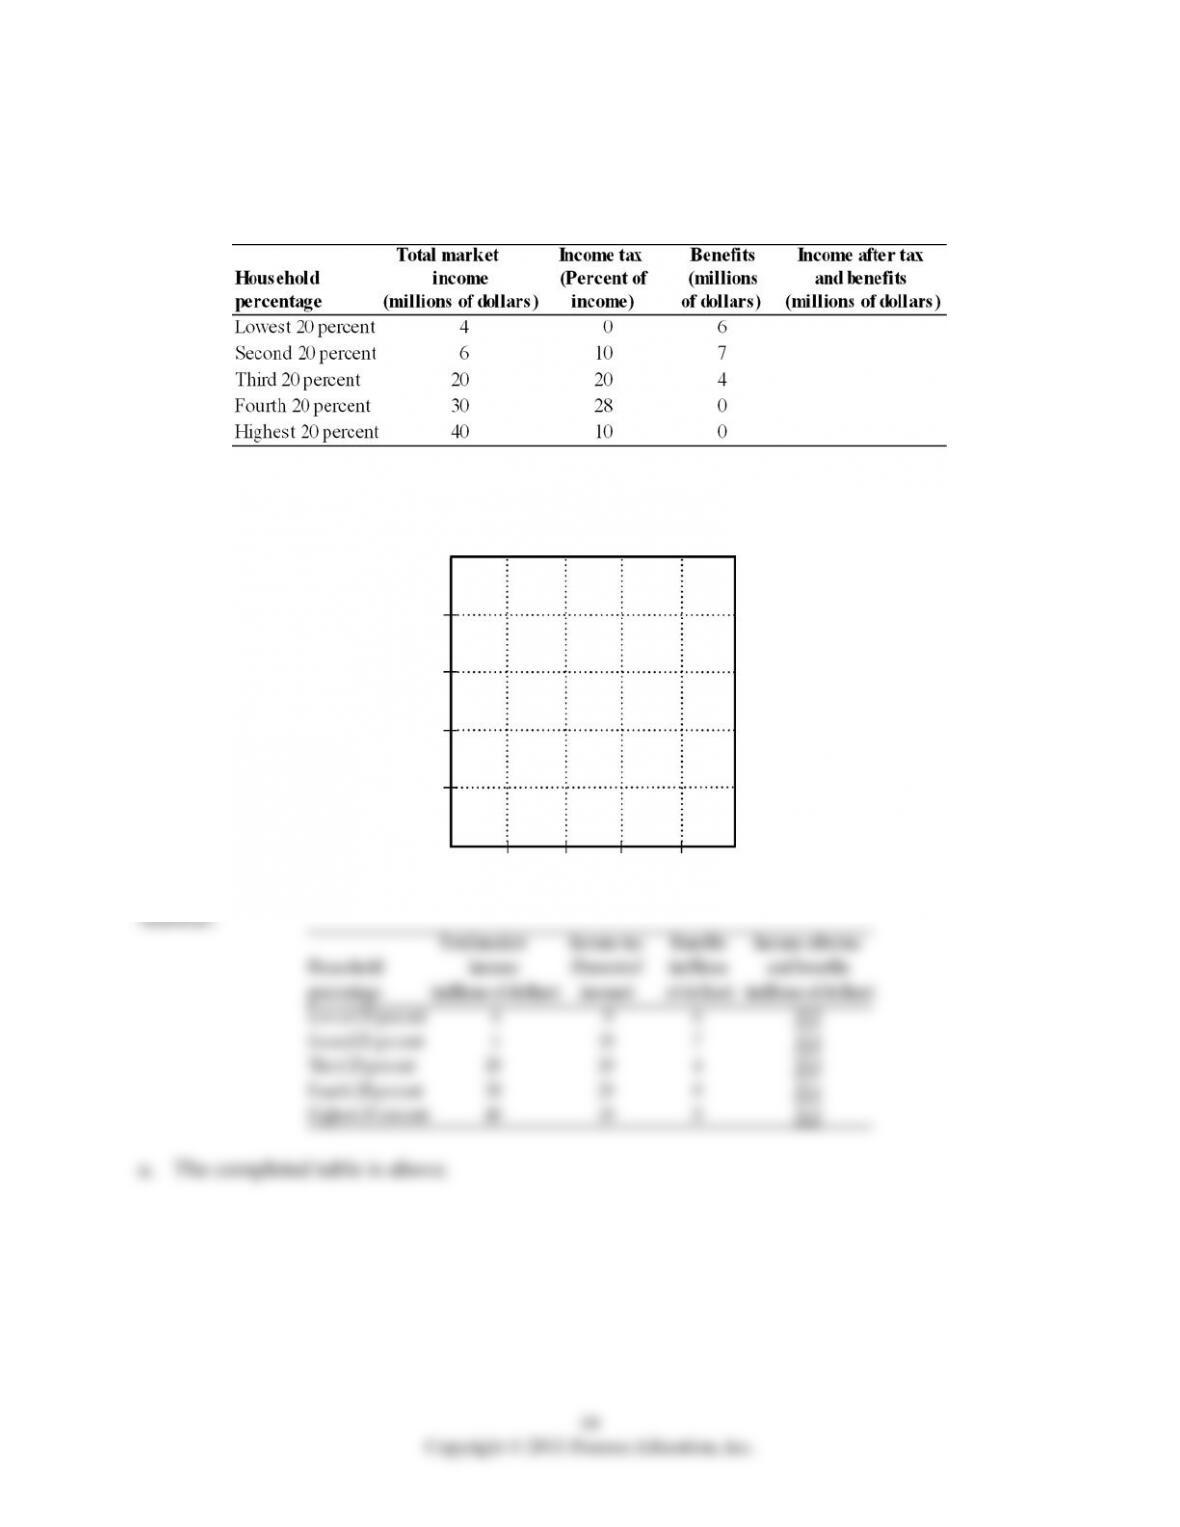
5) The table below shows the distribution of market income in an economy. The government
redistributes income by collecting income taxes and paying benefits shown in the table.
a. Calculate the income shares of each 20 percent of households after tax and redistribution.
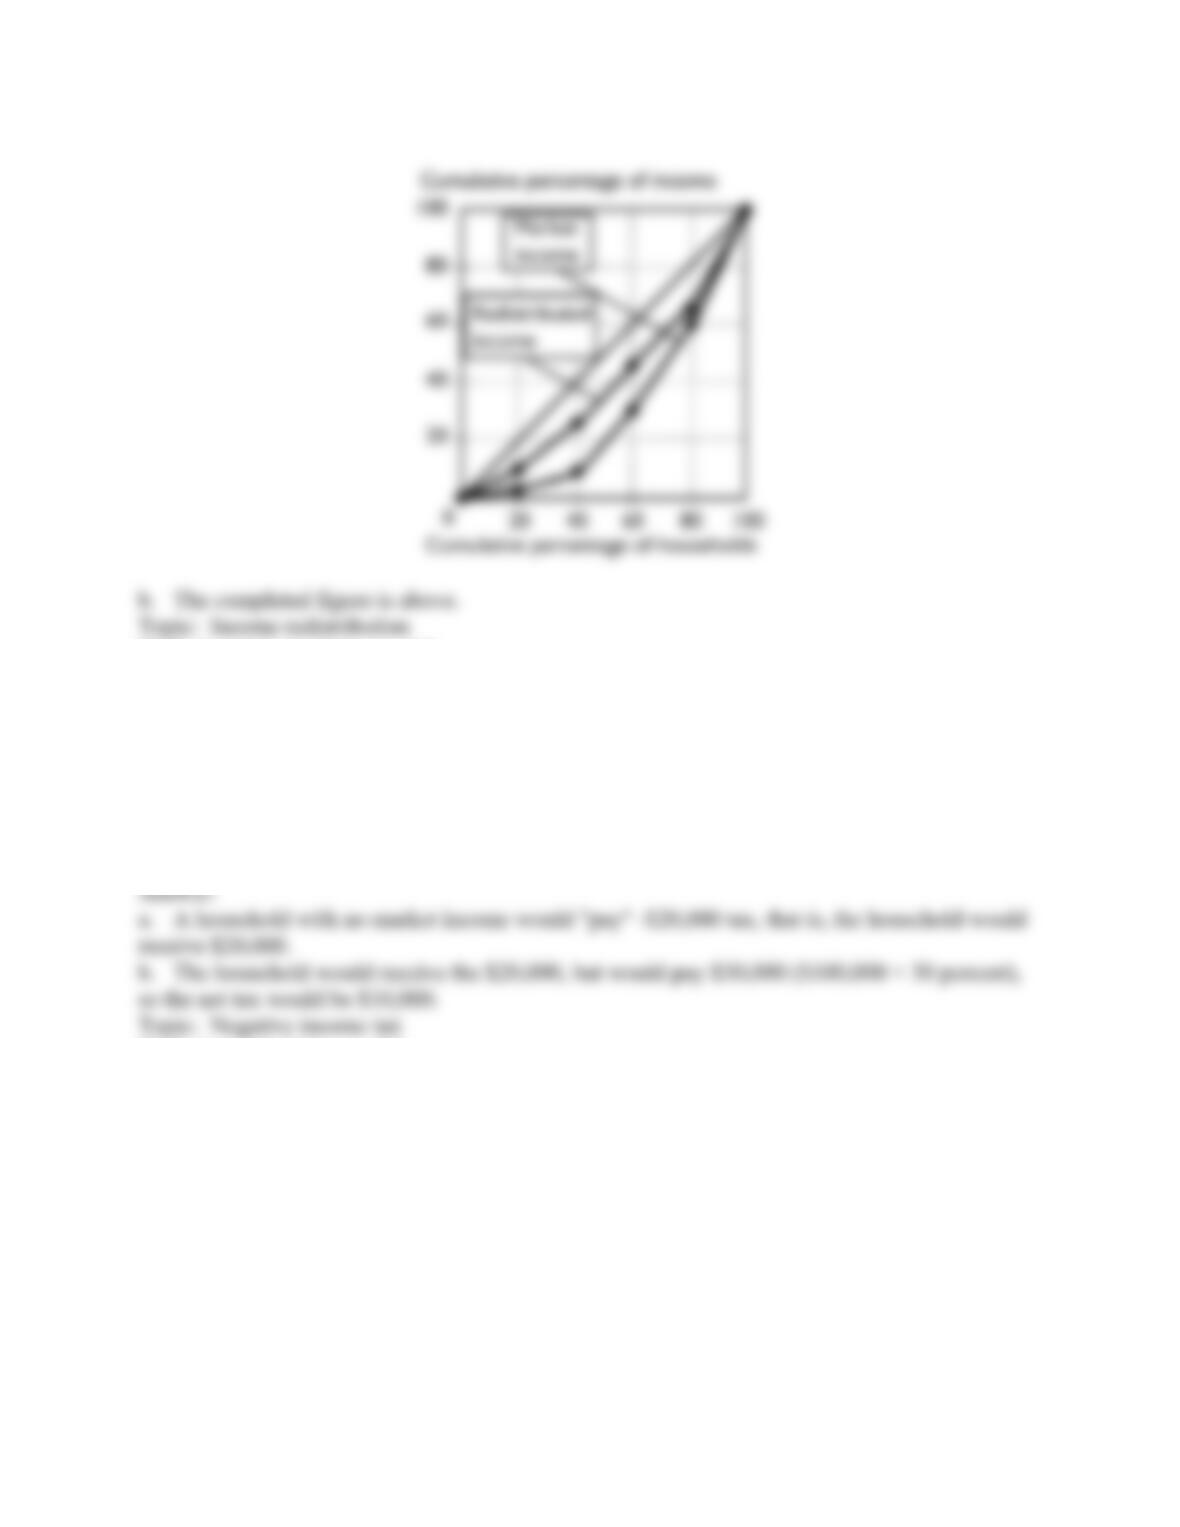
b. In the figure below, draw the Lorenz curves for this economy, both before and after taxes and
benefits.
60
Copyright © 2011 Pearson Education, Inc.
b. The completed figure is above.
Topic: Income redistribution
Skill: Level 4: Applying models
Section: Checkpoint 19.3
Author: SB
AACSB: Analytical reasoning
6) Suppose the government implements a negative income tax with a minimum guaranteed
income of $20,000 and a tax rate of 30 percent on market income.
a. What amount of tax would be paid by a household with no market income?
b. What amount of tax would be paid by a household earning $100,000 of market income?
Skill: Level 3: Using models
Section: Checkpoint 19.3
Author: SB
AACSB: Analytical reasoning
61
Copyright © 2011 Pearson Education, Inc.
7) Assume a negative income tax is set up with a 20 percent tax rate on market income and a
guaranteed minimum income of $9,000.
a. What is the amount of taxes a household with $23,000 of market income pays or the amount
of taxes this household receives?
b. What is the amount of taxes a household with $65,000 of market income pays or the amount
of taxes this household receives?
Skill: Level 3: Using models
Section: Checkpoint 19.3
Author: TS
AACSB: Analytical reasoning