108) In the above, in which figure(s) is the slope the same at every point?
A) Figure A only
B) Figures A and C
C) Figure B only
D) Figures A, C, and D
E) Figures C and D
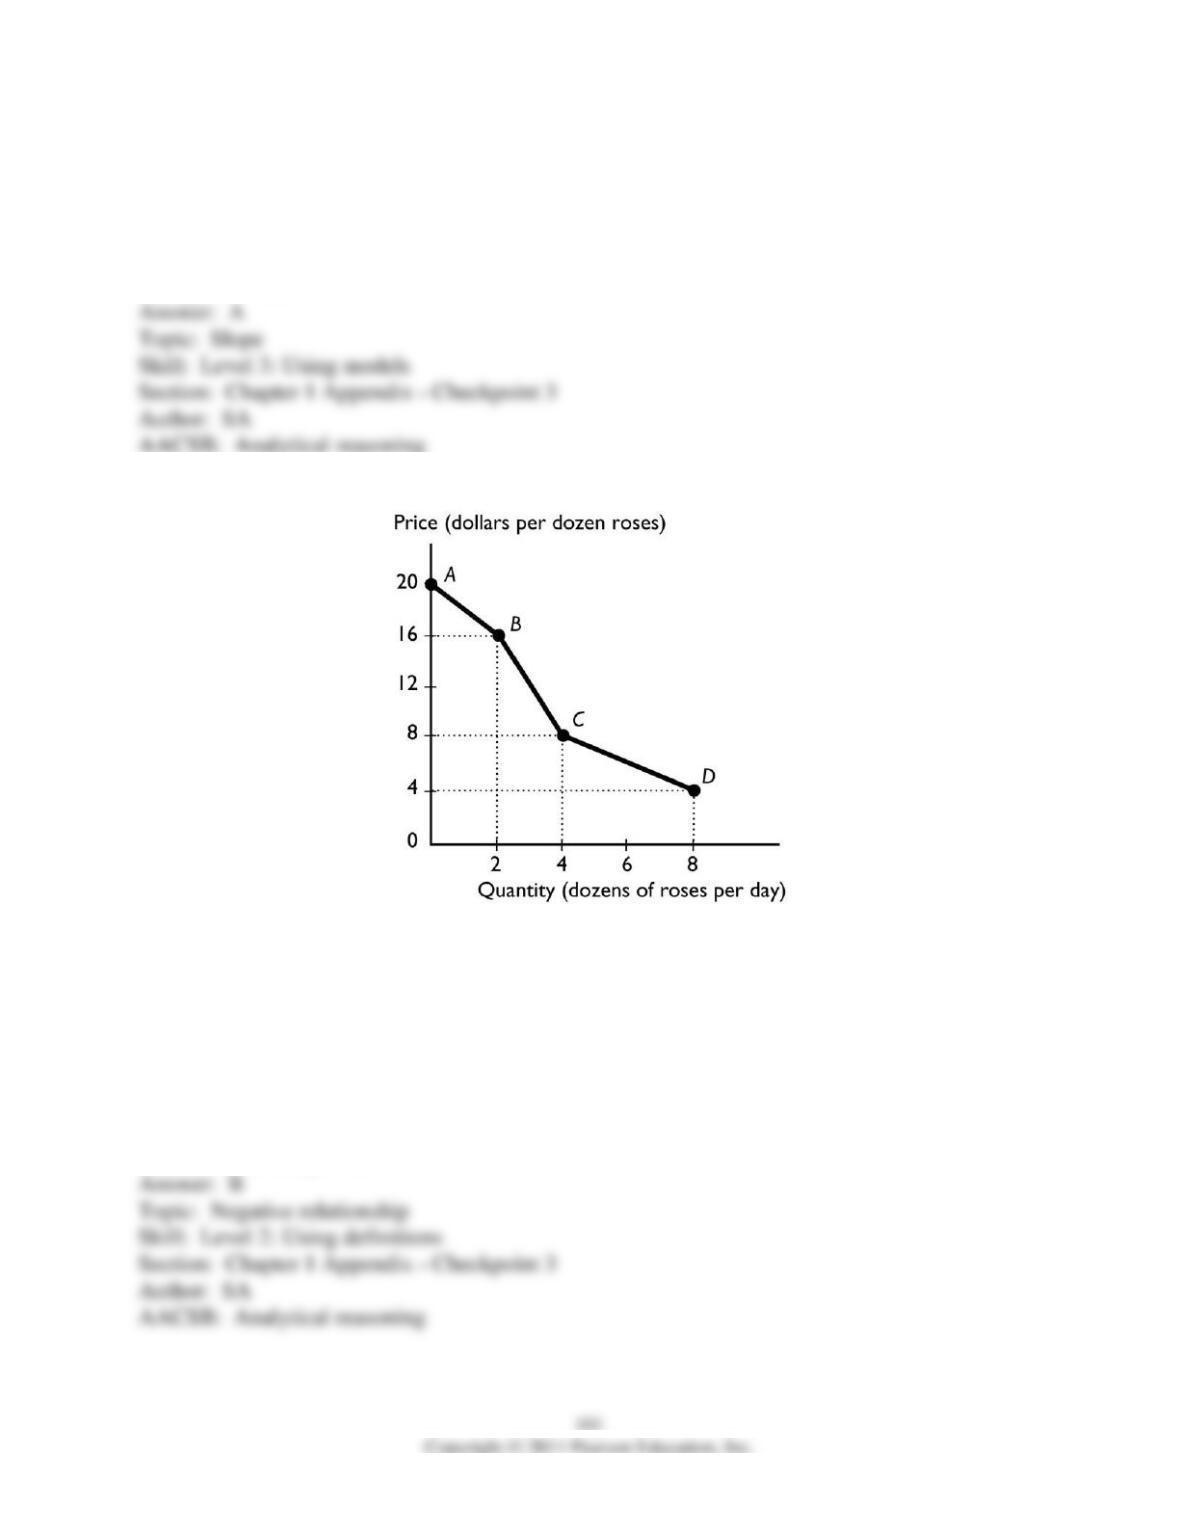
109) The figure above shows the relationship between the price of a dozen roses and the quantity
of roses a florist can sell. The relationship between the price and the quantity the florist can sell
is
A) positive.
B) negative.
C) nonexistent.
D) linear.
E) cross-sectionally trended.
110) The figure above shows the relationship between the price of a dozen roses and the quantity
of roses a florist can sell. The slope between points A and B is
A) 20.
B) 16.
C) 2.
D) 4
E) nonexistent because at point A, 0 roses are sold.
111) The figure above shows the relationship between the price of a dozen roses and the quantity
of roses a florist can sell. The slope between points B and C equals
A) 16.
B) 8.
C) 4.
D) 2.
E) 14.
112) The figure above shows the relationship between the price of a dozen roses and the quantity
of roses a florist can sell. The slope between points C and D equals
A) 8.
B) 4.
C) 2.
D) 1.
E) 12
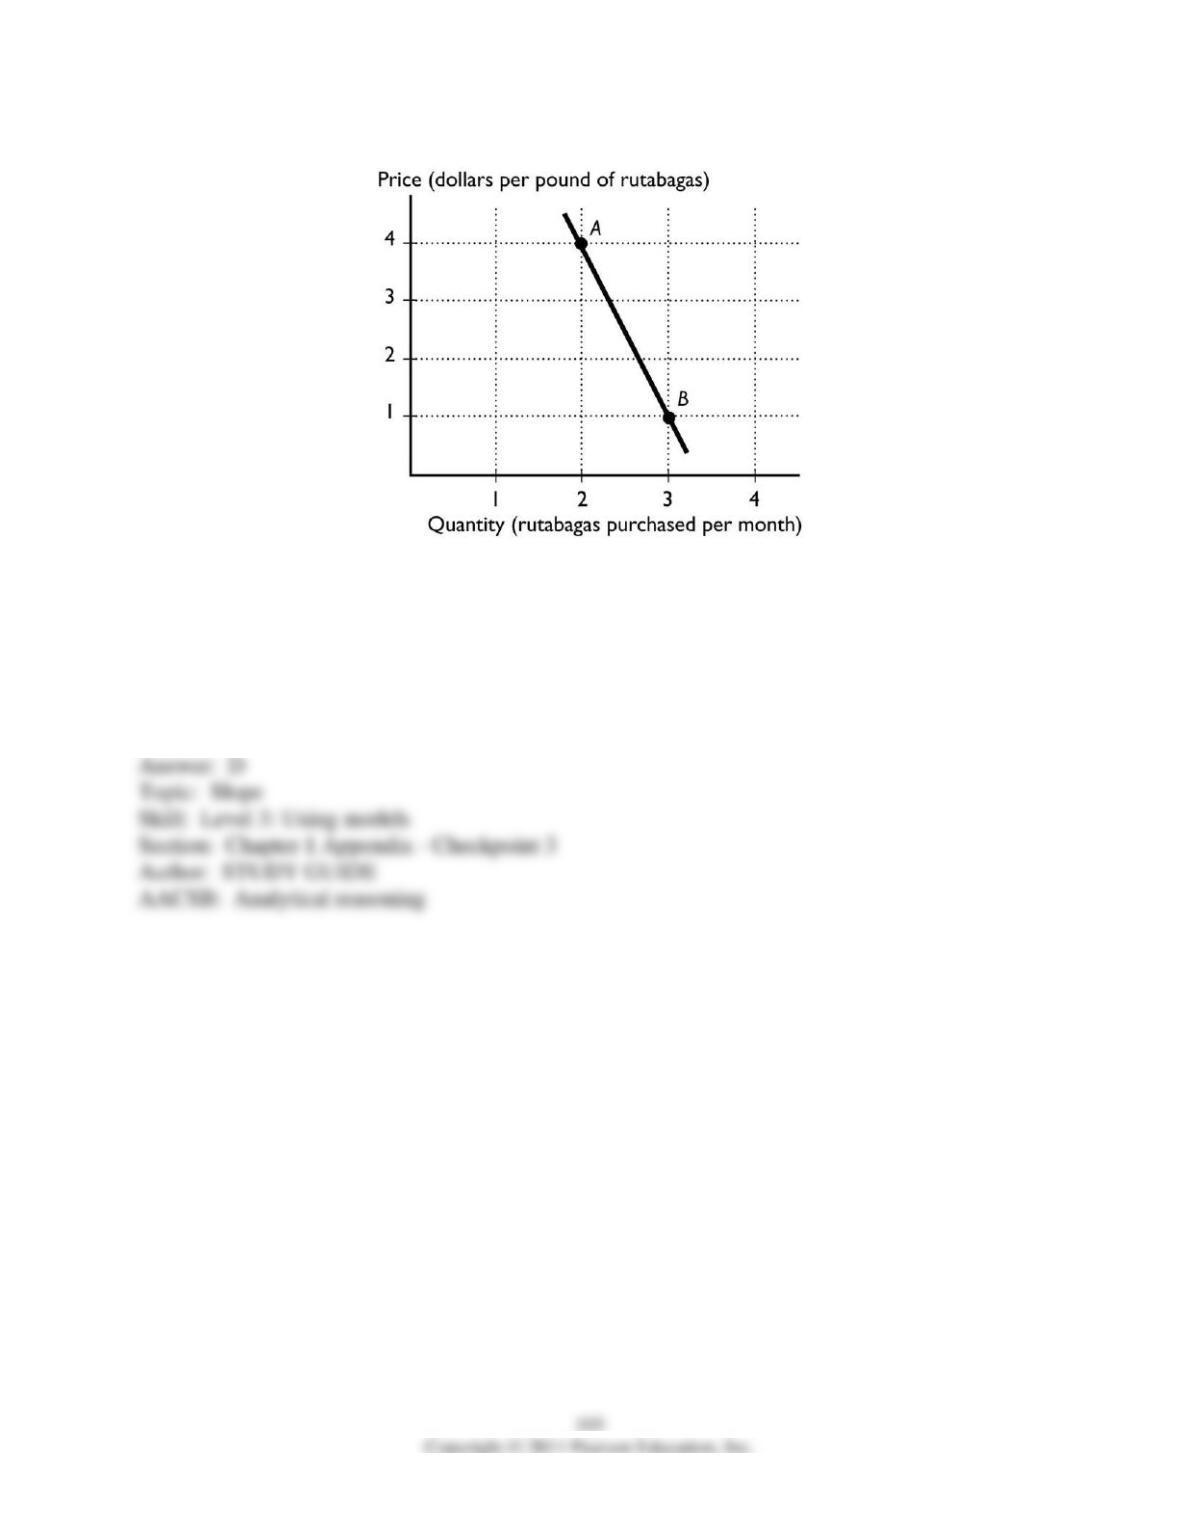
113) In the figure above, between points A and B, what is the slope of the line?
A) 4
B) 1
C) 3
D) -3
E) 0
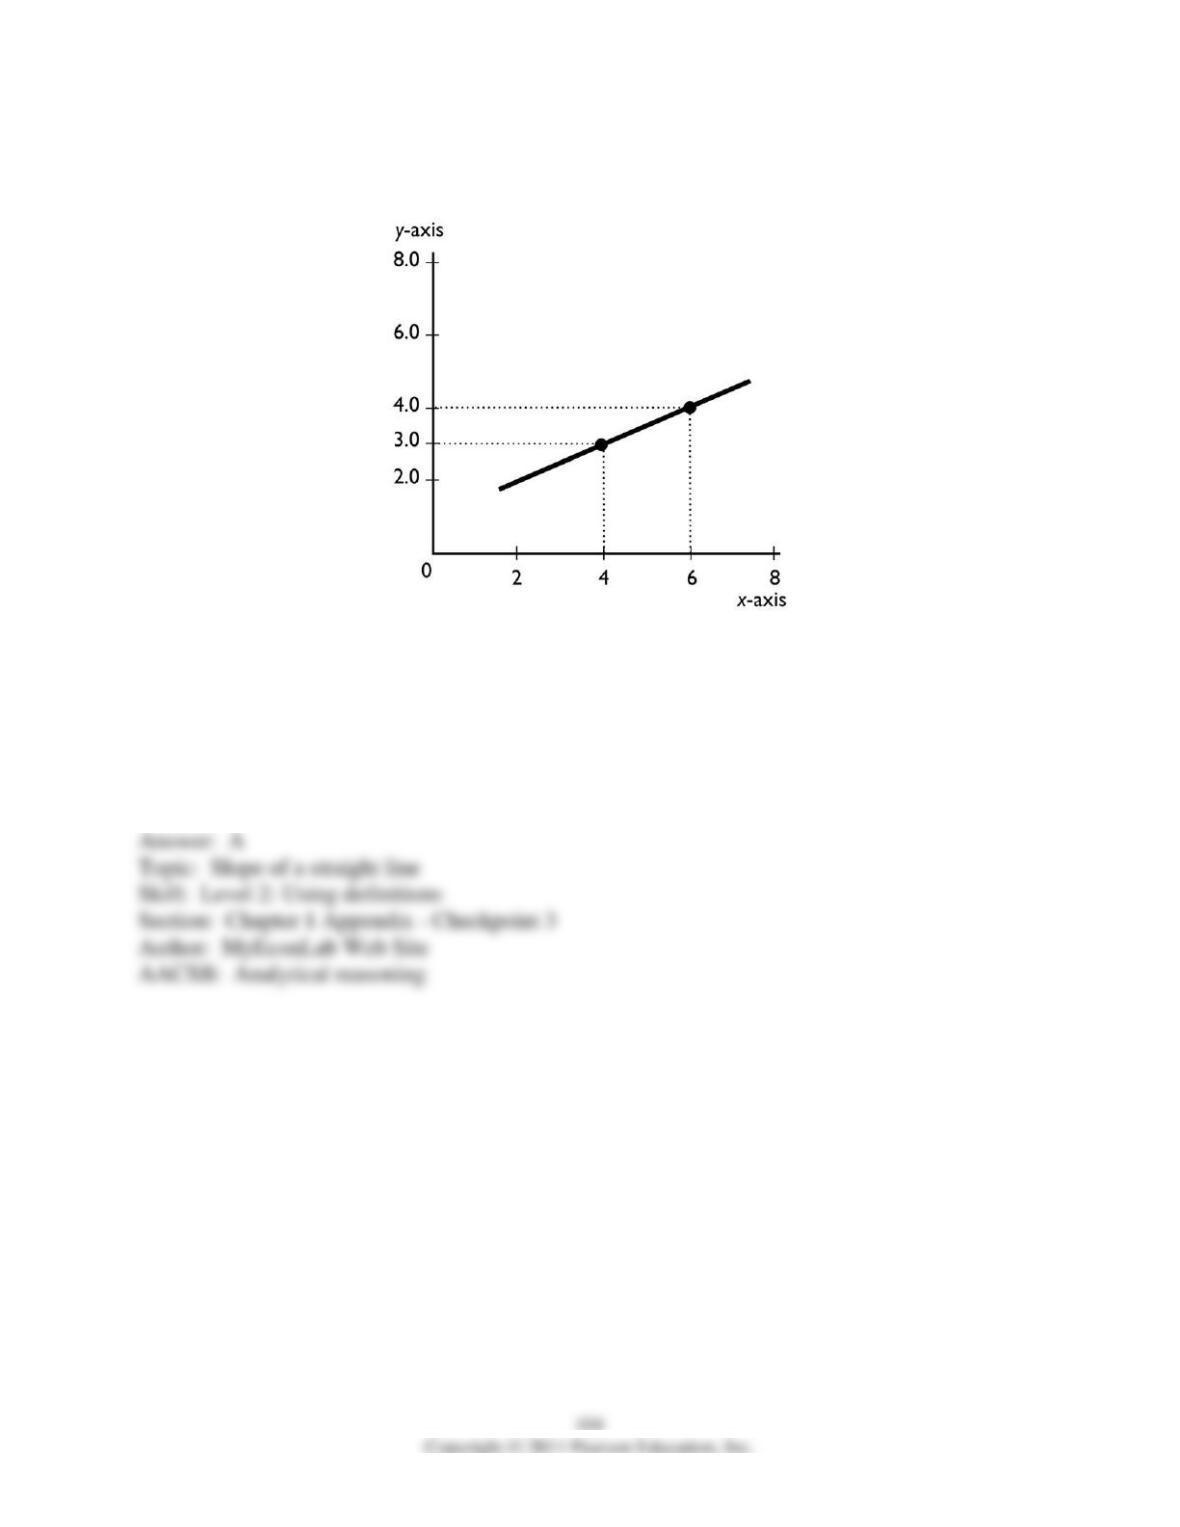
114) What is the slope of the line in the graph?
A) +1/2
B) -1/2
C) + 2
D) -2
E) -3/4
115) The slope of the curve at point B
A) is greater than the slope at point A.
B) is less than the slope at point A.
C) is equal to the slope at point A.
D) cannot be compared with the slope at point A.
E) can be compared with the slope at point A but more information is needed to determine if the
slope is greater than, less than, or equal to the slope at point A.
116) To graph a relationship involving more than two variables, we use which assumption?
A) rational decision making
B) post hoc
C) marginal analysis
D) ceteris paribus
E) trend assumption
117) To graph a relationship among several variables, we hold all but ________ variable(s)
constant and use the ________ assumption.
A) one; scarcity
B) two; ceteris paribus
C) three; scarcity
D) one; ceteris paribus
E) one; absence of trend
118) We are investigating the relationship among three variables. We have graphed two of them.
Suppose that the variable that is not measured on the x-axis or the y-axis changes. Then, there is
A) a movement along the plotted curve.
B) a shift in the plotted curve.
C) no impact on the plotted curve because the variable is not measured on either of the axes.
D) an omitted variable.
E) a violation of the absence of trend assumption.
119) When analyzing graphically the relationship between more than two variables, which of the
following must be used?
A) positive slope assumption
B) assumption of little change
C) ceteris paribus
D) negative slope assumption
E) the assumption that only relevant factors change
120) Ceteris paribus when graphing a relationship refers to
A) letting all the variables change at once.
B) changing the origin of the graph.
C) holding constant all but two variables.
D) rescaling the coordinates.
E) swapping the axes so that the x-axis is the vertical axis and the y-axis is the horizontal axis.
121) When two variables in a graph are related to a third, changing the third causes
A) a movement along the curve.
B) a shift of the curve.
C) no change in the curve because the third variable isn’t on the axes.
D) either a shift or a movement in the curve but more information is needed to determine which
occurs.
E) None of the above answers is correct.
122) On a graph showing the relationship between x and y, the ceteris paribus condition implies
that
A) no other variables are related to x and y.
B) the value of x is held constant.
C) the value of y is held constant.
D) other variables not shown are held constant.
E) the value of x and the value of y are held constant.
123) Three variables are related and two of them are plotted in a figure. If the variable that is not
measured on either the x-axis or the y-axis changes, then there is
A) a movement along the drawn curve.
B) a shift in the curve.
C) no impact on the curve because the variable is not measured on either of the axes.
D) either a shift in the curve or a movement along the curve but more information is needed to
determine which.
E) None of the above answers are correct.
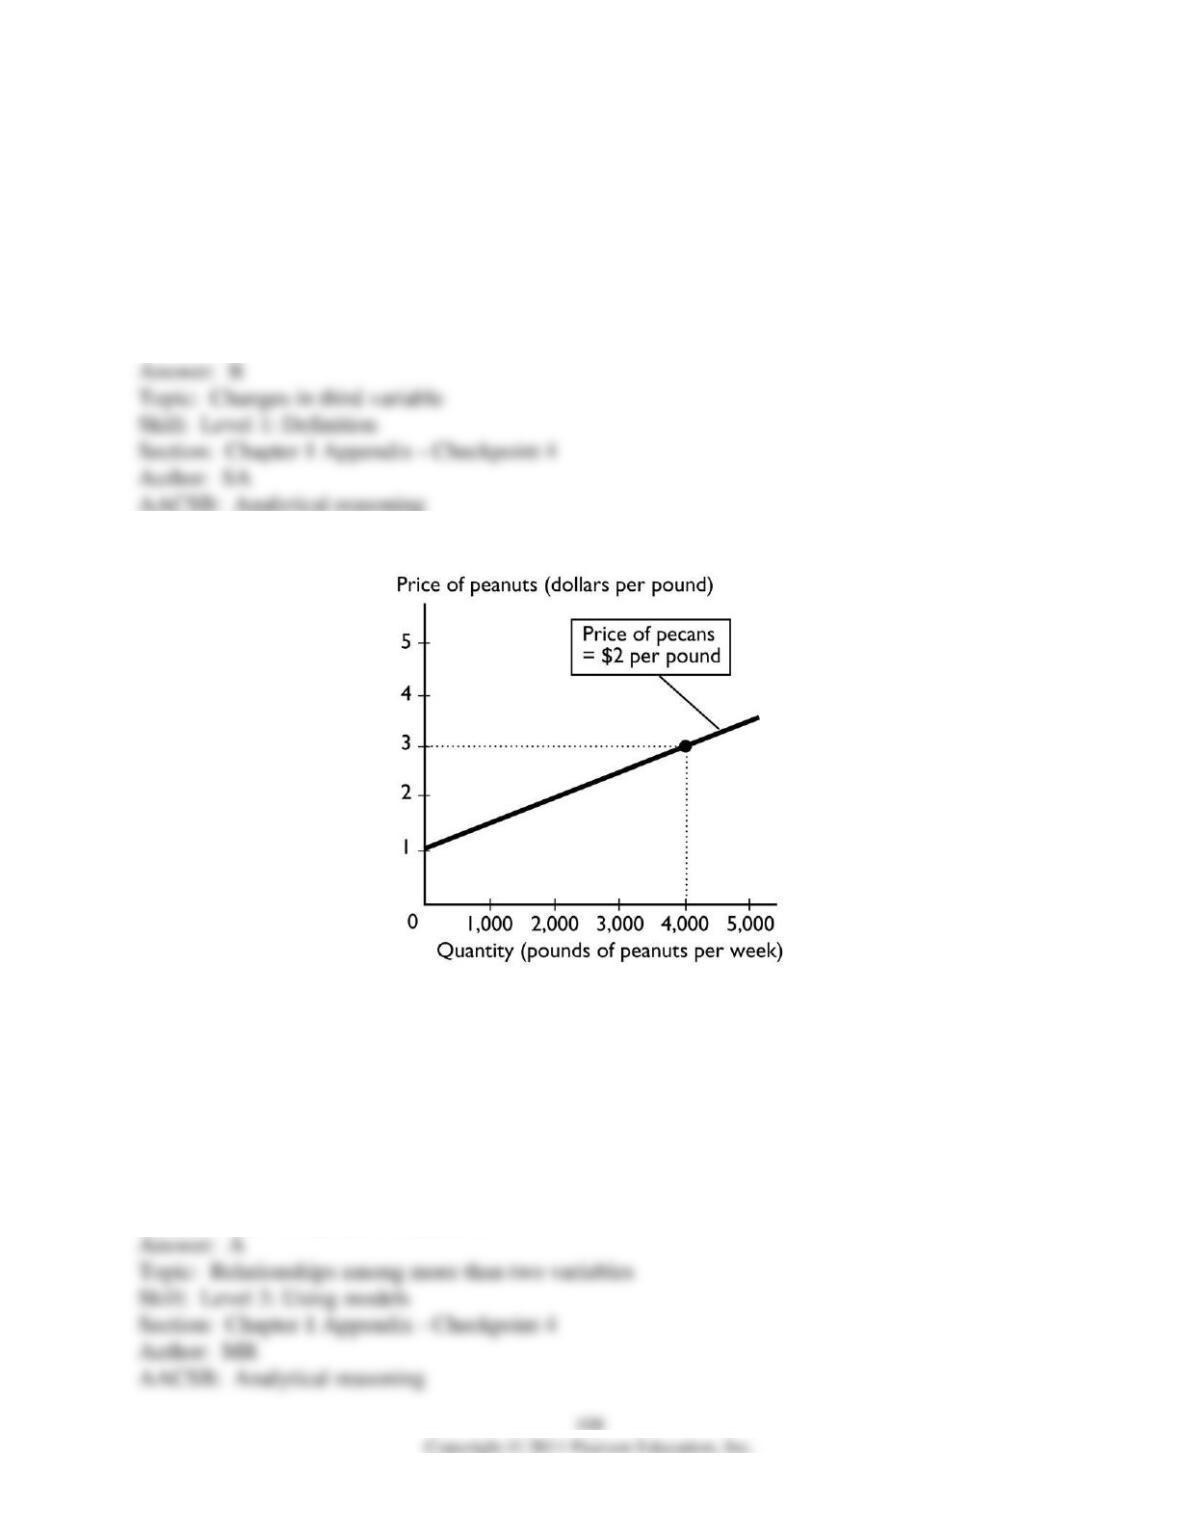
124) The above figure shows how many pounds of peanuts farmers are willing to sell at different
prices per pound of peanuts. If the price of a pound of peanuts is $1 and the price of a pound of
pecans is $2, peanut farmers are willing to sell
A) no peanuts.
B) 1000 pounds of peanuts.
C) 2000 pounds of peanuts.
D) 4000 pounds of peanuts.
E) more than 4000 pounds of peanuts.
125) In the above figure, while drawing the line showing the relationship between the price of a
pound of peanuts and the quantity sold, the
A) price of a pound of pecans does not change.
B) price of a pound of peanuts does not change.
C) the quantity of peanuts that farmers supply does not change.
D) Both answers A and B are correct.
E) Both answers B and C are correct.
126) In the figure above, suppose the price of a pound of pecans is negatively related to the
quantity of peanuts that farmers are willing to supply. If the price of pecans increases,
A) the curve will shift rightward.
B) the curve will shift leftward.
C) there is a movement along the curve.
D) the curve will be unaffected.
E) None of the above answers is correct because the graph assumes that the price of pecans does
not change.
127) To graph a relationship that involves more than two variables, we use
A) a positive relationship.
B) a direct relationship.
C) a negative relationship.
D) ceteris paribus.
E) movement up along one of the lines showing the relationship between x and y.
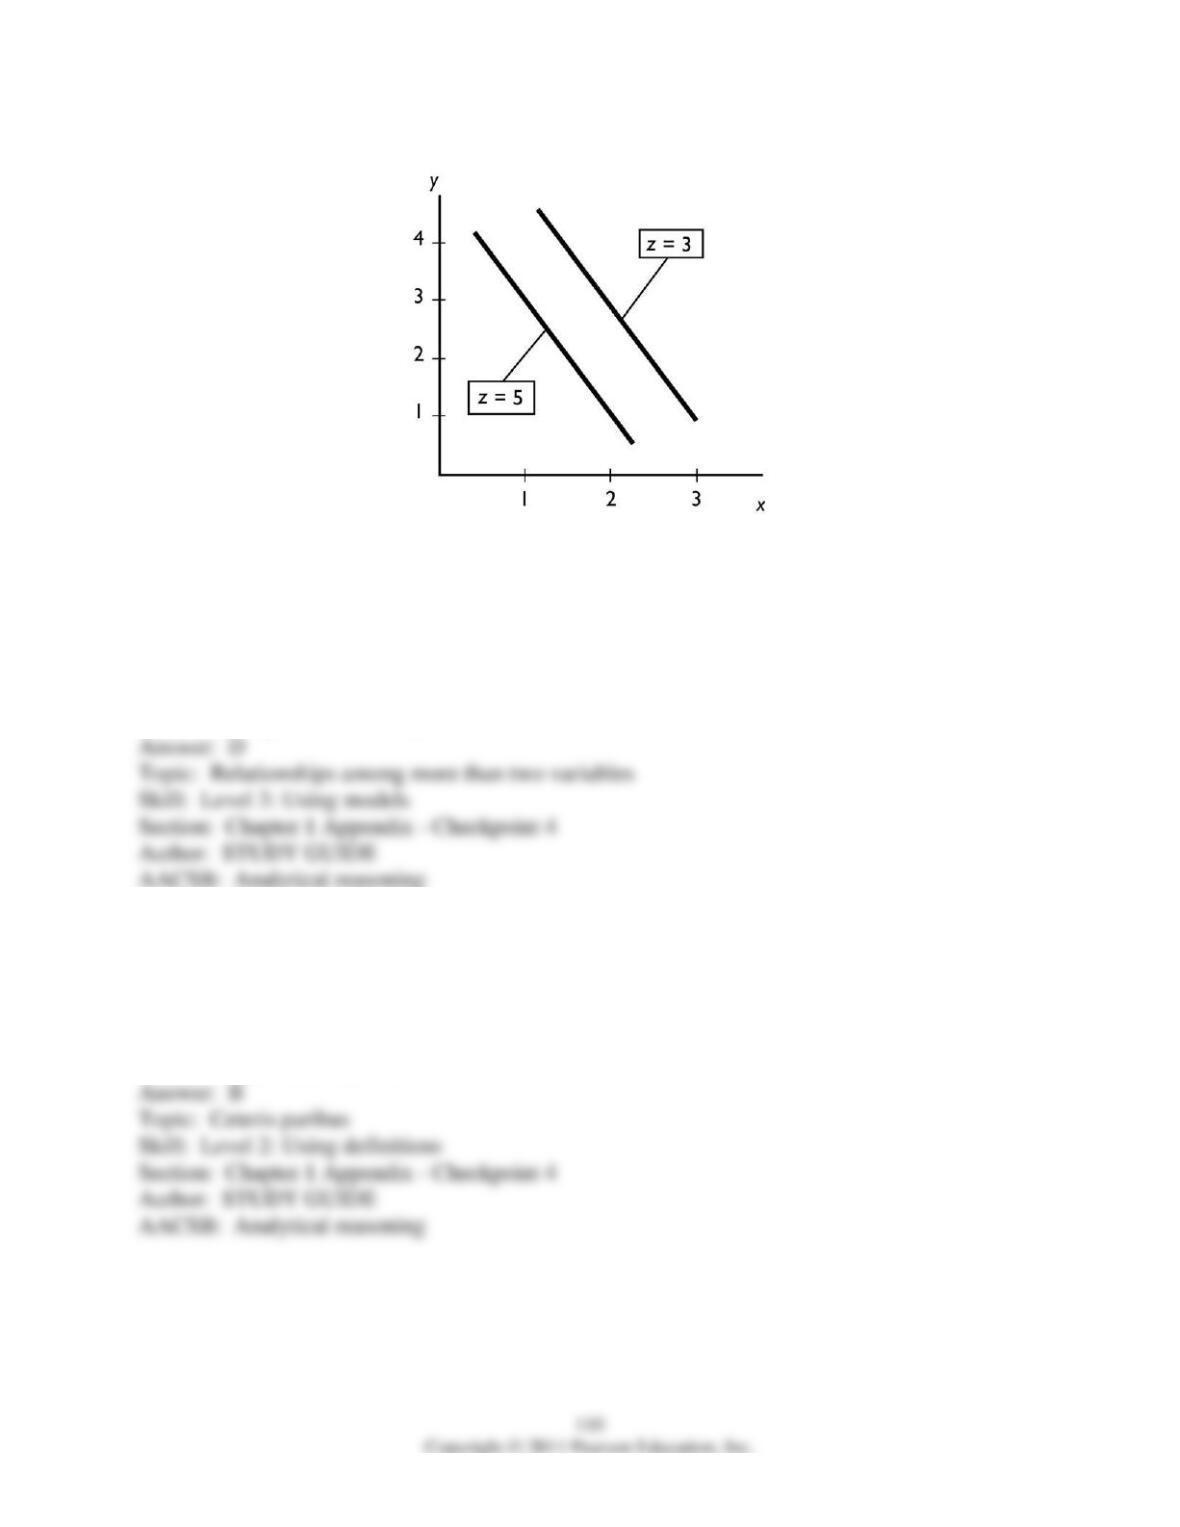
128) In the figure above, an increase in z leads to a
A) movement up along one of the lines showing the relationship between x and y.
B) movement down along one of the lines showing the relationship between x and y.
C) rightward shift of the line showing the relationship between x and y.
D) leftward shift of the line showing the relationship between x and y.
E) trend change in both x and y.
129) In the figure above, ceteris paribus, an increase in x is associated with
A) an increase in y.
B) a decrease in y.
C) an increase in z.
D) a random change in z.
E) no change in either y or z.
1.4 Integrative Questions
1) Suppose you decide to attend summer school and that this is considered a rational choice.
When making this choice,
A) you must ignore the problem of scarcity.
B) you considered the marginal cost and marginal benefit of your choice.
C) you have used the ceteris paribus assumption.
D) you have made a positive statement.
E) you must have considered the social interest.
2) Which of the following is true?
I. A rational choice is always made in the pursuit of social interest.
II. Economics is a social science.
III. Economists try to understand how the economic world works by testing positive statements.
A) II and III
B) Only I
C) Only II
D) Only III
E) I and II
3) Which of the following is true?
I. A rational choice is made on the margin.
II. Microeconomics is the study of the national economy while macroeconomics is the study of
the global economy.
III. Economists try to understand how the economic world works by testing normative
statements.
A) Only I
B) I and III
C) Only II
D) Only III
E) I and II
4) Will, Bill, and Phil decide to study an extra hour for an exam. Instead of studying, they could
have gone out to eat, played football, or watched TV. Which of the following statements is
correct?
A) The benefit the three students receive must be the same because they all make the same
choice.
B) The students made a rational choice as long as they face no scarcity.
C) The students could each have different opportunity costs.
D) The marginal cost of the decision is the same if they make the same score on the exam.
E) Going out to eat, playing football, and watching TV are all called sunk costs.
5) Which of the following is true regarding a normative statement?
i) It uses the ceteris paribus assumption.
ii) It is a value judgment.
iii) It accounts for opportunity costs.
A) i and iii.
B) ii and iii.
C) i only.
D) ii only.
E) i, ii, and iii.
6) To help unscramble cause and effect, economists
A) use the concept of opportunity costs.
B) must use the ceteris paribus assumption.
C) answer the “what” question.
D) answer the “how” question.
E) must use normative statements.
7) Which of the following is true regarding this statement? “The president’s decision to spend
more money on national defense is smart.”
A) This is a normative statement.
B) The federal government does not face scarcity.
C) This topic would be studied in microeconomics.
D) Social interest must always be more important than self-interest.
E) Ceteris paribus does not apply to the government.
1.5 Chapter Figures
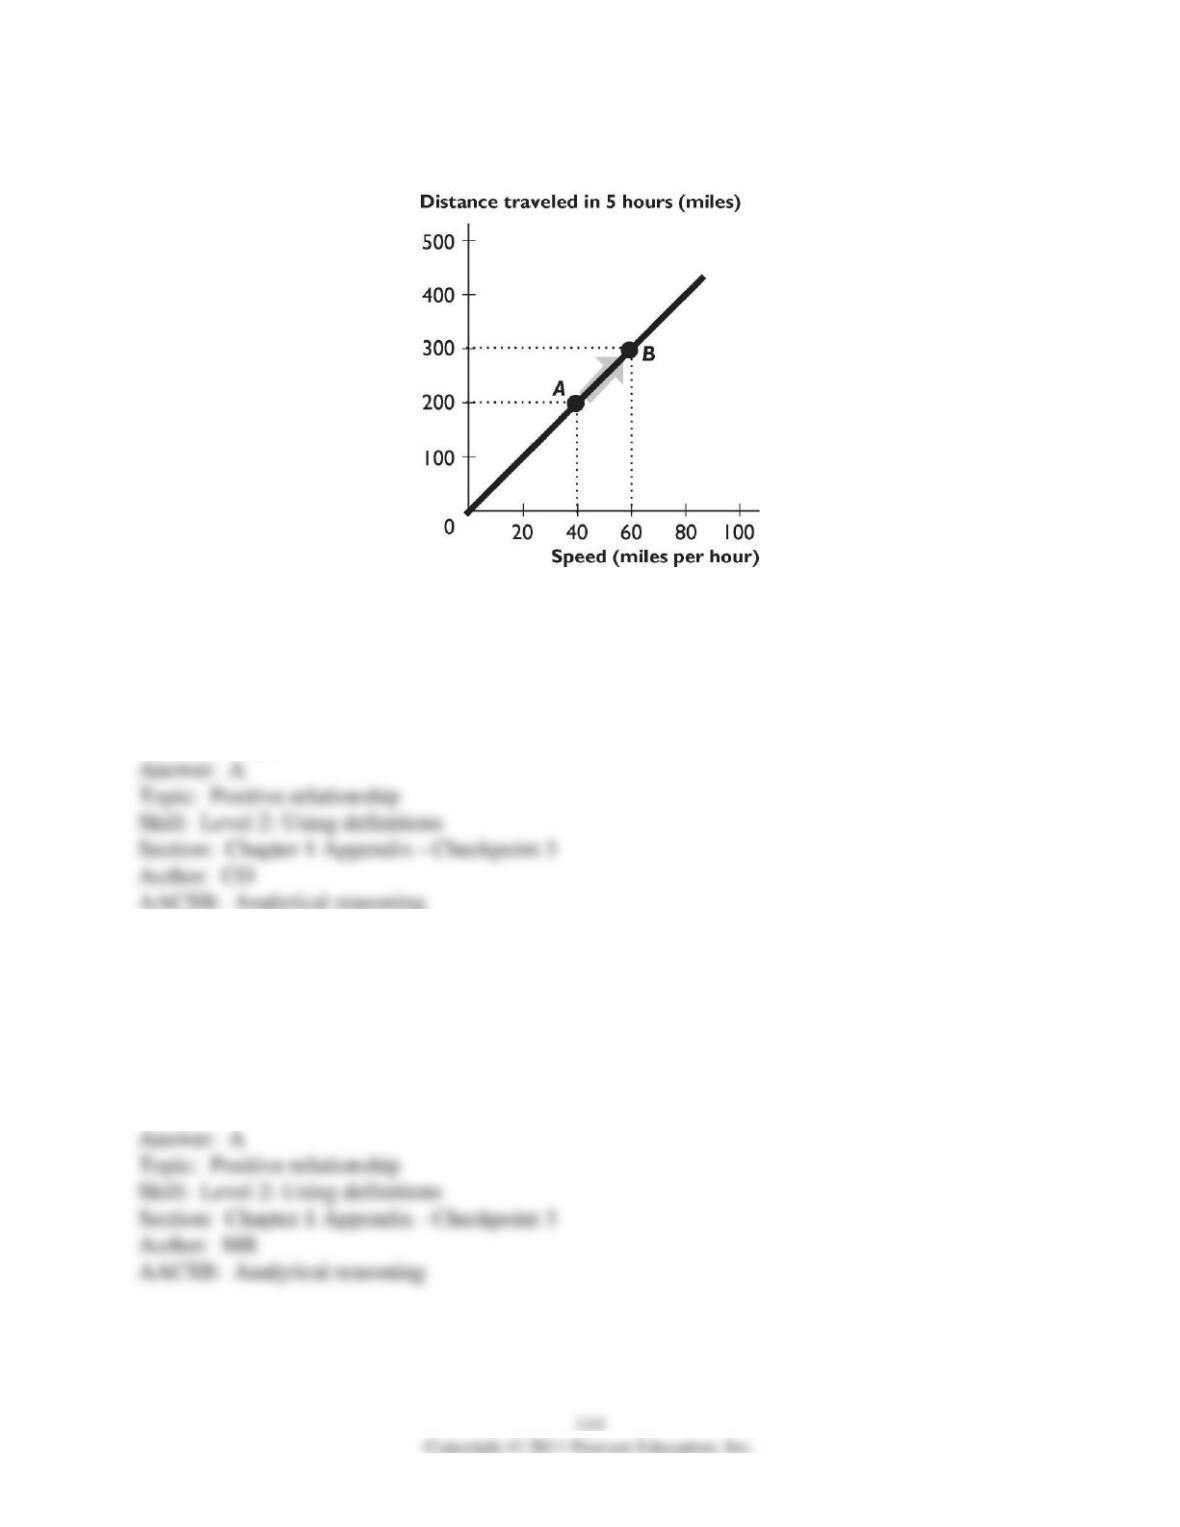
1) The relationship between distance traveled in 5 hours and speed shown in the figure above is
A) direct, linear.
B) inverse, linear.
C) direct, non-linear.
D) inverse, positive.
E) direct, negative.
2) The relationship between distance traveled in five hours and speed shown in the figure above
is
A) positive.
B) negative.
C) inverse.
D) cross-sectional.
E) multilateral.
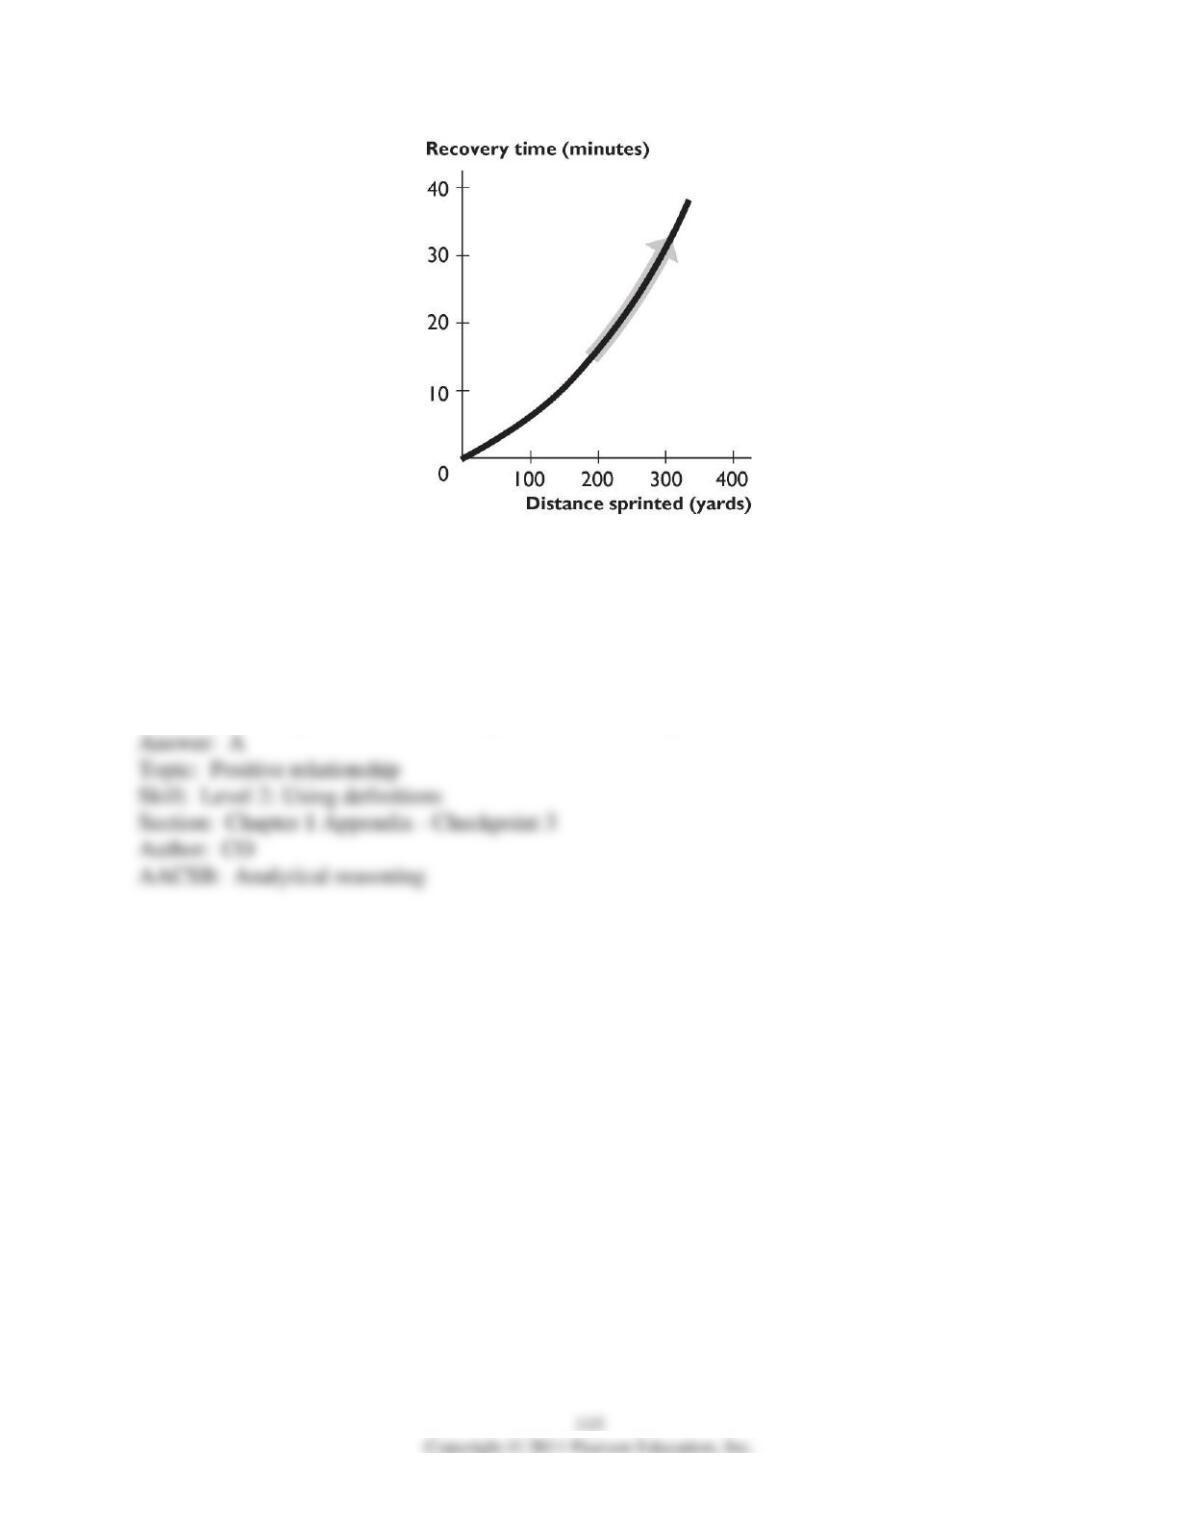
3) The figure above shows the relationship between distance sprinted and recovery time. The
curve becomes steeper because as the distance sprinted increases,
A) the extra recovery time needed from sprinting another 100 yards increases.
B) the extra recovery time needed from sprinting another 100 yards decreases.
C) the recovery time increases.
D) the recovery time decreases.
E) the relationship between distance sprinted and recovery time becomes more inverse.
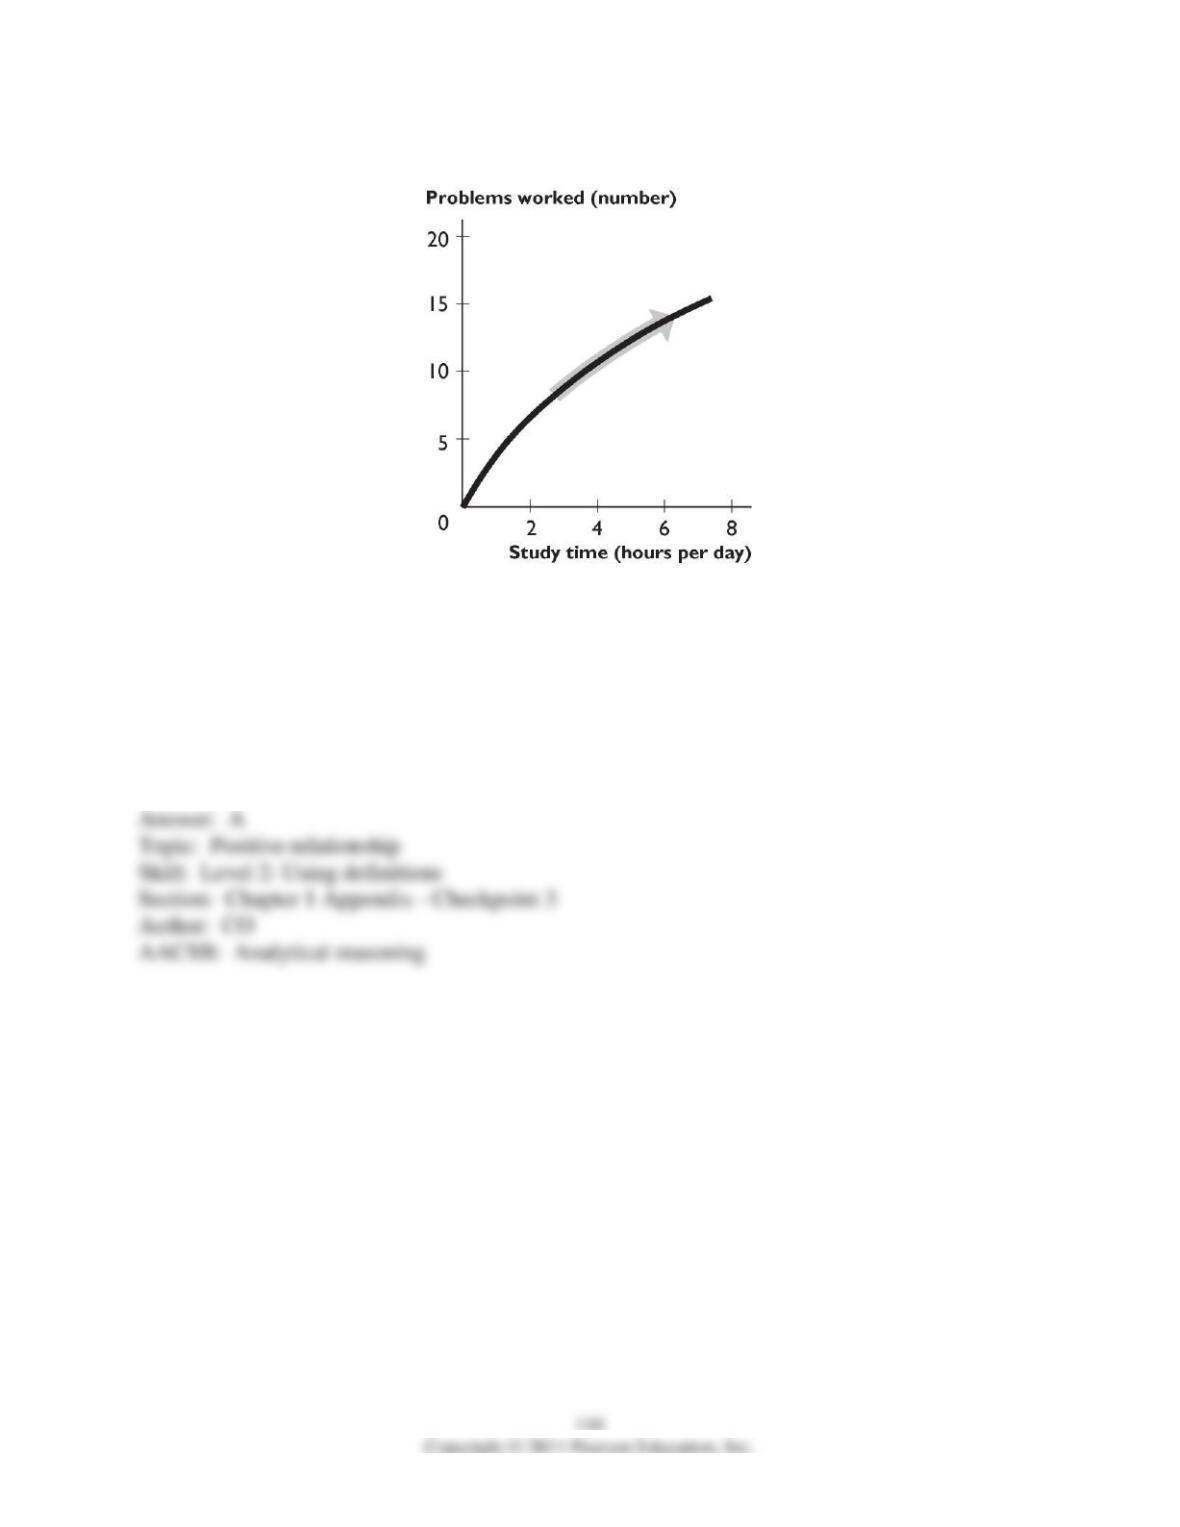
4) The figure above shows the relationship between study time and the number of problems
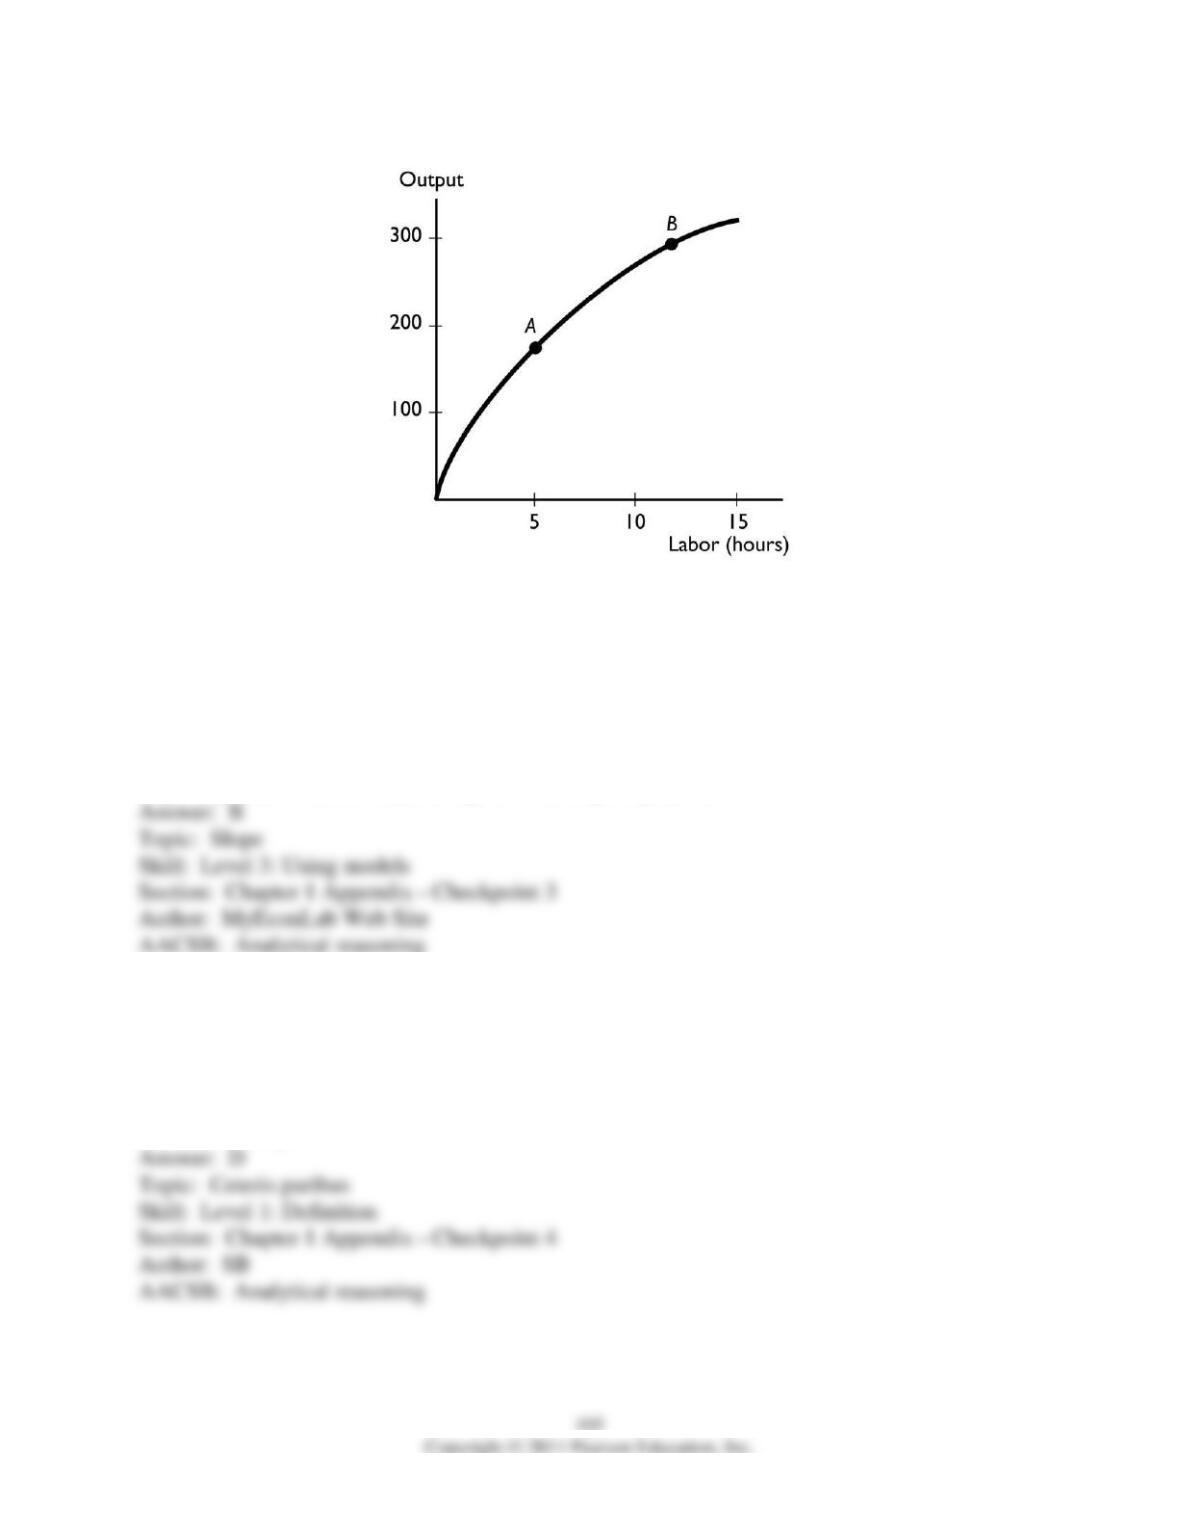
worked. The curve becomes less steep because as you study more,
A) study time becomes less effective.
B) study time becomes more effective.
C) the number of problems worked increases.
D) the number of problems worked decreases.
E) the relationship between study time and the number of problems worked changes from direct
to inverse.
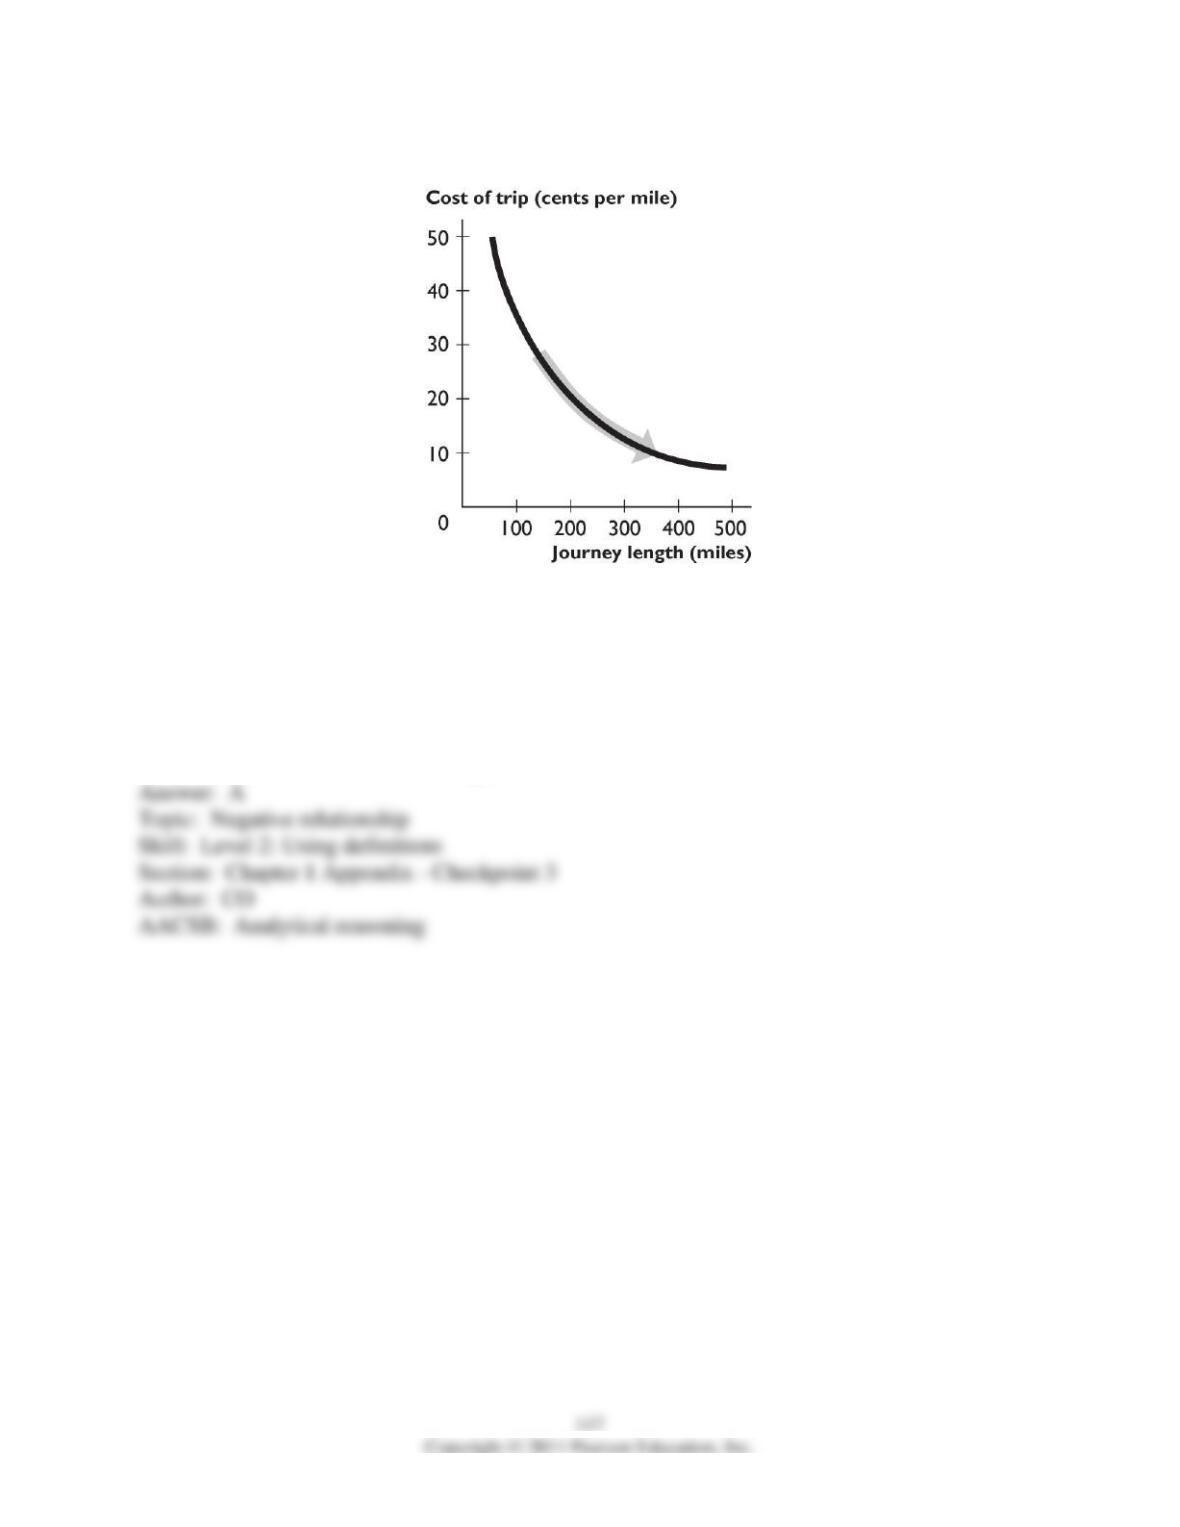
5) The figure above shows the relationship between the journey length and the cost of trip per
mile. The curve becomes flatter because as the journey length increases,
A) the fall in the cost per mile becomes smaller.
B) the fall in the cost per mile becomes greater.
C) the cost per mile decreases.
D) the cost per mile increases.
E) the cost per mile remains unchanged.
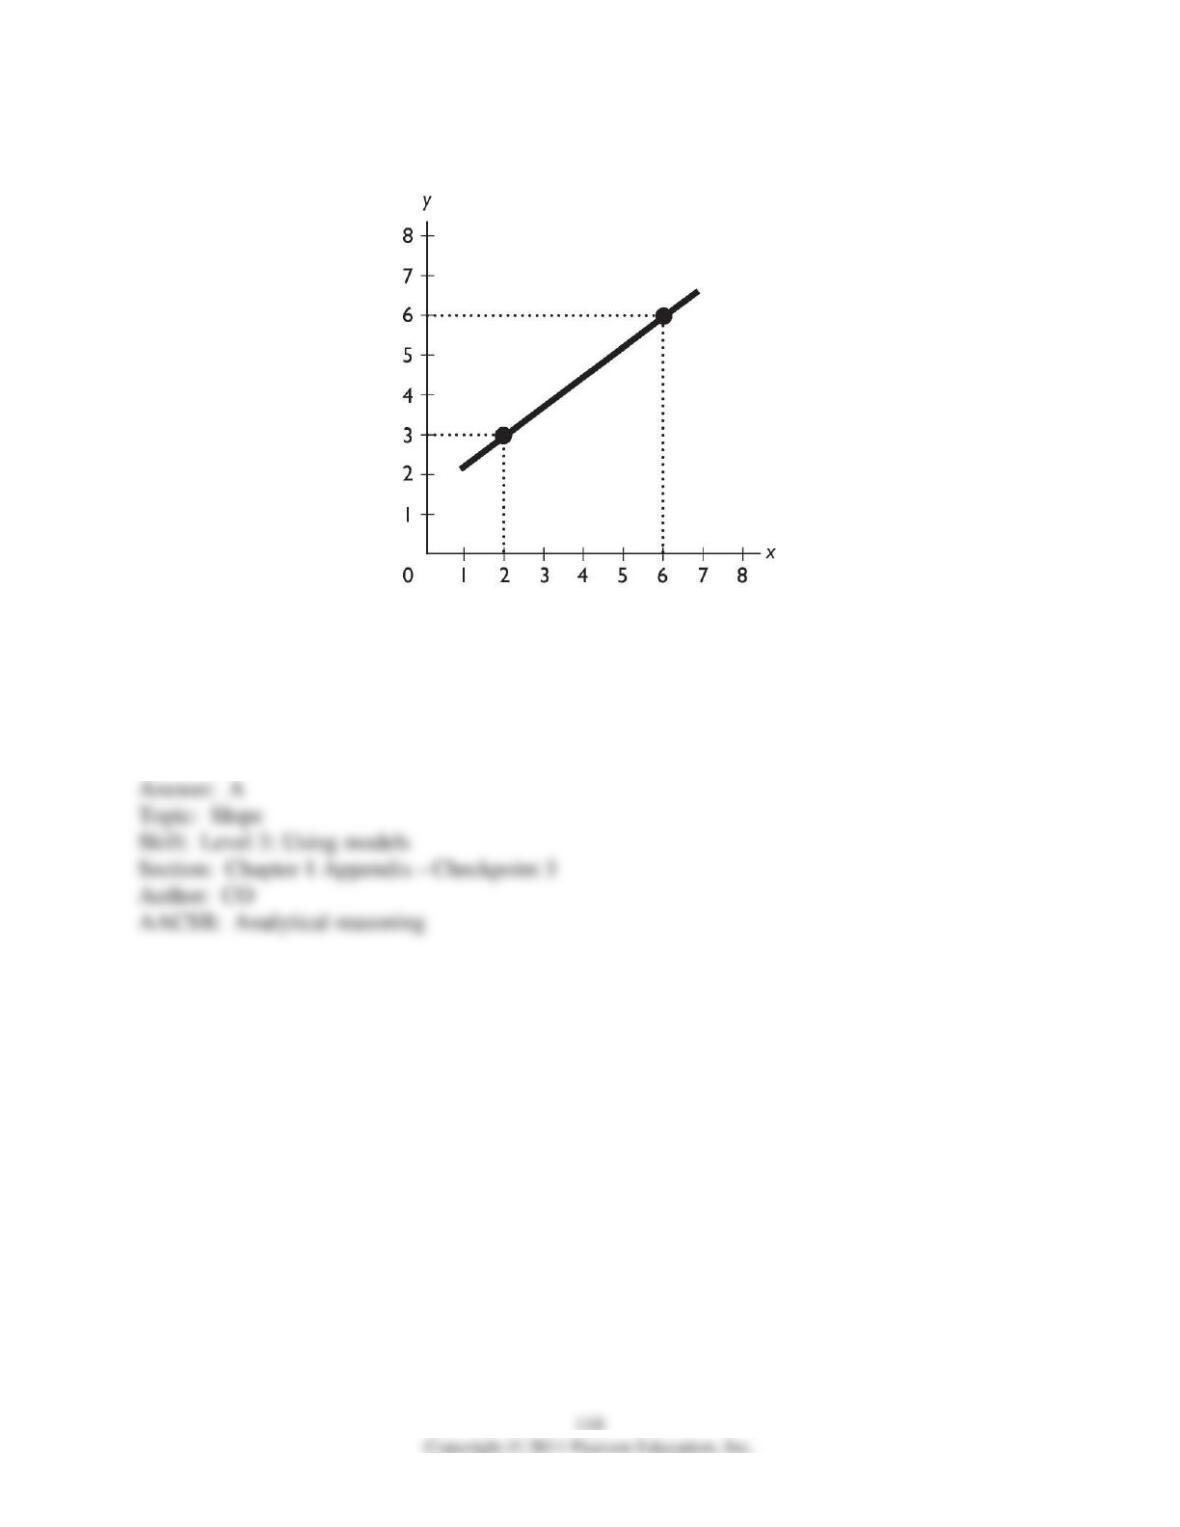
6) What is the slope of the line in the figure above?
A) 0.75
B) -0.75
C) 1.33
D) -1.33
E) Zero
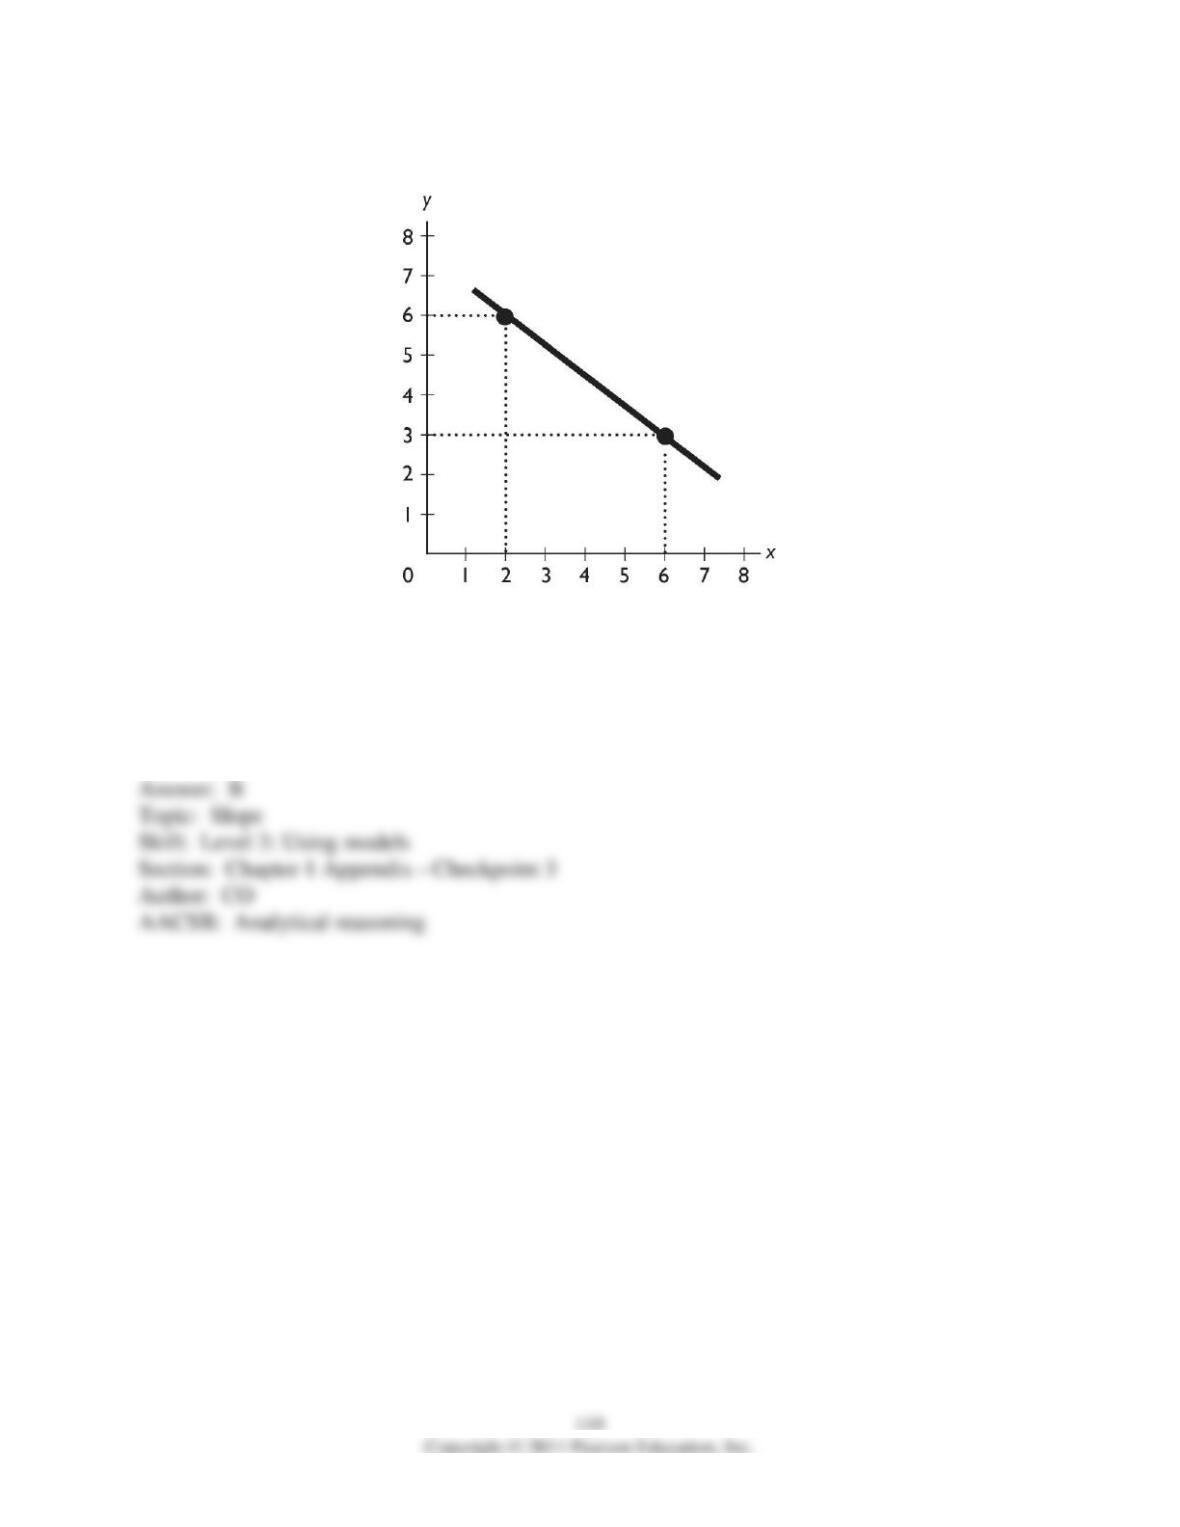
7) What is the slope of the line in the figure above?
A) 0.75
B) -0.75
C) 1.33
D) -1.33
E) Zero
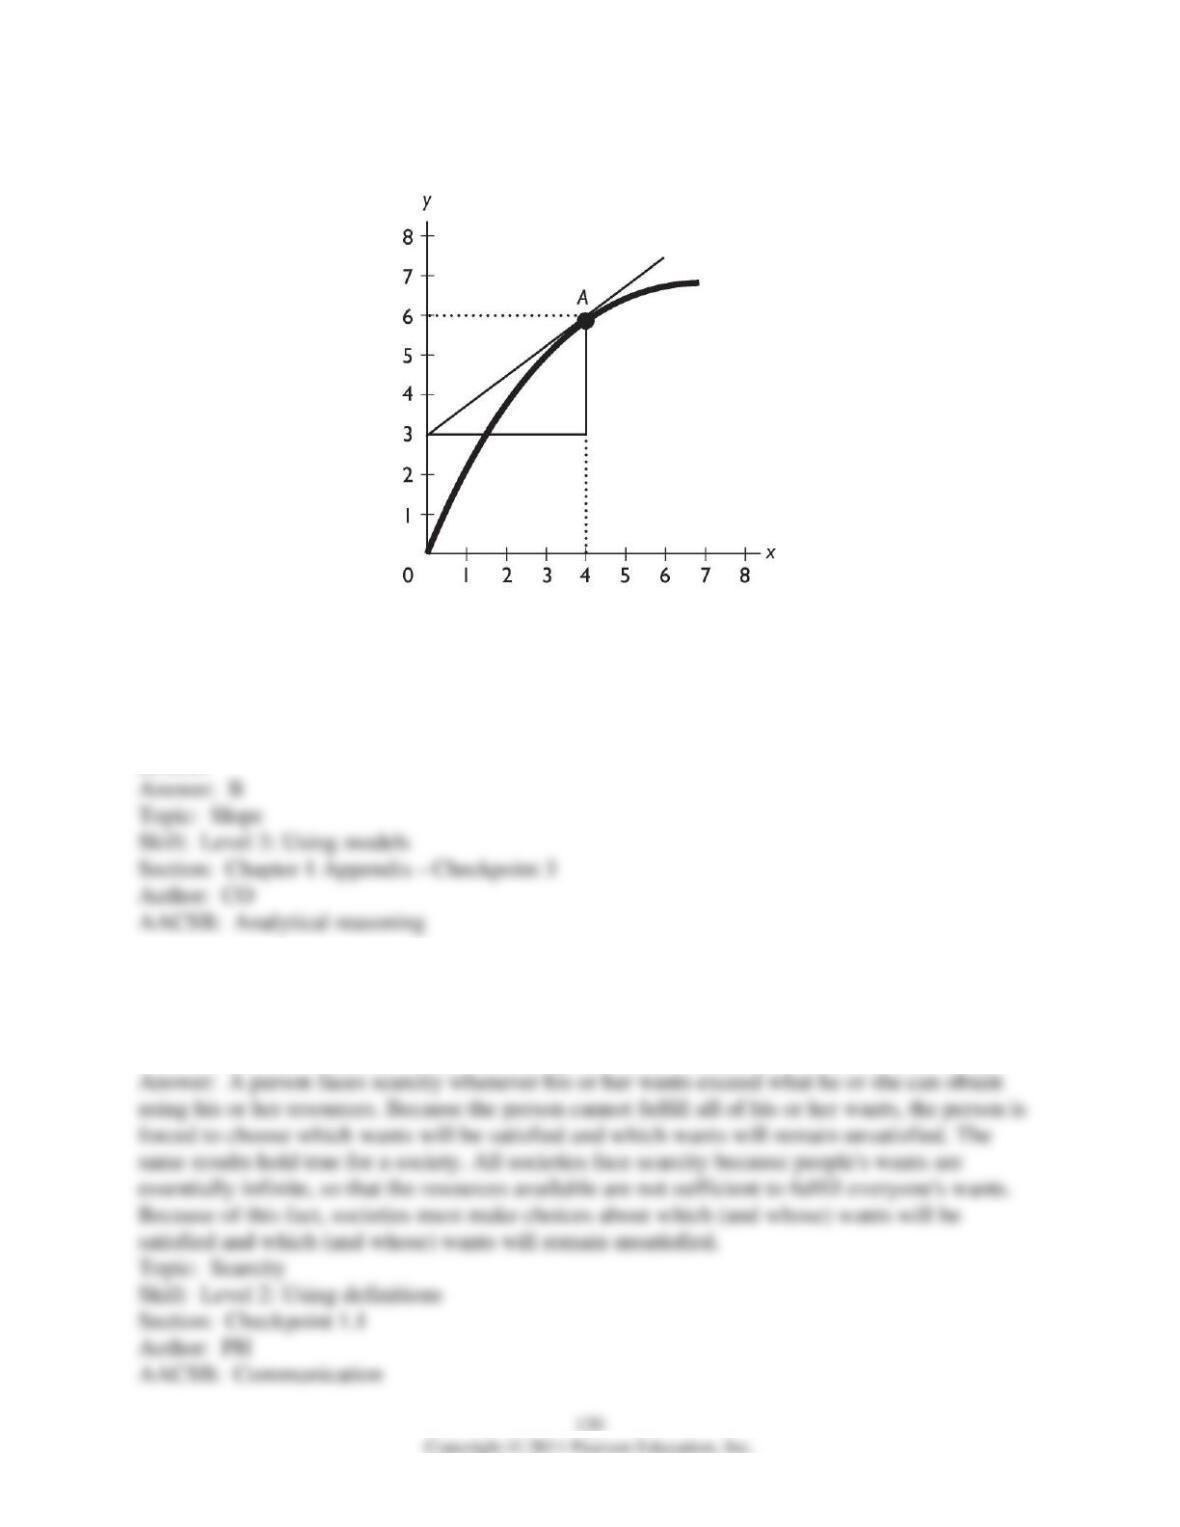
8) In the figure above, what is the slope of the curve at point A?
A) 0.75
B) -0.75
C) 1.33
D) -1.33
E) Zero
1.6 Essay: Definition and Questions
1) What is the relationship between wants, resources, scarcity, and choices? Discuss the
relationship for an individual and for a society.