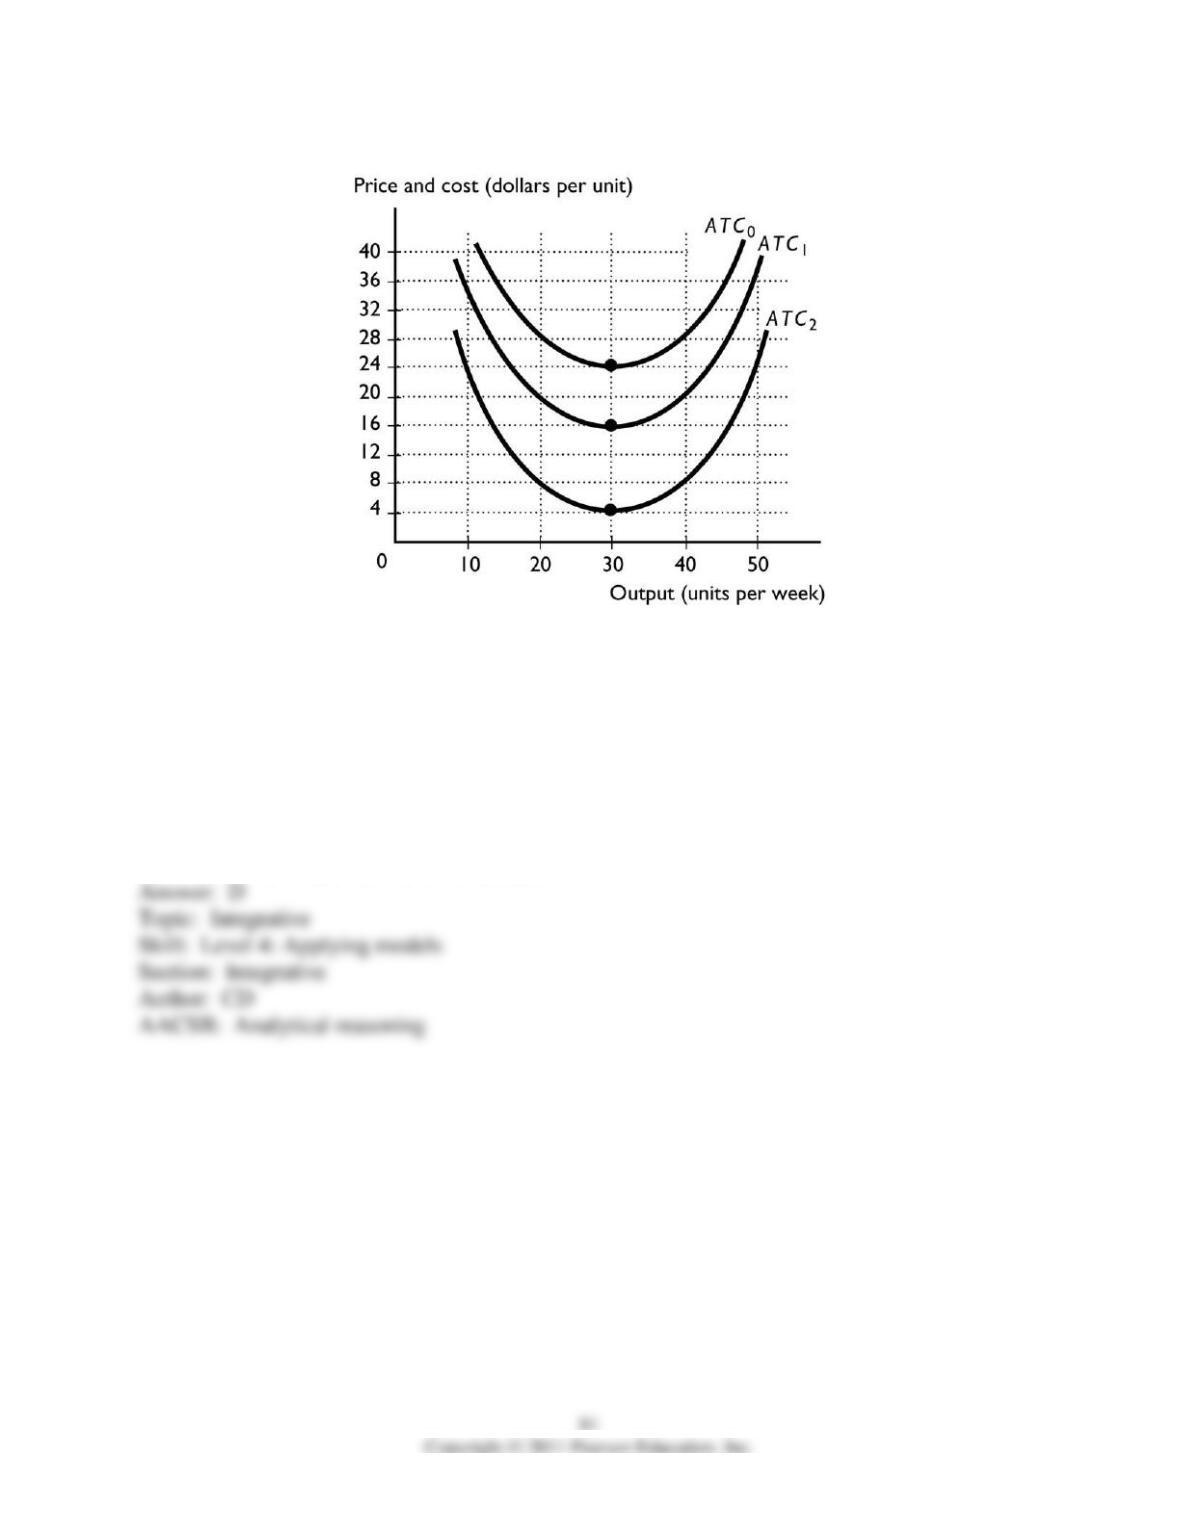
2) The above figure shows three possible average total cost curves. If all firms in a perfectly
competitive industry each have an average total cost curve identical to ATC0, each produces 20
units, and the market price of the good is $16 per unit, then
A) the firms earn an economic profit of $8 per unit.
B) firms will enter the industry and the number of firms increases.
C) the firms’ ATC curves will eventually shift to become the same as ATC1.
D) firms will exit the industry and the number of firms decreases.
E) Both answer A and answer B are correct.
3) The above figure shows three possible average total cost curves. If all firms in a perfectly
competitive industry each have an average total cost curve identical to ATC2, each produces 40
units, and the market price of the good is $20 per unit, then
A) the firms incur an economic loss of $12 per unit.
B) firms will enter the industry and the number of firms increases.
C) the firms’ ATC curves will eventually shift to become the same as ATC1.
D) firms will exit the industry and the number of firms decreases.
E) Both answer A and answer D are correct.
4) The above figure shows three possible average total cost curves. If all firms in a perfectly
competitive industry each have an average total cost curve identical to ATC1, each produce 30
units, and the market price of the good is $16 per unit, then the firms
A) earn a normal profit and firms neither enter nor exit the industry.
B) earn only a normal profit and so some firms exit the industry.
C) incur an economic loss and so some firms exit the industry.
D) incur an economic loss and so new firms enter the industry.
E) earn an economic profit and new firms enter the industry.
5) The above figure shows three possible average total cost curves. If all firms in a perfectly
competitive industry each have an average total cost curve identical to ATC1, each produce 30
units, and the market price of the good is $16 per unit, then the firms
A) earn a normal profit and new firms enter the market.
B) earn a normal profit and no firms enter or exit the market.
C) earn a normal profit and some firms exit the market.
D) incur an economic loss and some firms exit the market.
E) earn an economic profit and new firms enter the market.
6) If firms in a perfectly competitive industry are earning an economic profit and new firms enter
the industry, then
A) consumer surplus decreases.
B) the existing firms’ economic profit decreases.
C) there must be external benefits to consumption of the good.
D) the new firms must incur an economic loss.
E) Both answer A and answer B are correct.
7) Suppose that each of 8,000 firms in a perfectly competitive industry produces 1,000 units of a
good and maximizes profits when the price of the good is $10. If there is a permanent increase in
demand, in the short run each firm produces ________ 1,000 units and in the long run the
number of firms is ________ 8,000.
A) more than; more than
B) less than; more than
C) less than; less than
D) more than; less than
E) exactly; more than
8) Suppose that each of 10,000 perfectly competitive firm in an industry produces 1,000 units of
a good and earns an economic profit when the price of the good is $10. In the long run, definitely
A) each firm increases its production above 1,000 units.
B) the number of firms is more than 10,000.
C) consumer surplus decreases.
D) producer surplus increases.
E) the number of firms is less than 10,000.
14.6 Essay: A Firm’s Profit Maximizing Choices
1) Is the number of sellers in the market the only thing that is different in each of the four market
types economists study?
2) Why do you never see firms in a perfectly competitive market advertise their product?
3) What are the four types of markets? Give a brief description of each type.
4) What four conditions define a perfectly competitive market?
5) “Perfectly competitive firms have total control over the price they set for their product.”
Explain why the previous statement is correct or incorrect.
6) Does a perfectly competitive producer have any incentive to lower its price so it is below the
current market price? Explain your answer
7) Why are perfectly competitive ranchers in Montana price takers?
8) “A perfectly competitive firm is called a price maker because all the firms together must make
the market price.” Is the previous statement correct or incorrect? Briefly explain your answer.
9) If a perfectly competitive firm manufacturing chairs produces 100 more chairs, what happens
to the market price of a chair?
10) Pineapple growing is a perfectly competitive industry. How does the market demand curve
for pineapples compare to the demand curve for an individual pineapple grower?
11) What is the shape of the demand curve faced by the perfectly competitive firm, and why?
12) Why does the profit-maximizing level of production occur at the point where marginal
revenue equals marginal cost?
13) If the market price faced by a perfectly competitive firm increases, in the short run how does
the firm respond?
14) What is a perfectly competitive firm’s short-run supply curve?
15) If the price received by a perfectly competitive firm is less than its average variable cost,
what will the firm do in the short run? Why?
16) Will a perfectly competitive firm ever produce in the short run even though it is suffering an
economic loss?
17) What must be the case if a perfectly competitive firm’s economic loss is less by shutting
down rather than by producing and selling some output?
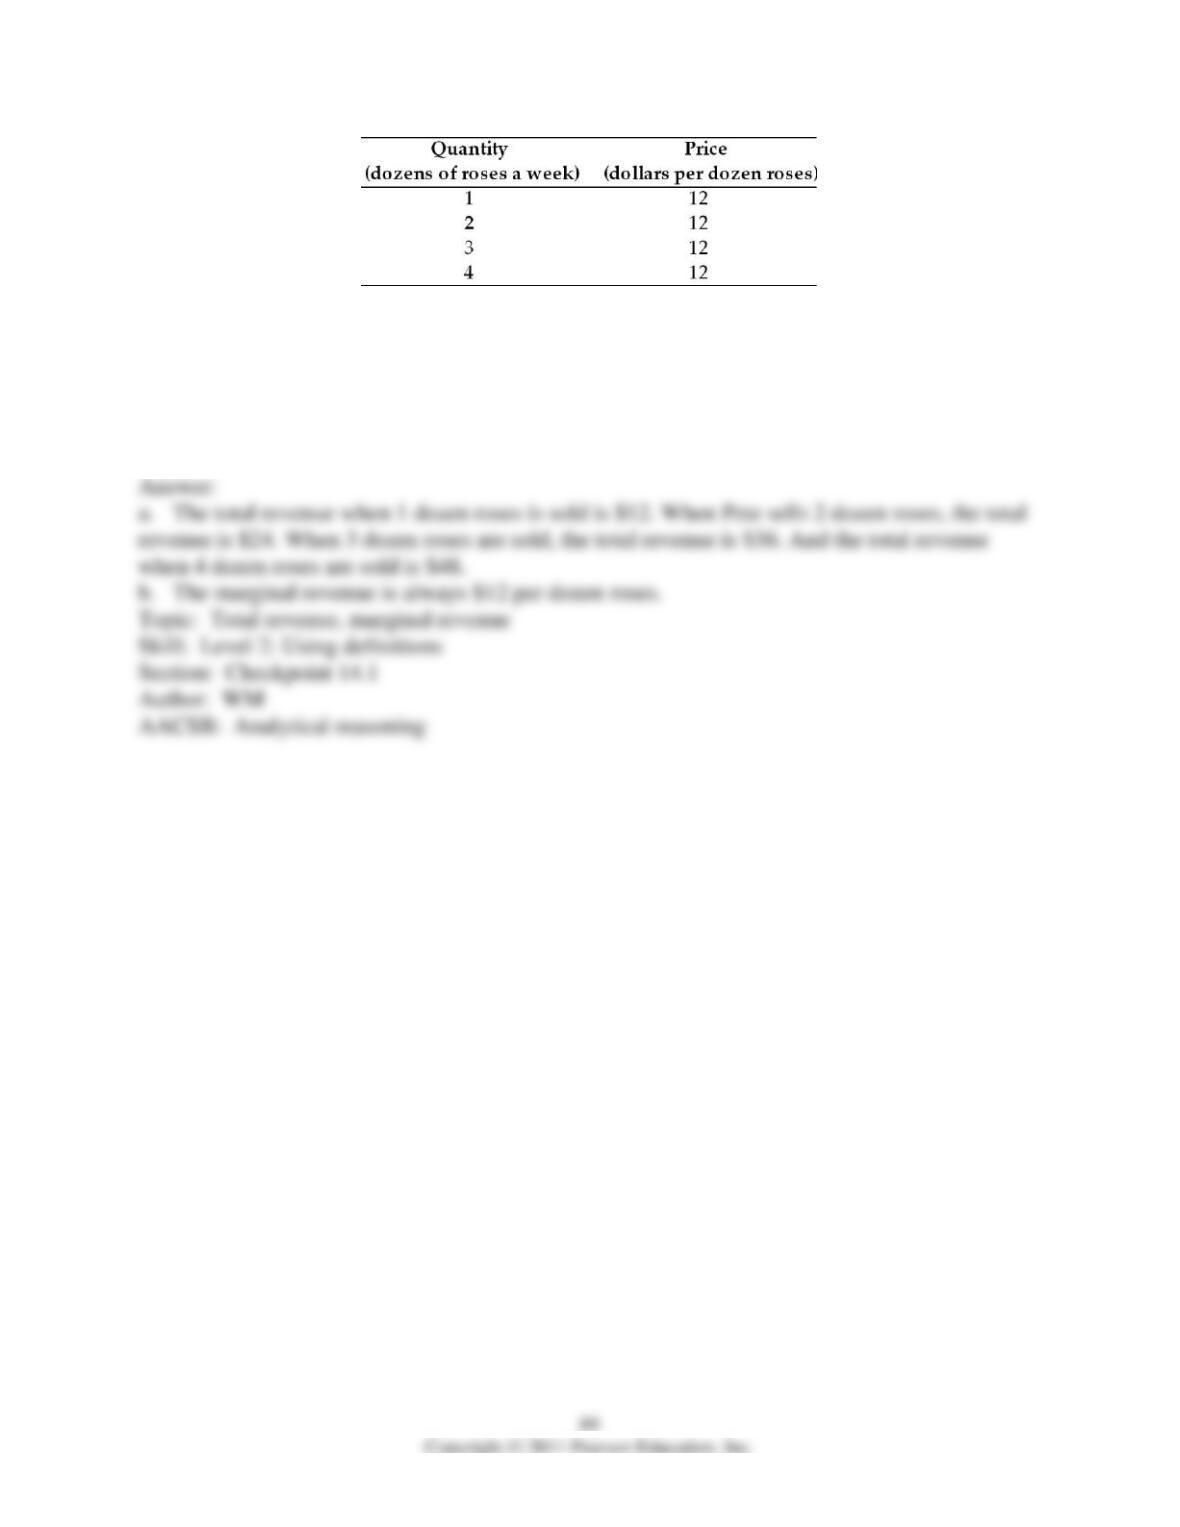
18) Pete is a perfectly competitive rose grower. The above table gives quantities and the price for
which Pete can sell his roses.
a. What is Pete’s total revenue if he sells 1 dozen roses? 2 dozen roses? 3 dozen roses? 4 dozen
roses?
b. What is the marginal revenue of the 2nd dozen roses sold? Of the 3rd dozen? Of the 4th
dozen?
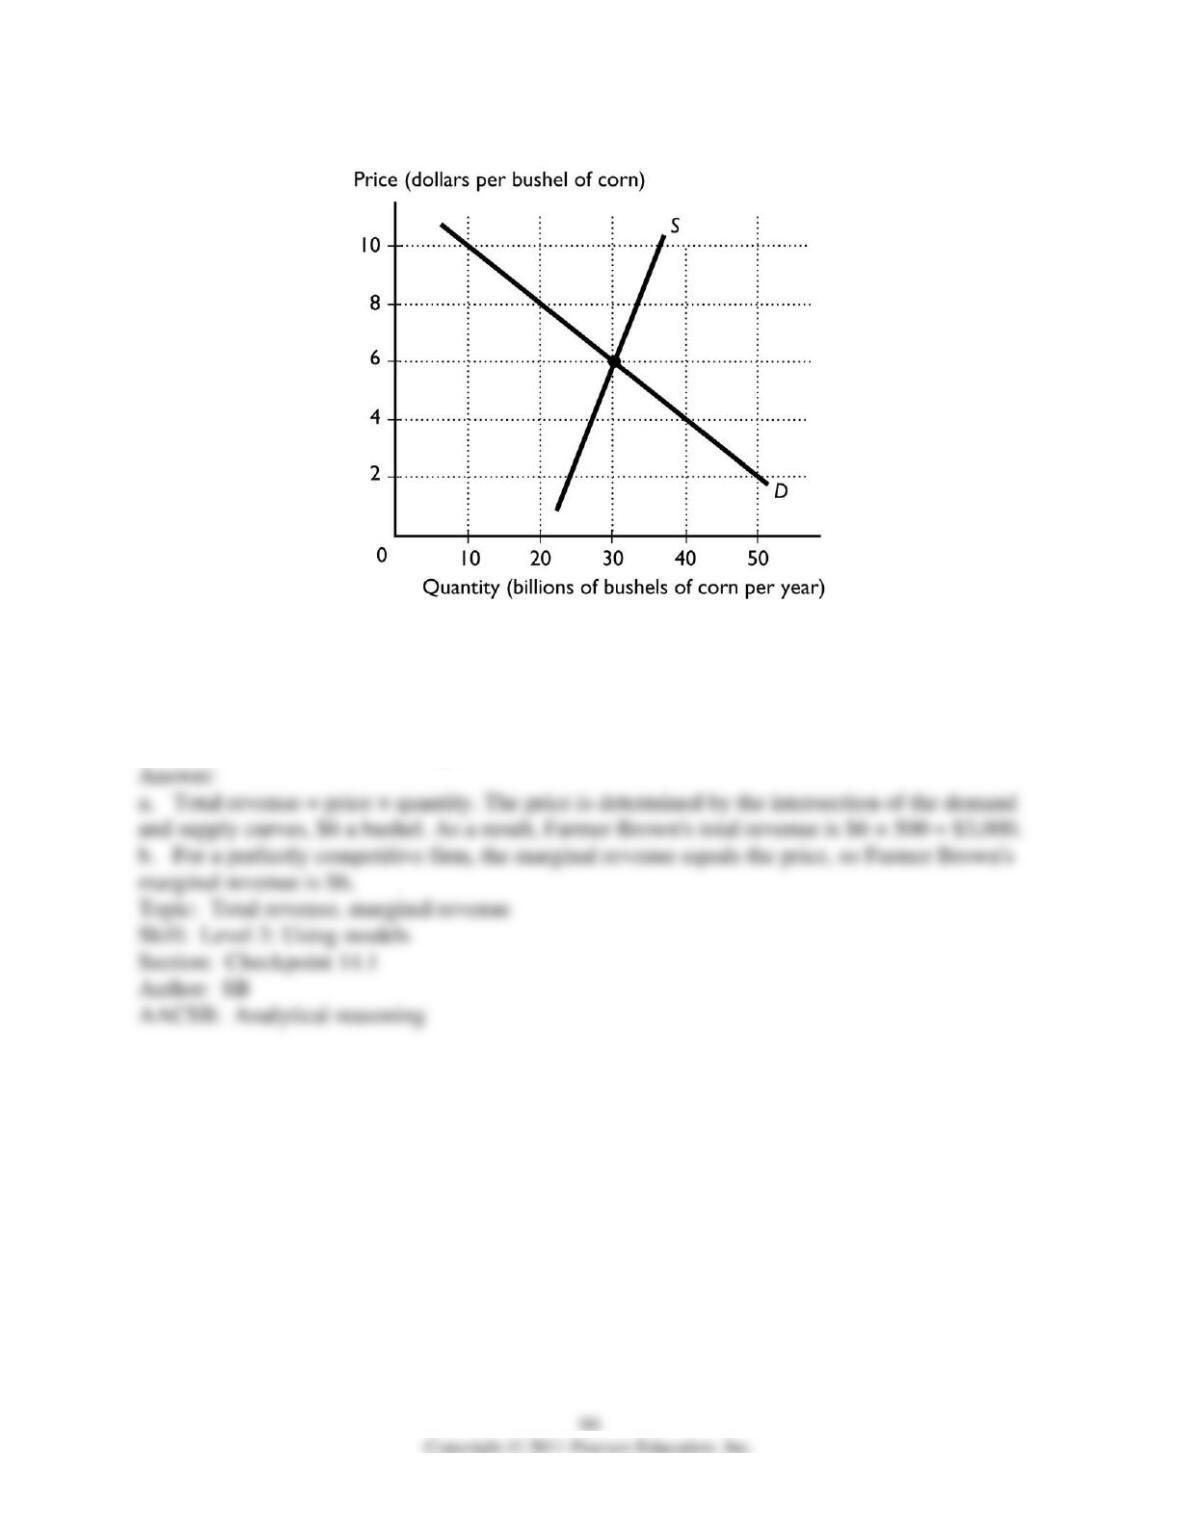
19) Farmer Brown produces corn in a perfectly competitive market. Farmer Brown produces and
sells 500 bushels of corn. The market supply and demand curves are illustrated in the above
figure.
a. What is Farmer Brown’s total revenue?
b. What is Farmer Brown’s marginal revenue?
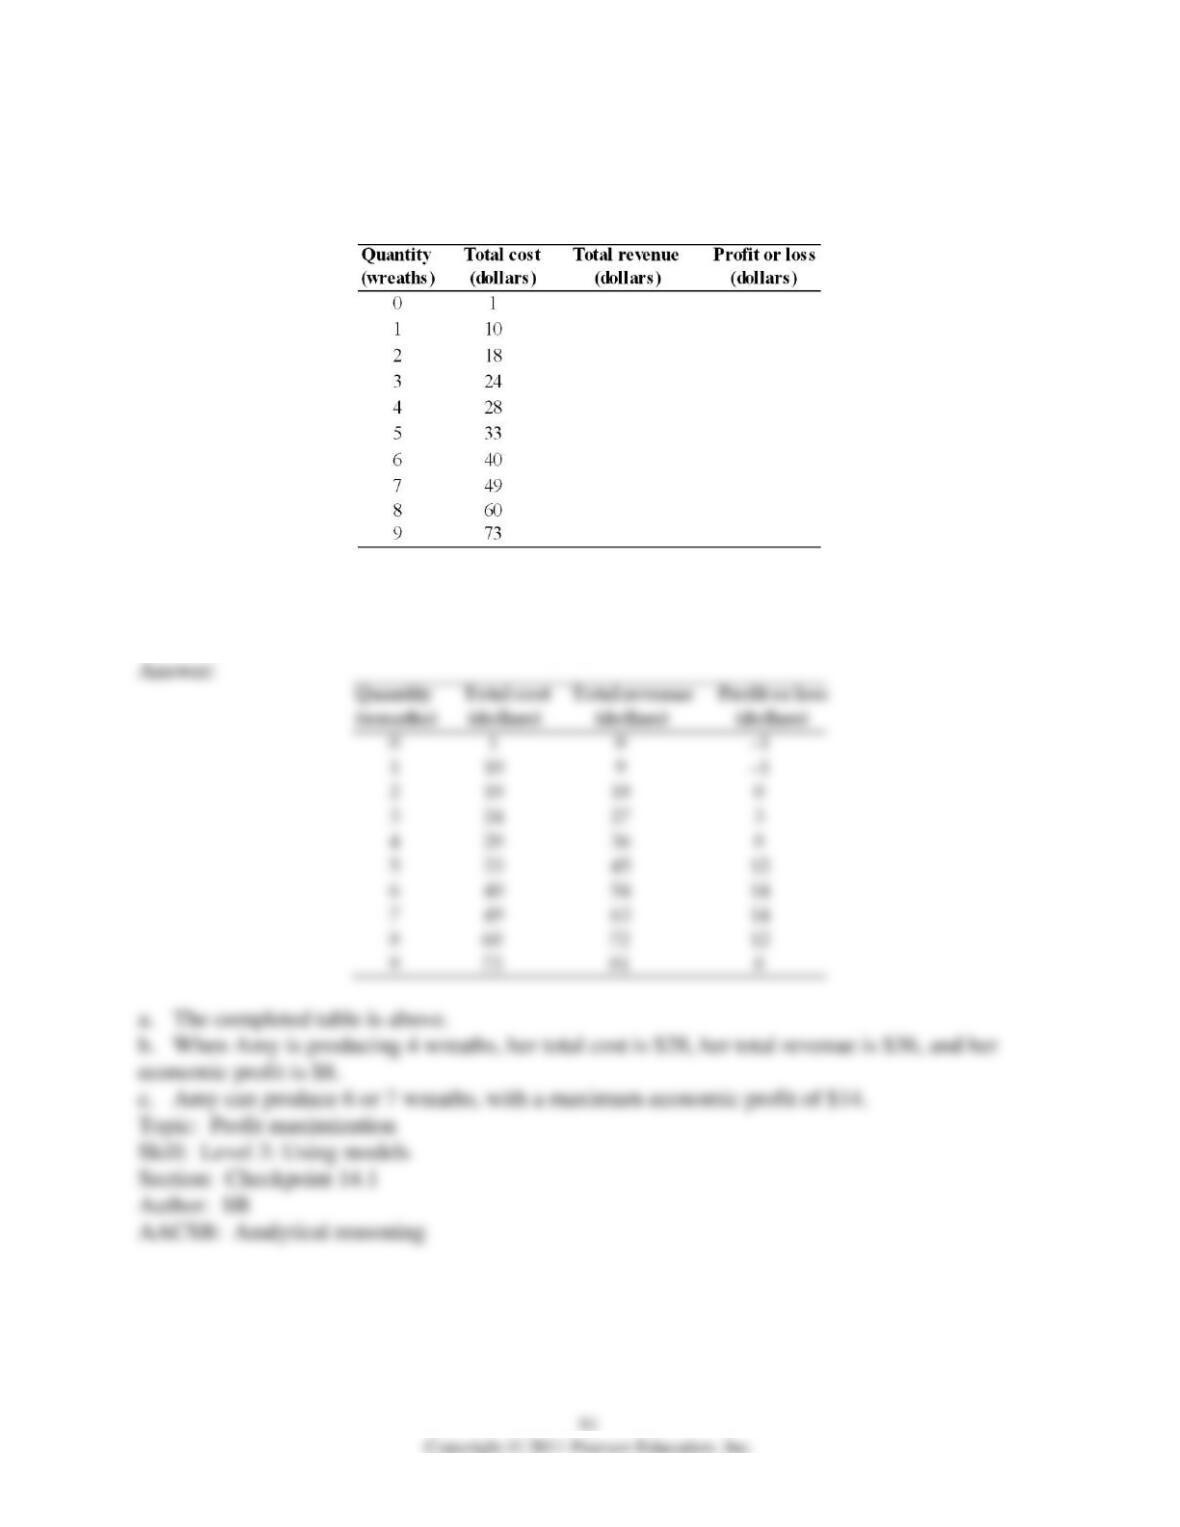
20) The table below gives Amy’s total cost schedule for producing holiday wreaths. Amy is a
perfect competitor and can sell each wreath for $9.
a. Complete the table by calculating Amy’s total revenue and her profit or loss schedule.
b. When Amy is producing 4 wreaths, what is her total cost? What is her total revenue? What is
her economic profit or economic loss?
c. What number of wreaths maximizes Amy’s profit?
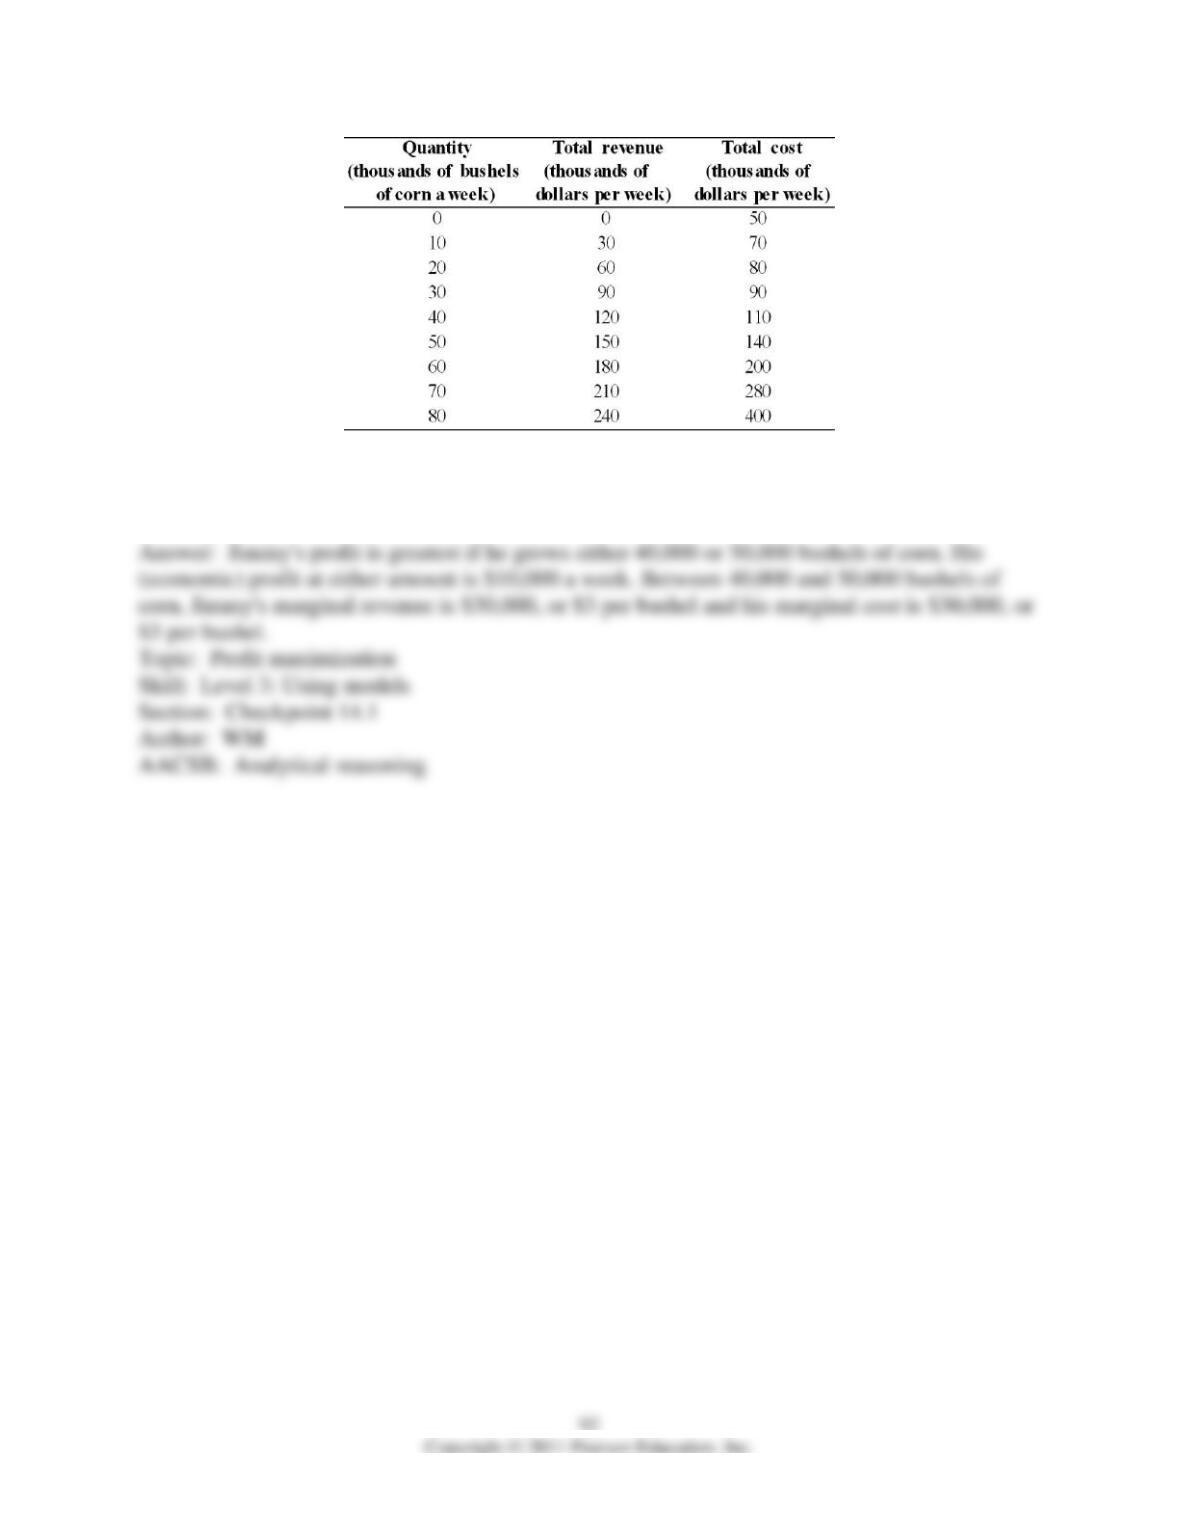
21) Jimmy grows corn. His total revenue and total cost are in the above table. What quantity of
corn maximizes his profit and what is his profit? What is the marginal revenue and marginal cost
at this quantity?
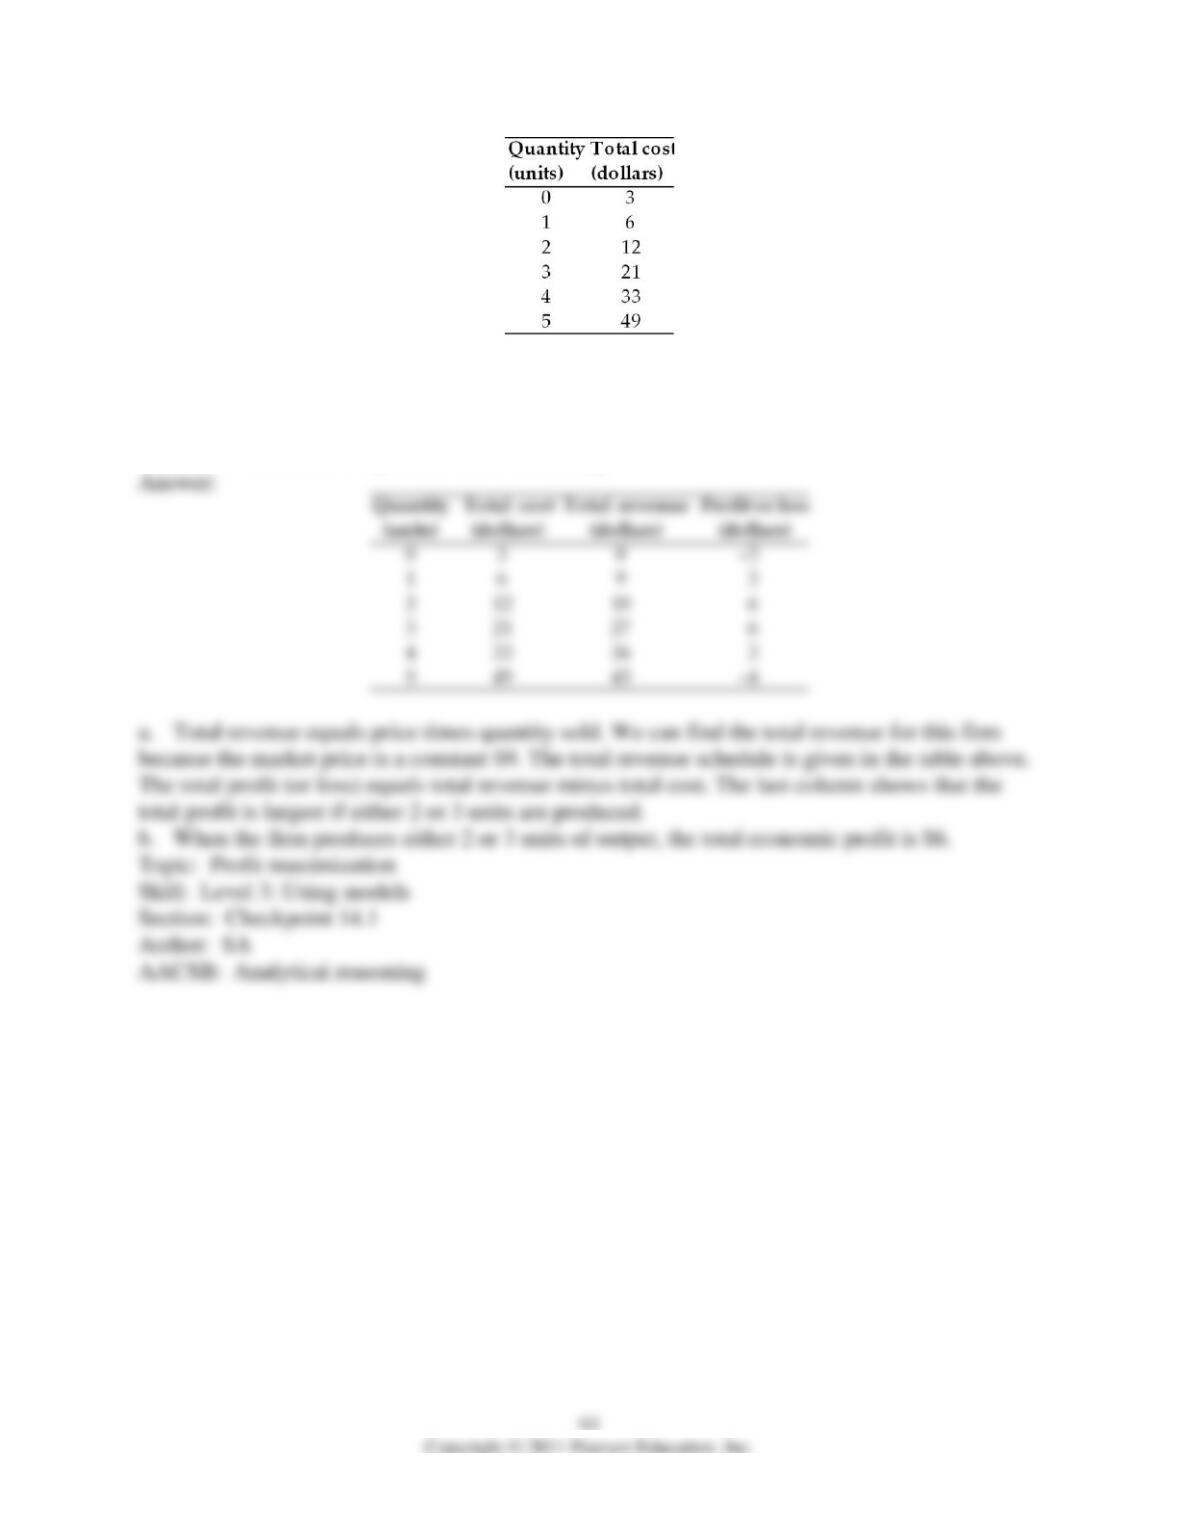
22) The above table gives the quantity of output and the total cost for a perfectly competitive
firm that can sell all of its output at $9 per unit.
a. Find the profit maximizing level of output for this firm.
b. How much economic profit is the firm making?
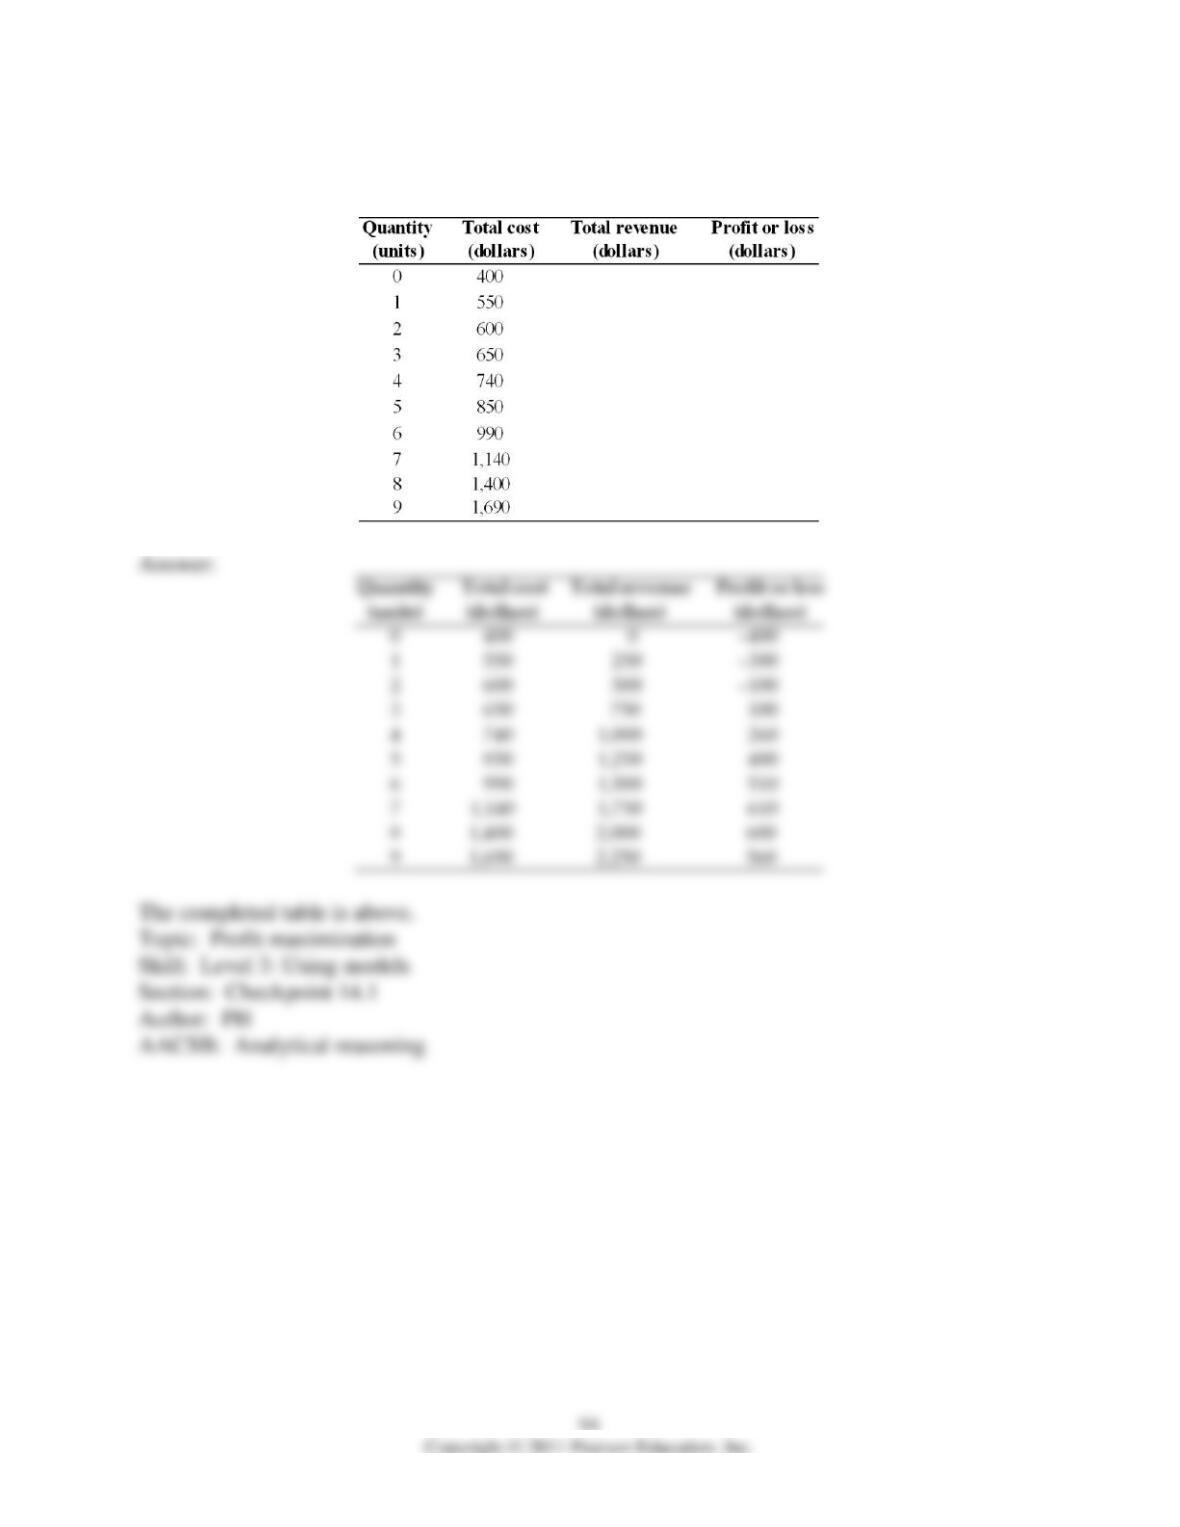
23) The table below shows the total cost schedule for a perfectly competitive firm. The market
price is $250 per unit. Complete the table.