101) During 2008 the supply of gasoline decreased while at the same time the demand for
gasoline increased. If the magnitude of the increase in demand was greater than the magnitude of
the decrease in supply, then the equilibrium price of gasoline ________ and the equilibrium
quantity ________.
A) increased; increased
B) increased; decreased
C) increased; did not change
D) decreased; did not change
E) did not change; increased
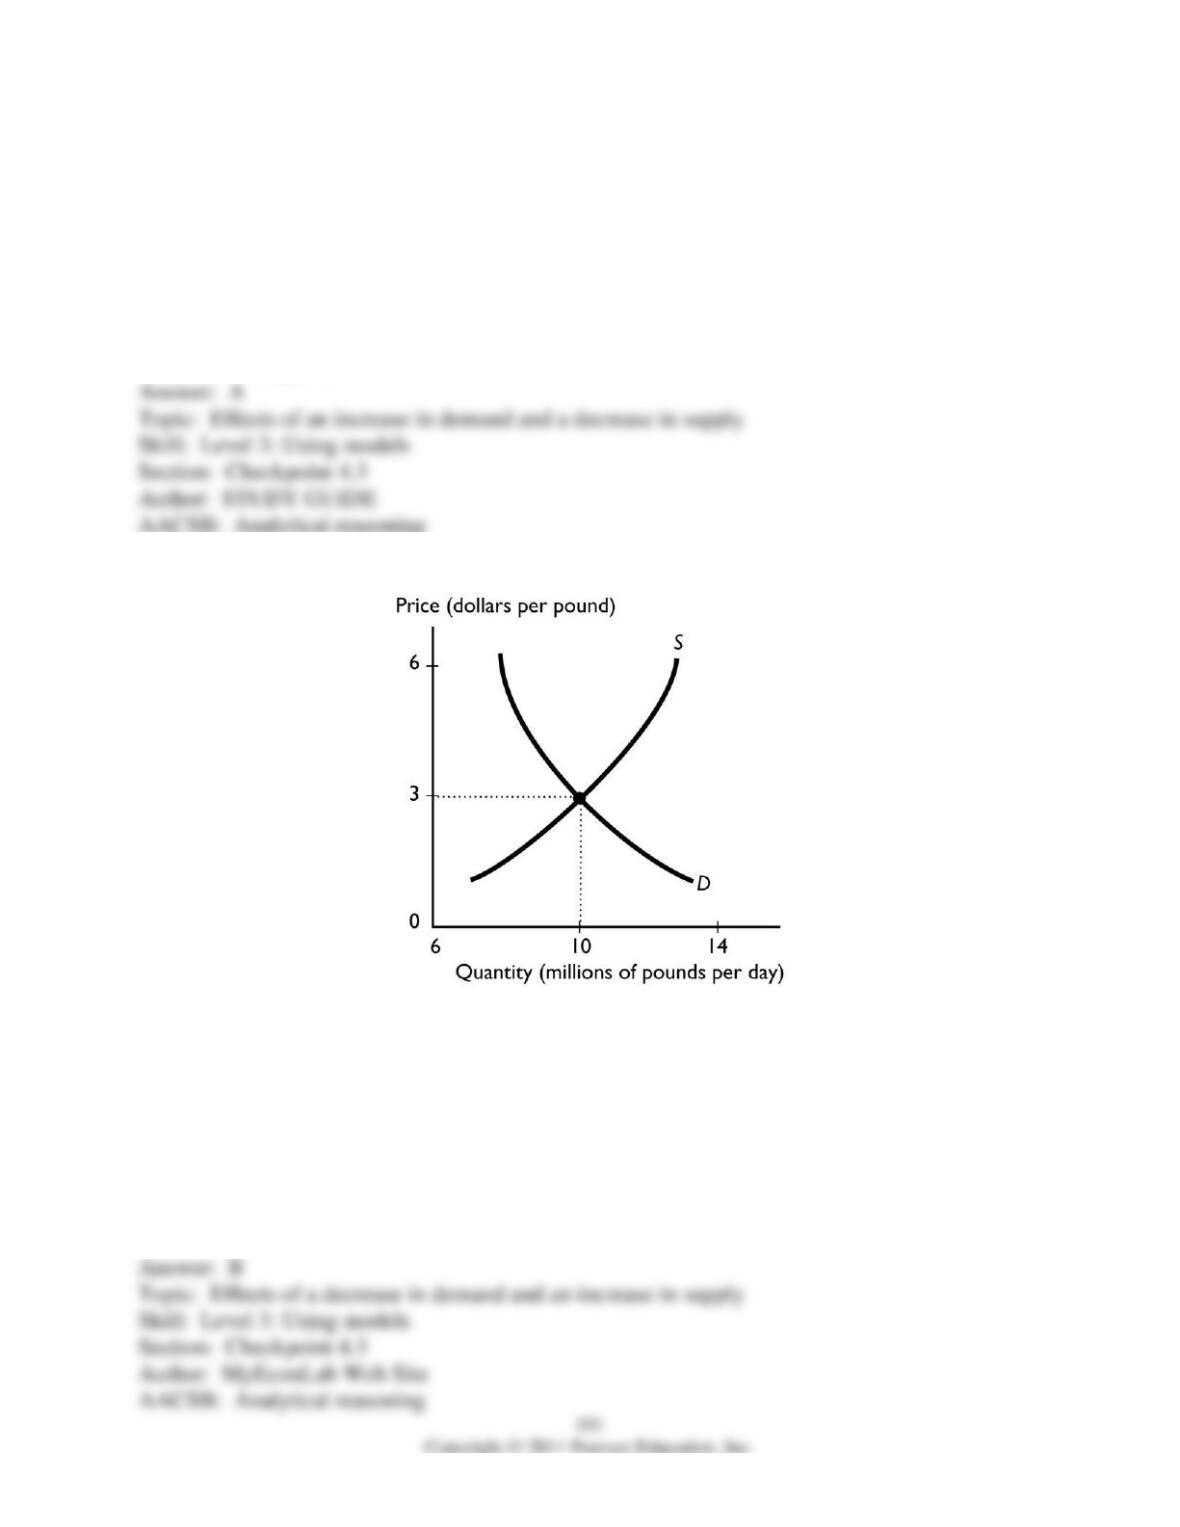
102) The graph illustrates the market for British pounds, the currency of the United Kingdom. As
the number of buyers of pounds decreases and the number of sellers of pounds increases, the
equilibrium price of a pound
A) will rise.
B) will fall
C) will remain the same.
D) might rise, fall, or remain the same but more information is needed.
E) will rise if the magnitude of the effect on the buyers is larger than the magnitude of the effect
on the sellers.
4.4 Integrative Questions
1) Consider the market for bread. If the price of wheat rises, then the
A) demand curve for bread shifts leftward.
B) supply curve of bread shifts leftward.
C) price of bread falls.
D) equilibrium quantity of bread increases.
E) demand curve for bread shifts rightward.
2) Consider the market for turkeys. In the United States, because of Thanksgiving in the month
of November,
A) there is a downward movement along the demand curve for turkeys.
B) there is an upward movement along the supply curve for turkeys.
C) the supply curve of turkeys shifts leftward.
D) the demand curve for turkeys shifts leftward.
E) neither the demand curve nor the supply curve shift; instead there is a movement along both
curves.
3) Consider the market for feather pillows. If there is an increase in the price of feather dusters, a
substitute in production for feather pillows, then
A) the price of feather pillows decreases.
B) the demand curve for feather pillows shifts leftward.
C) the supply curve for feather pillows shifts leftward.
D) there is a downward movement along the demand curve for feather pillows.
E) the demand curve for feather pillows shifts rightward.

4) Consider the market for peanut butter. If there is an increase in the price of peanuts,
A) there is an upward movement along the supply curve for peanut butter.
B) the supply curve for peanuts shifts rightward.
C) there is a decrease in the supply of peanuts.
D) there is a decrease in the supply of peanut butter.
E) there is a decrease in the demand for peanut butter.
5) Peanut butter and jelly are complements for many consumers. Consider the market for peanut
butter. If there is an increase in the price of jelly,
A) there is a movement along the supply curve of peanut butter.
B) the price of peanut butter rises.
C) the quantity of peanut butter increases.
D) there is a shift in the supply curve for jelly.
E) the demand curve for peanut butter does not shift; instead there is a movement along it.
6) Consider the market for wheat. If there is an improvement in harvesting technology,
A) the supply curve for wheat shifts rightward.
B) the demand curve for wheat shifts rightward.
C) there is a movement up along the demand curve.
D) the equilibrium price rises.
E) the demand curve for wheat shifts leftward.

7) Consider the market for camera film. If more people start using digital cameras, which do not
require film,
A) the supply curve of film shifts rightward.
B) the demand curve for film shifts leftward.
C) there is a movement up along the demand curve for film.
D) there is a movement down along the demand curve for film.
E) neither the demand curve nor the supply curve for film shifts; instead there is a movement
along both.
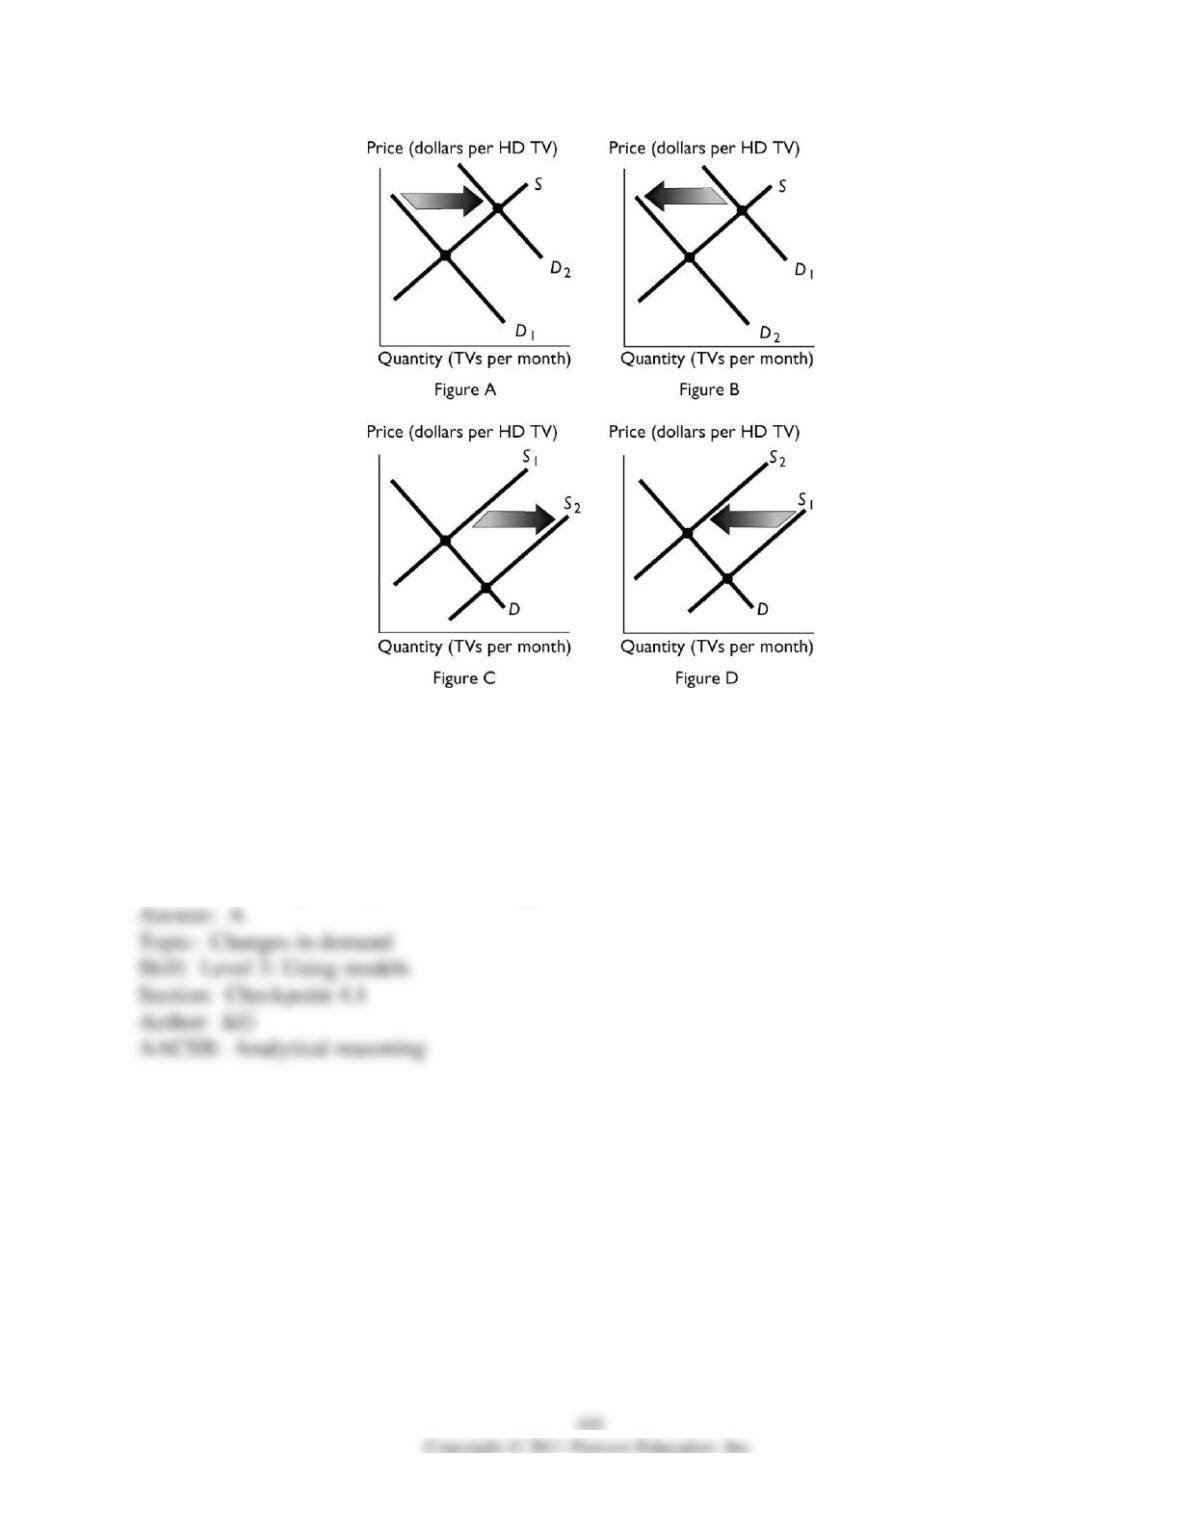
8) The above figures show the market for HD televisions. If people’s incomes increase and HD
televisions are a normal good, which figure shows the effect of this change?
A) Figure A
B) Figure B
C) Figure C
D) Figure D
E) None of the figures represent this change.

9) The above figures show the market for HD televisions. Blu-ray players can be used to play
HD movies. If the price of blu-ray players falls, then which figure shows the effect of this change
in the market for HD televisions?
A) Figure A
B) Figure B
C) Figure C
D) Figure D
E) None of the figures represent this change.
10) The above figures show the market for HD televisions. If research is published showing that
watching HD television shows causes eye damage, then which figure shows the effect of this
change?
A) Figure A
B) Figure B
C) Figure C
D) Figure C
E) None of the figures represent this change.
11) The above figures show the market for HD televisions. If cable television providers lower
the price of providing HD cable service, which figure shows the effect of this change ?
A) Figure A
B) Figure B
C) Figure C
D) Figure D
E) None of the figures represent this change.
12) The above figures show the market for HD televisions. If the price of the LCD screens used
to produce these televisions falls, which figure shows the effect of this change in price?
A) Figure A
B) Figure B
C) Figure C
D) Figure D
E) None of the figures represent this change.
13) The above figures show the market for HD televisions. If there are severe earthquakes that
destroy a significant number of of HD television manufacturing plants, which figure shows the
effect of the earthquake?
A) Figure A
B) Figure B
C) Figure C
D) Figure D
E) None of the figures represent this change.
14) The above figures show the market for HD televisions. If more firms start to produce HD
televisions , which figure shows the effect of this change?
A) Figure A
B) Figure B
C) Figure C
D) Figure D
E) None of the figures represent this change.

15) The above figures show the market for HD televisions. If the technology used to produce
these televisions advances so that productivity increases, which figure shows the effect of this
change?
A) Figure A
B) Figure B
C) Figure C
D) Figure D
E) None of the figures represent this change.
16) Consider the market for leather shoes. If producers believe the price of leather shoes will
increase next month, today
A) the supply curve for leather shoes shifts rightward.
B) the supply curve for leather shoes shifts leftward.
C) there is a movement along the supply curve for leather shoes.
D) the equilibrium price of leather shoes falls.
E) the equilibrium quantity of leather shoes increases.
17) Consider the market for peanut butter. If there is an increase in the price of bread (a
complement for peanut butter) along with a drought in peanut growing areas, the
A) equilibrium quantity of bread increases.
B) equilibrium quantity of peanut butter definitely decreases.
C) equilibrium quantity of peanut butter might increase or might decrease.
D) equilibrium price of peanut butter definitely rises.
E) equilibrium price of peanut butter definitely falls.
18) Consider the market for peanut butter. If there is a decrease in the price of deli turkey slices
(a substitute in consumption for peanut butter) along with a decrease in the price of peanut brittle
(a substitute in production for peanut butter), the
A) equilibrium price of peanut butter definitely falls.
B) equilibrium quantity of peanut definitely decreases.
C) equilibrium price of peanut butter might rise or fall.
D) equilibrium quantity of peanut butter definitely increases.
E) equilibrium price of peanut butter definitely rises.
19) Millions of people from Mexico have migrated to the United States. This has reduced the
supply of labor in Mexico and increased the supply of labor in the United States. Assume that
the demand for labor in Mexico and the United States is unchanged. Then wages in the United
States ________ and wages in Mexico ________.
A) fall; rise
B) rise; rise
C) rise; do not change
D) fall; fall
E) do not change; fall
1) What is the law of demand?
2) What leads to a decrease in the quantity demanded of a good or service?
3) Explain the difference between a change in demand and a change in quantity demanded. What
leads to each of these changes?
4) List the factors change demand and shift the demand curve. Tell what happens to demand and
the demand curve when there is an increase in the factor.
5) Computers are a complement to computer software. Suppose the price of a computer falls.
How does this fall in price affect the demand for computer software and the demand curve for
computer software?
6) What is the difference between a normal good and an inferior good. Give an example of each.
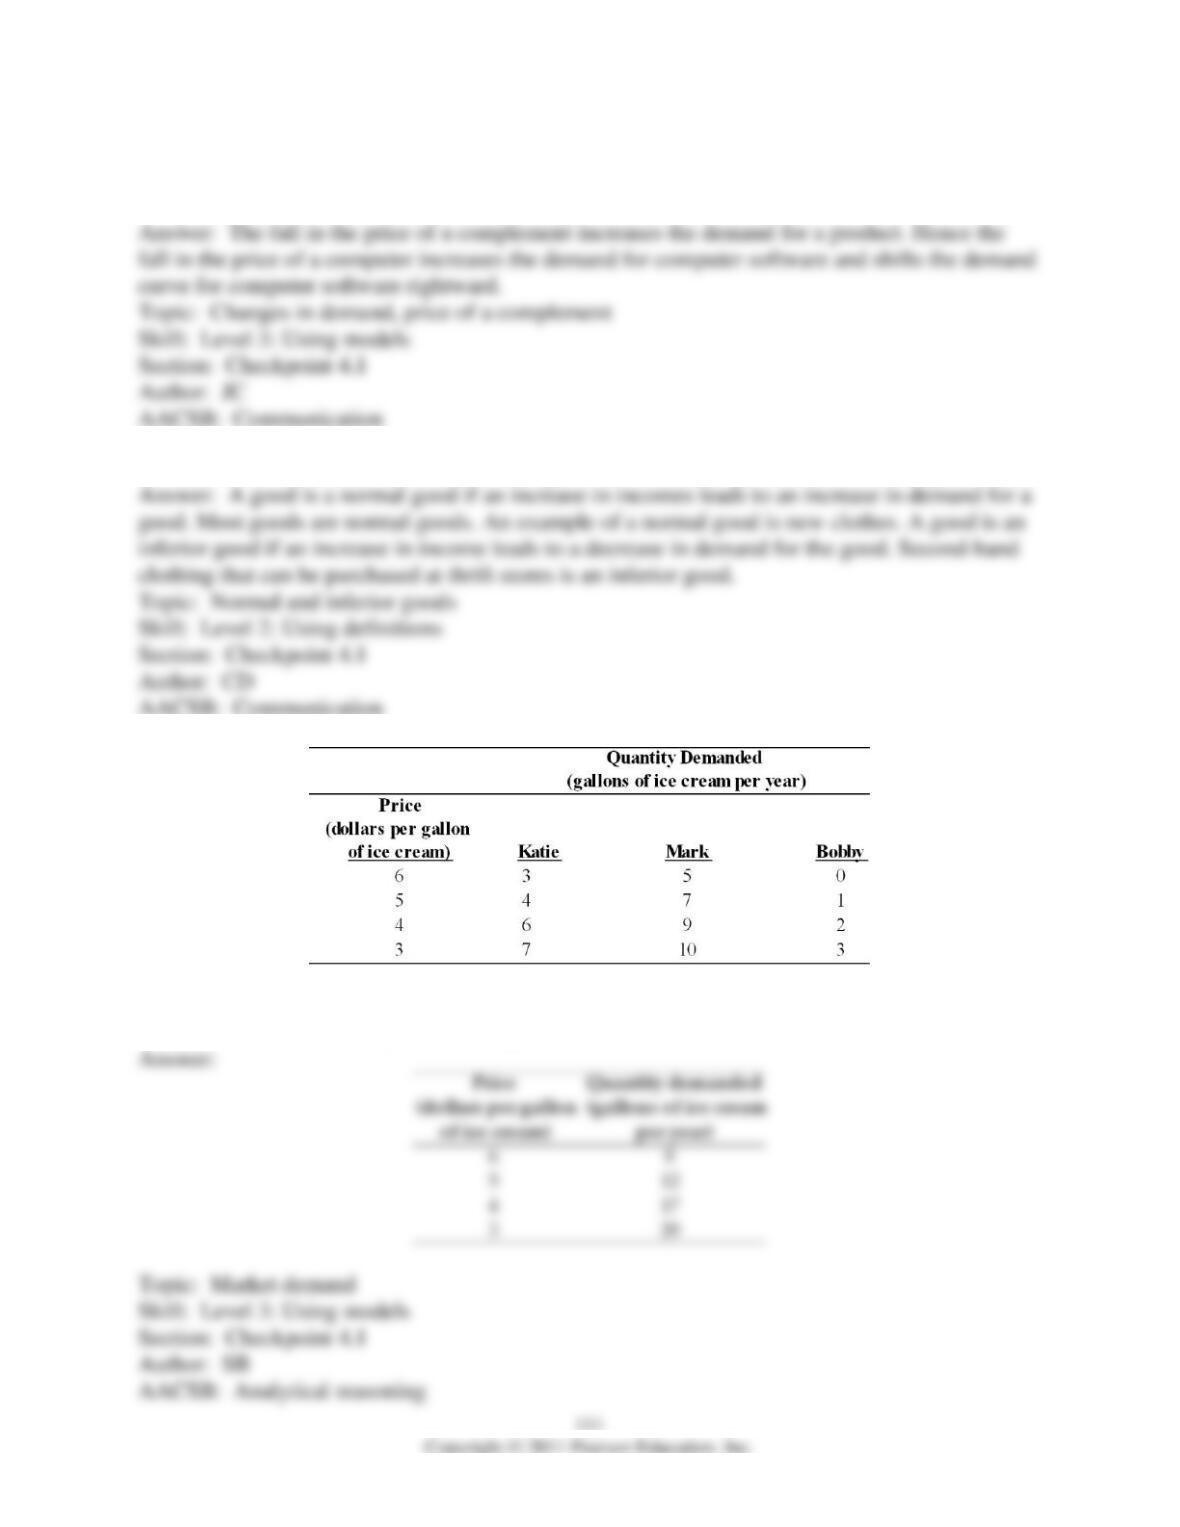
7) Suppose Katie, Mark, and Bobby are the only consumers in the market for ice cream. Using
the demand schedules in the table above, what is the market demand curve for ice cream?
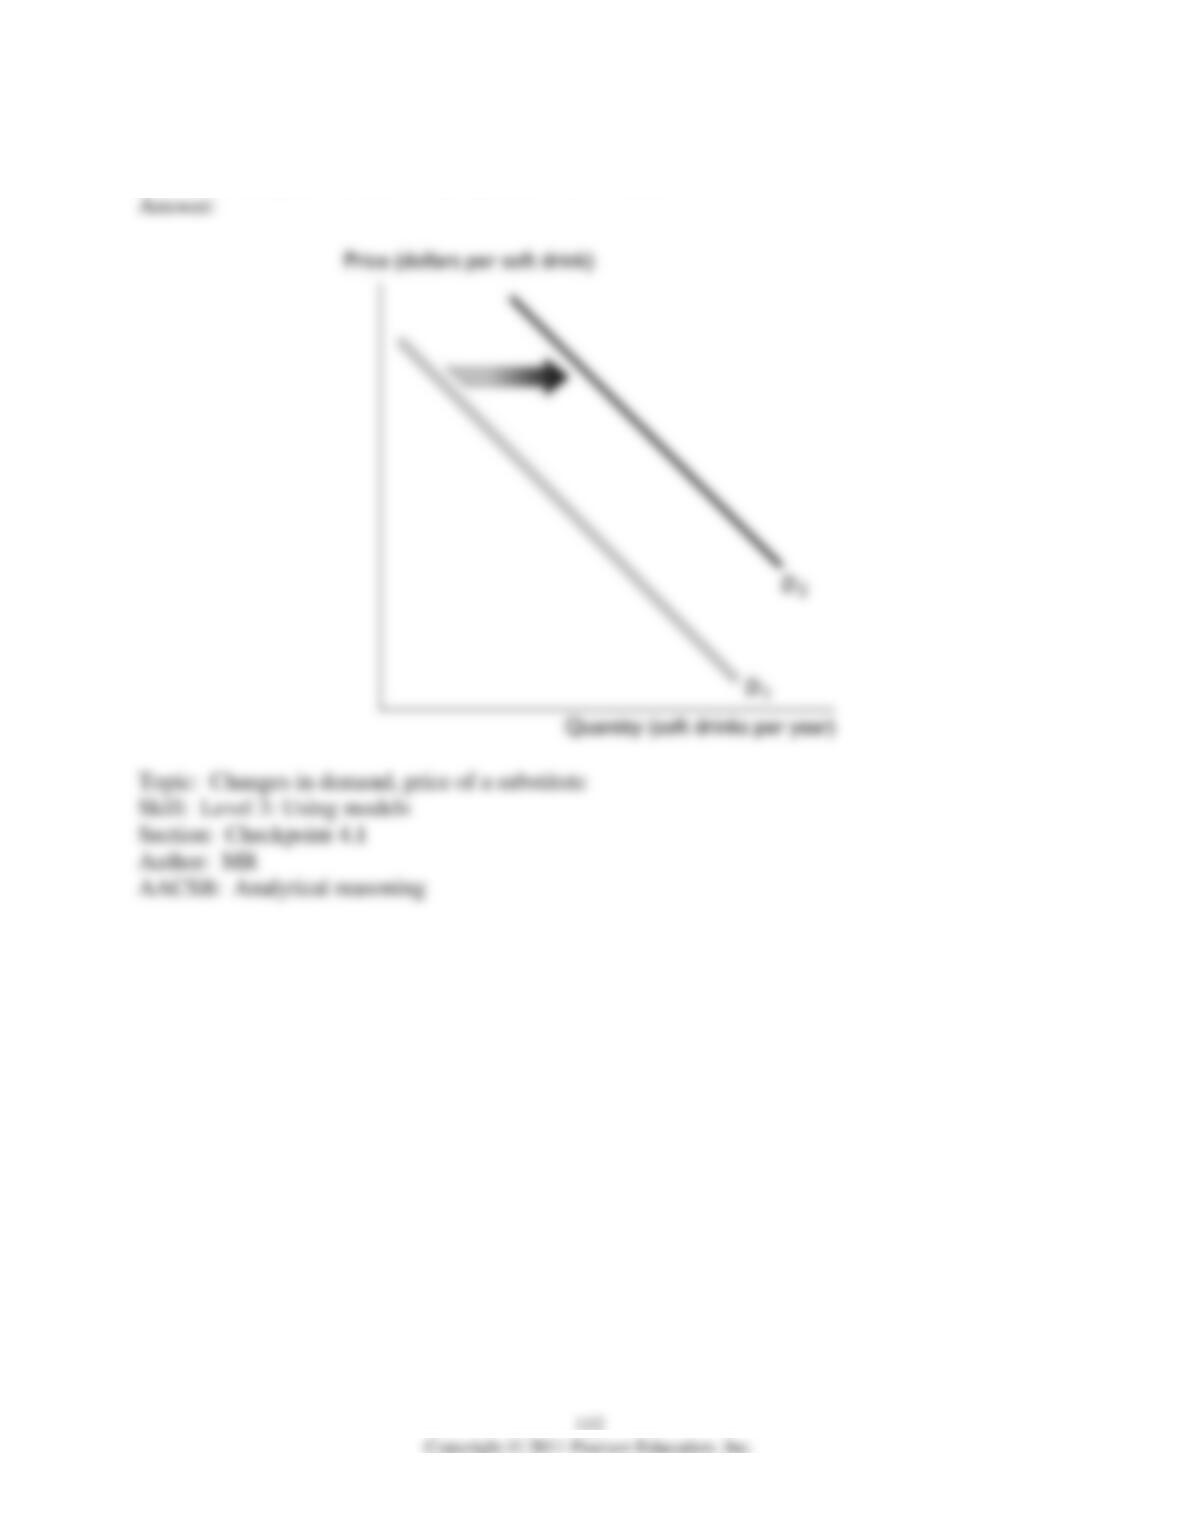
8) Soft drinks and milk are substitutes for consumers. Draw a graph showing the effect of an
increase in the price of milk on the demand for soft drinks.