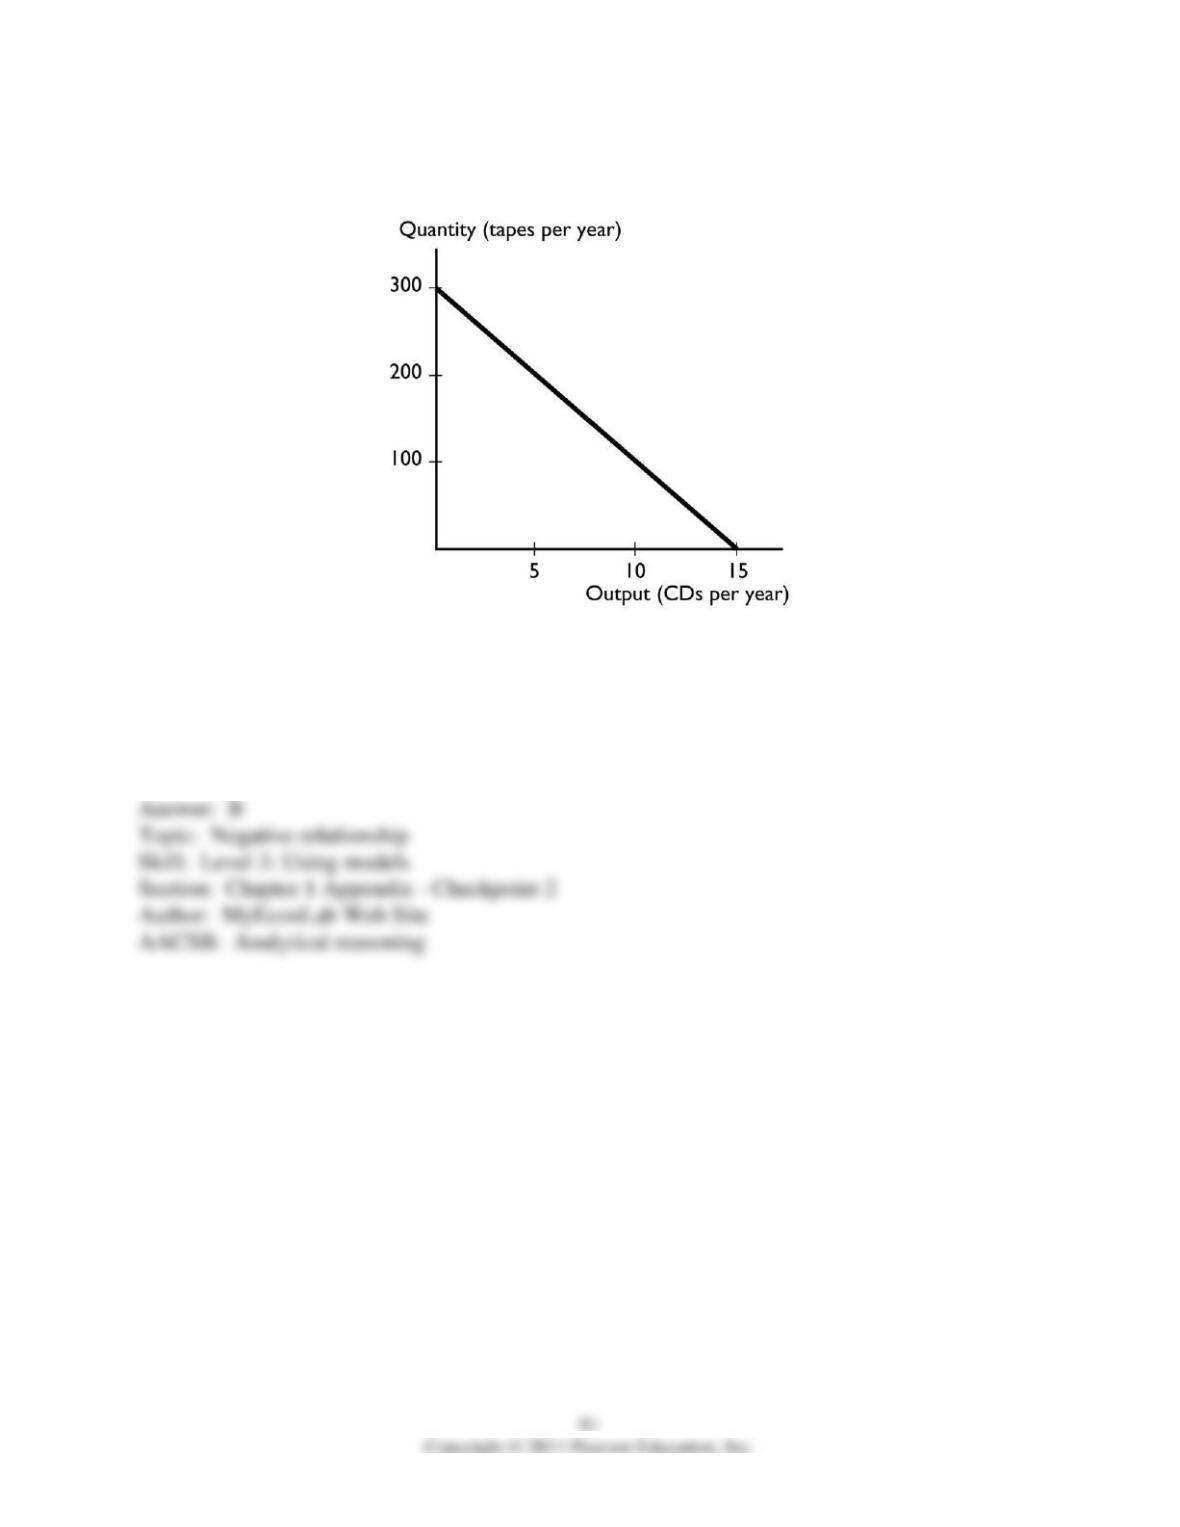
72) The graph shows a
A) positive relationship that becomes less steep.
B) negative relationship that is linear.
C) positive relationship that is linear.
D) negative relationship that become less steep.
E) None of the above answers is correct.
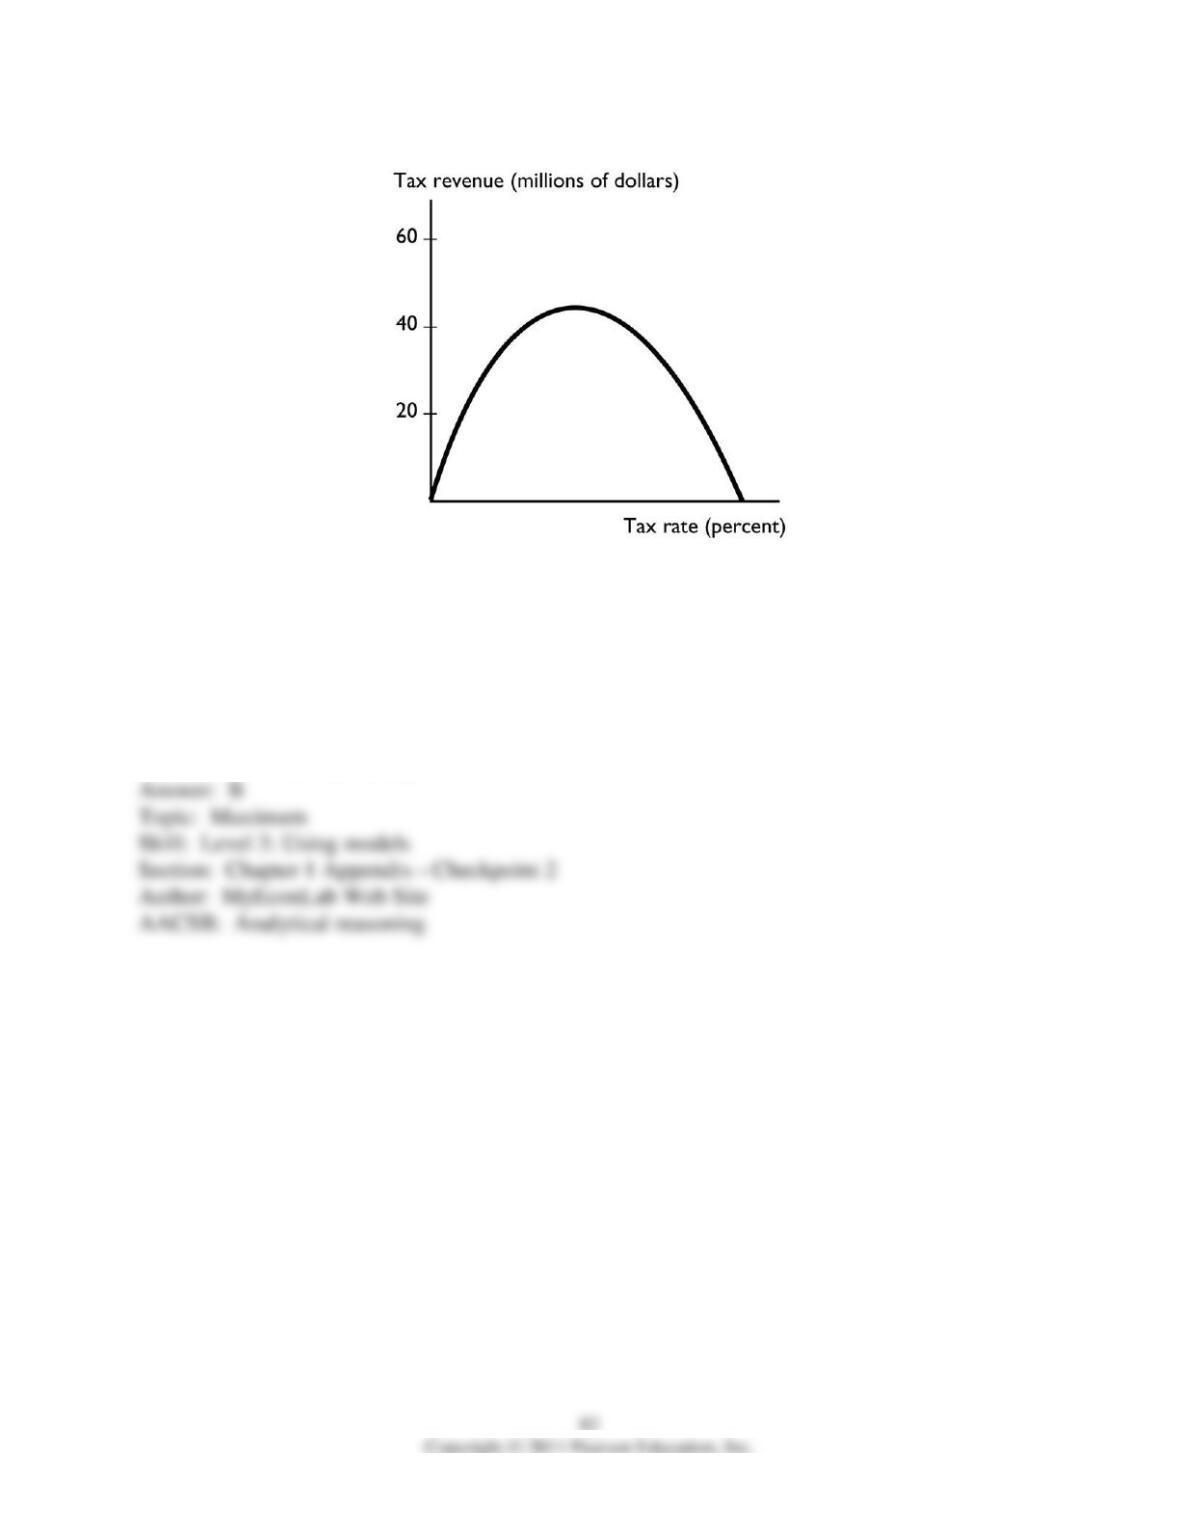
73) The graph shows
A) a relationship with a minimum.
B) a relationship with a maximum.
C) no relationship.
D) a linear relationship.
E) a cross-section relationship.
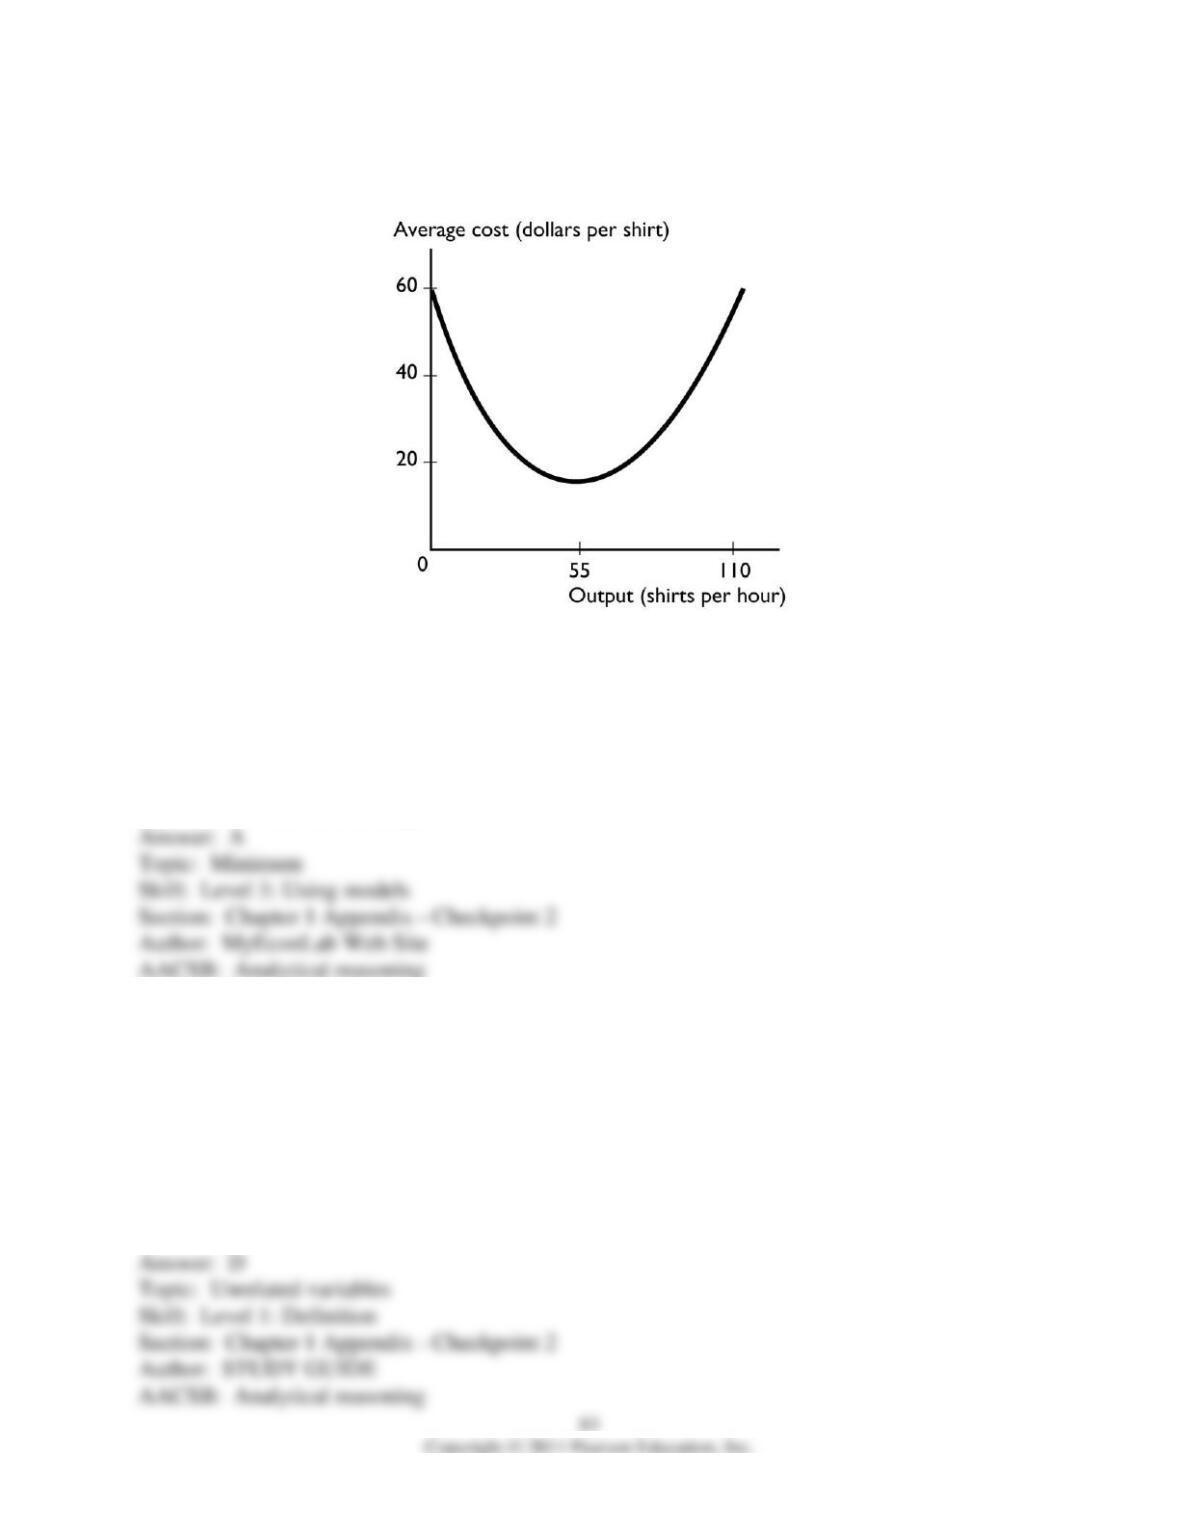
74) The graph shows
A) a relationship with a minimum.
B) a relationship with a maximum.
C) no relationship.
D) a relationship that becomes less steep.
E) a cross-section relationship.
75) Two variables are unrelated if their graph is
i. a vertical line
ii. a 45 degree line
iii. a horizontal line
A) i only.
B) ii only.
C) iii only.
D) i and iii.
E) i, ii, and iii.
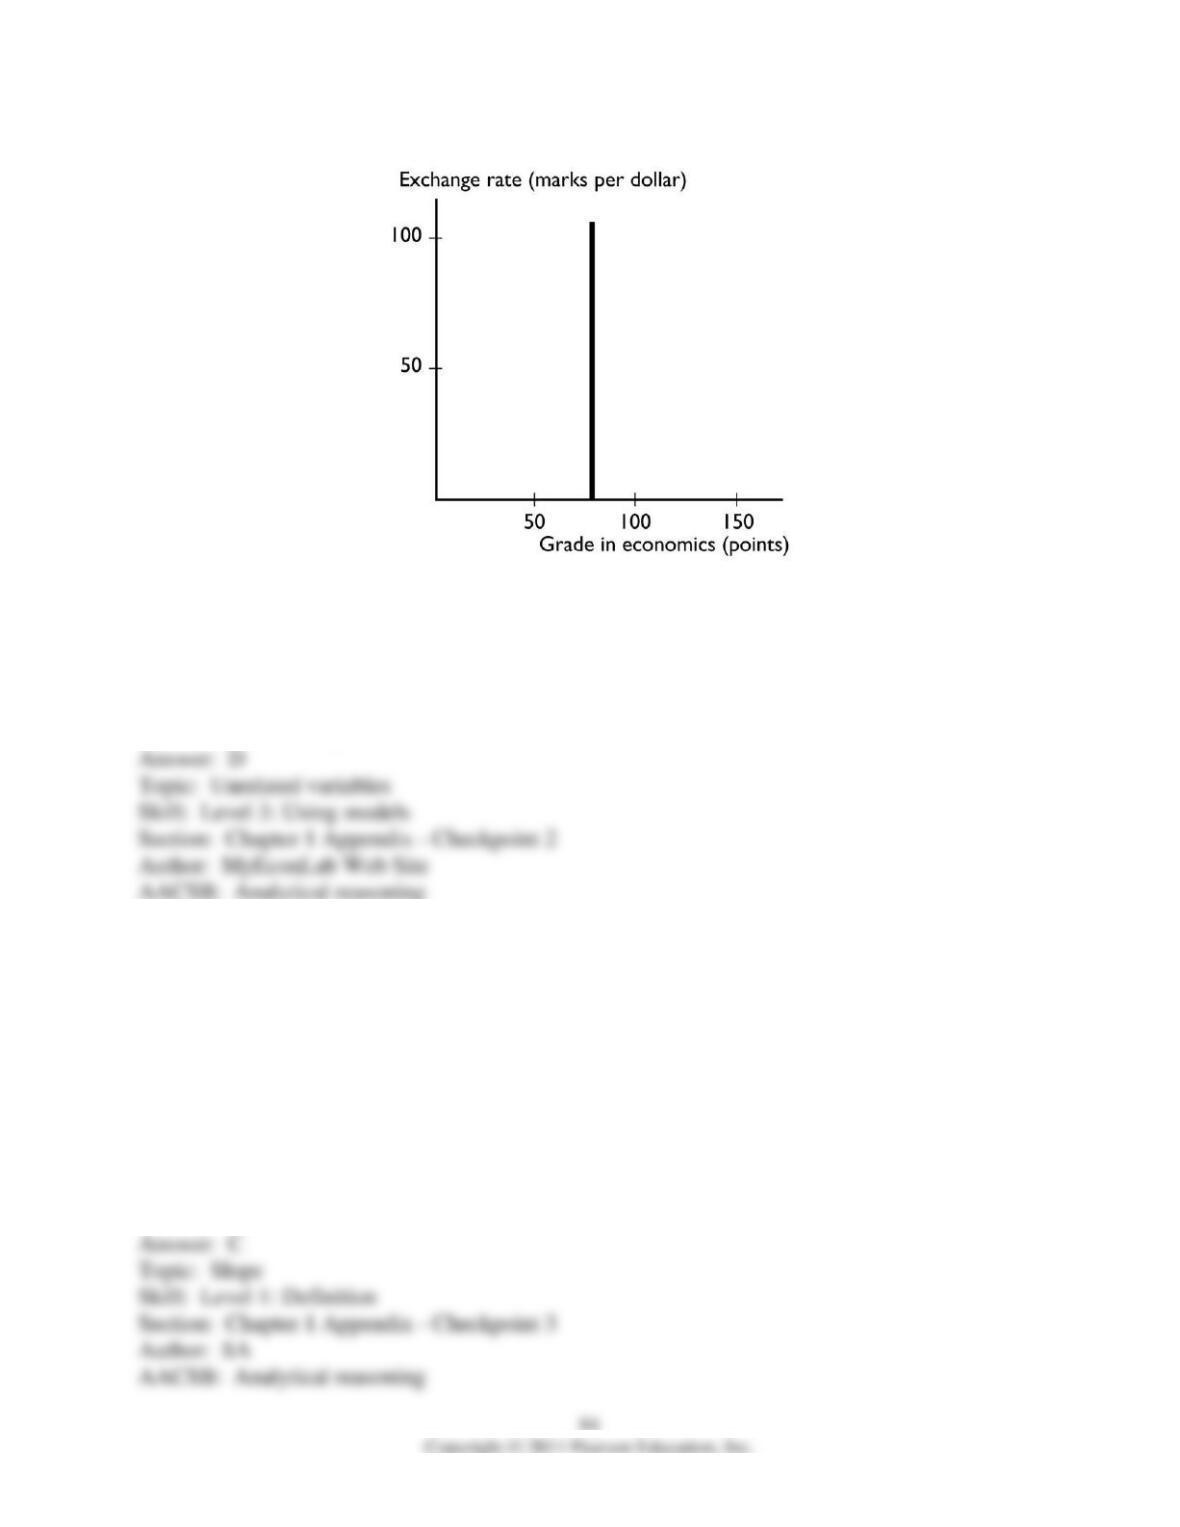
76) The graph shows
A) positive relationship that becomes less steep.
B) negative relationship that is linear.
C) positive relationship that is linear.
D) no relationship between the variables.
E) a trend relationship between the variables.
77) A slope is measured as the
A) value of the variable measured on the y-axis divided by the value of the variable measured on
the x-axis.
B) value of the variable measured on the x-axis divided by the value of the variable measured on
the y-axis.
C) change in the value of variable on the y-axis divided by the change in the value of the variable
on the x-axis.
D) value of the variable measured on the y-axis minus the value of the variable measured on the
x-axis.
E) change in the value of variable on the x-axis divided by the change in the value of the variable
on the y-axis.
78) A slope is measured as the
A) value of the variable measured on the y-axis divided by the value of the variable measured on
the x-axis.
B) value of the variable measured on the x-axis divided by the value of the variable measured on
the y-axis.
C) change in the value of variable on the y-axis divided by the change in the value of the variable
on the x-axis.
D) value of the variable measured on the y-axis minus the value of the variable measured on the
x-axis.
E) value of the variable measured on the x-axis minus the value of the variable measured on the
y-axis.
79) “The change in the value of the variable measured on the y-axis divided by the change in the
value of the variable measured on the x-axis” is the definition of
A) a graph.
B) slope.
C) a curve.
D) a relationship.
E) a trend.
80) The slope of a line equals the change in the variable measured along the
A) x-axis divided by the change in the variable measured along the y-axis.
B) y-axis divided by the change in the variable measured along the x-axis.
C) x-axis minus the change in the variable measured along the y-axis.
D) x-axis multiplied by the change in the variable measured along the y-axis.
E) y-axis minus the change in the variable measured along the x-axis.
81) The slope
A) of a straight line is the same regardless of where on the line it is calculated.
B) equals the change in the value of the variable measured on the x-axis divided by the change in
the variable measured on the y-axis.
C) will be small if a large change in the variable measured on the y-axis is associated with a
small change in the variable measured on the x-axis.
D) equals the change in the value of the variable measured on the y-axis minus the change in the
variable measured on the x-axis.
E) falls as the x variable increases if the line has a negative slope.
82) With y measured on the vertical axis and x measured on the horizontal axis, the slope of a
straight line is defined as
A) y/x.
B) x/y.
C) (change in y)/(change in x).
D) (change in x)/(change in y).
E) y – x.
83) In a graph, a straight line has a negative slope if the line
A) is vertical.
B) is horizontal.
C) falls from left to right.
D) rises from left to right.
E) shows a trend.
84) A curve with a positive but decreasing slope represents a relationship where, every time the
variable measured along the horizontal axis increases by one unit, the variable measured along
the vertical axis
A) increases by a constant amount.
B) increases by an increasing amount.
C) increases by a decreasing amount.
D) decreases.
E) does not change by much.
85) The slope
A) of a straight line is the same regardless of where on the line it is calculated.
B) equals the change in the value of the variable measured on the vertical axis divided by the
change in the variable measured along the horizontal axis.
C) will be small if a large change in the variable measured on the vertical axis is associated with
a small change in the variable measured along the horizontal axis.
D) Answers A and B are correct.
E) Answers A and C are correct.
86) Which of the following statements is correct?
A) The slope of a straight line changes depending where on the line it is calculated.
B) The slope of a curved line is not defined because it is impossible to calculate the slope along a
curved line.
C) A straight line that slopes upward moving to the right has a positive slope.
D) Answers A and B are correct.
E) Answers A and C are correct.
87) If a small change in the x variable results in a large change in the y variable, the curve will be
A) positively sloped.
B) negatively sloped.
C) steep.
D) flat.
E) trended.
88) Suppose the relationship between a person’s age and his or her height is plotted with the age
measured along the x-axis and the height measured along the y-axis. Then, the curve showing
this relationship is
A) a straight line with a positive slope.
B) positively sloped and becoming less steep.
C) a straight line with a negative slope.
D) negatively sloped and becoming less steep.
E) positively sloped and becoming more steep.
89) If the quantity of the variable on the y-axis increases by 10 when the quantity of the variable
on the x-axis decreases by 2, then the slope of the curve equals
A) 2.
B) -10.
C) 10.
D) -5.
E) None of the above answers are correct.
90) If the quantity of the variable on the y-axis increases by 3 when the quantity of the variable
on the x-axis increases by 4, then the slope of the curve equals
A) 3.
B) 4.
C) 3/4.
D) 4/3.
E) 1.
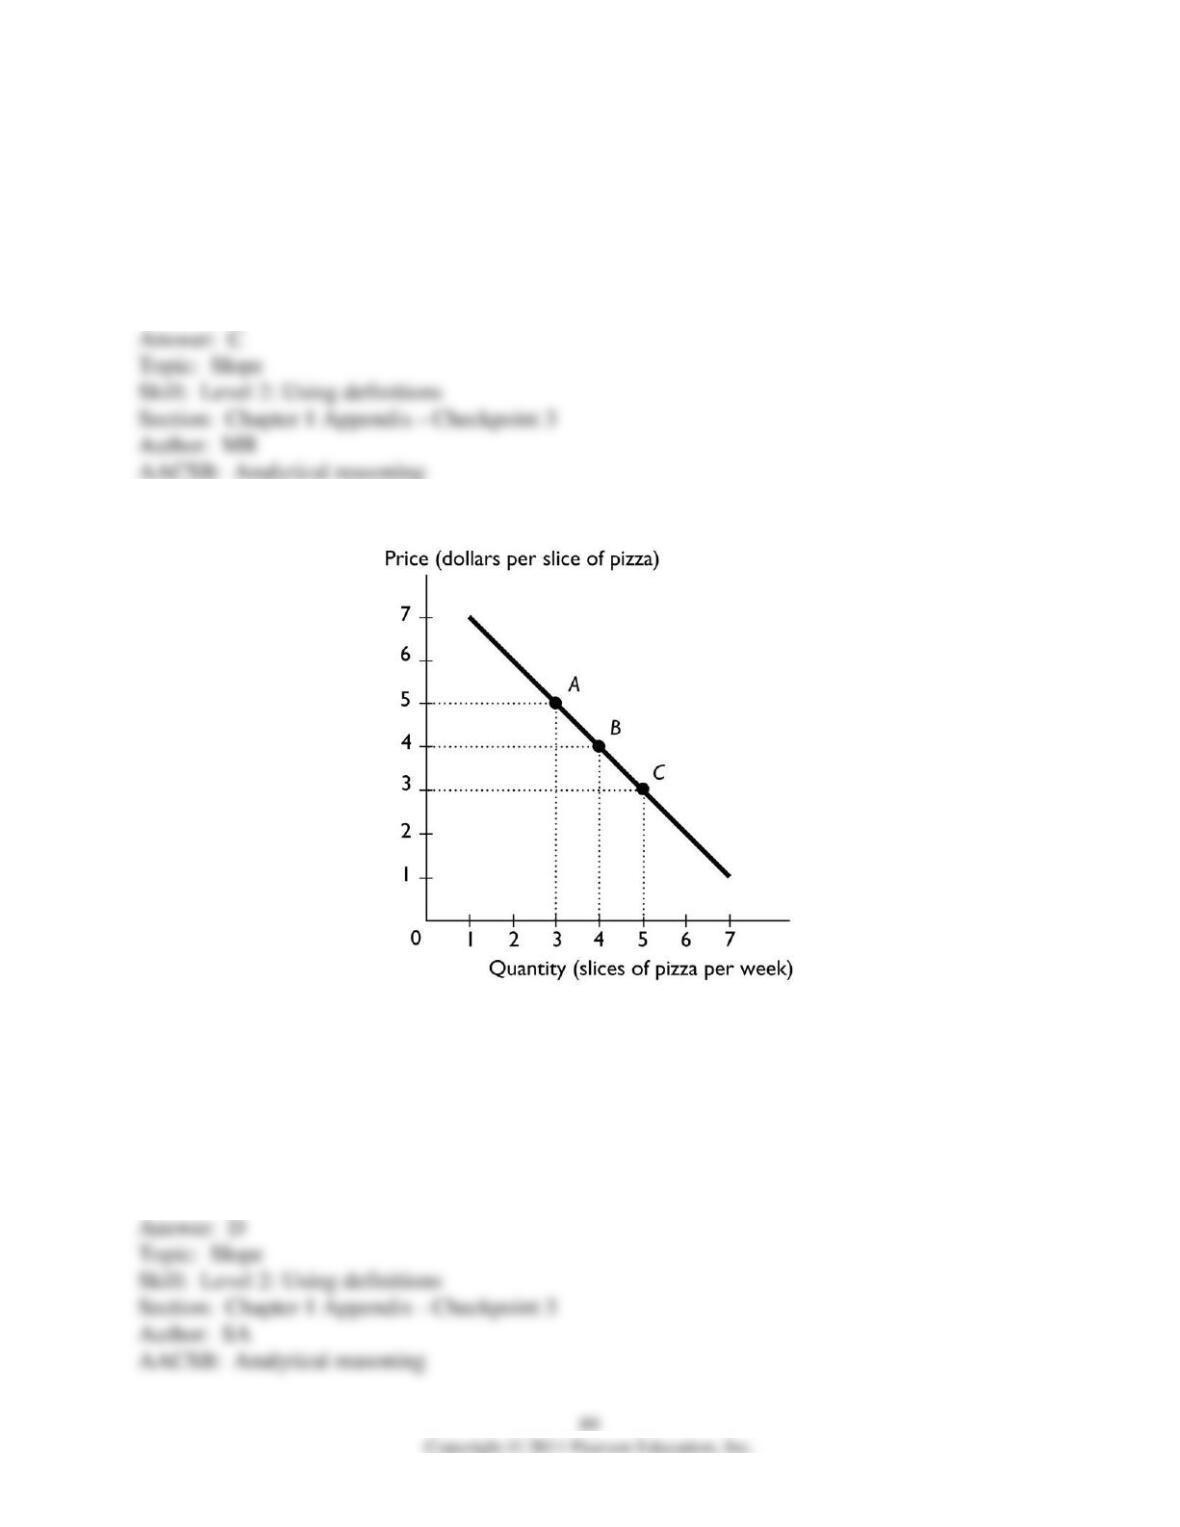
91) The above figure shows the relationship between the price of a slice of pizza and how many
slices of pizza Ricardo buys in a week. Between points A and B, the slope of the line equals
A) -5.
B) -4.
C) -3.
D) -1.
E) -2
92) The above figure shows the relationship between the price of a slice of pizza and how many
slices of pizza Ricardo buys in a week. Between points A and B, the slope of the line is ________
the slope of the line between points B and C.
A) greater than
B) equal to
C) less than
D) unrelated to
E) not comparable to
93) Moving rightward along a straight line, the slope of the line
A) always increases.
B) always decreases.
C) stays the same.
D) increases if the line slopes upward to the right.
E) decreases if the line slopes downward to the right.
94) A straight line falls when moving rightward along it. Hence the slope of the line is
A) positive.
B) negative.
C) undefined.
D) zero because it is a straight line.
E) perhaps positive, negative, or zero, but without more information it is impossible to
determine.
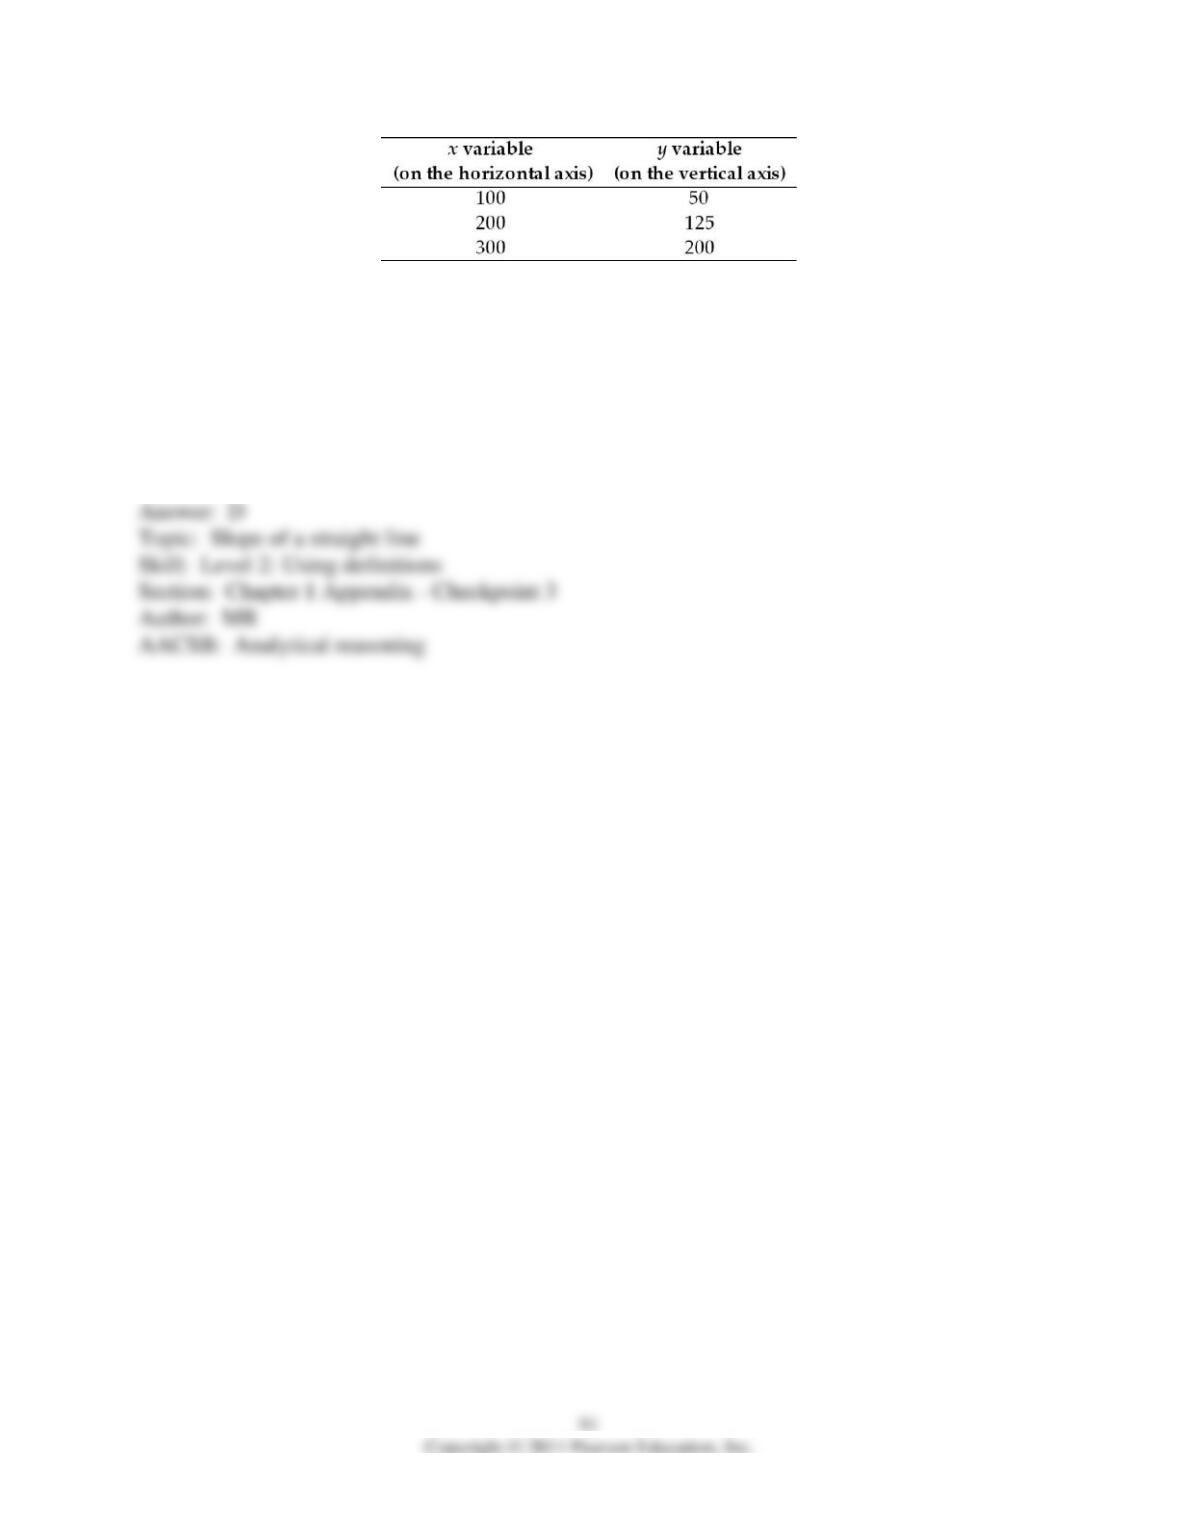
95) The table above shows data on two variables. If these data were graphed, the slope of the line
would be
A) 1/2.
B) 4/3.
C) 2/3.
D) 3/4.
E) 2.
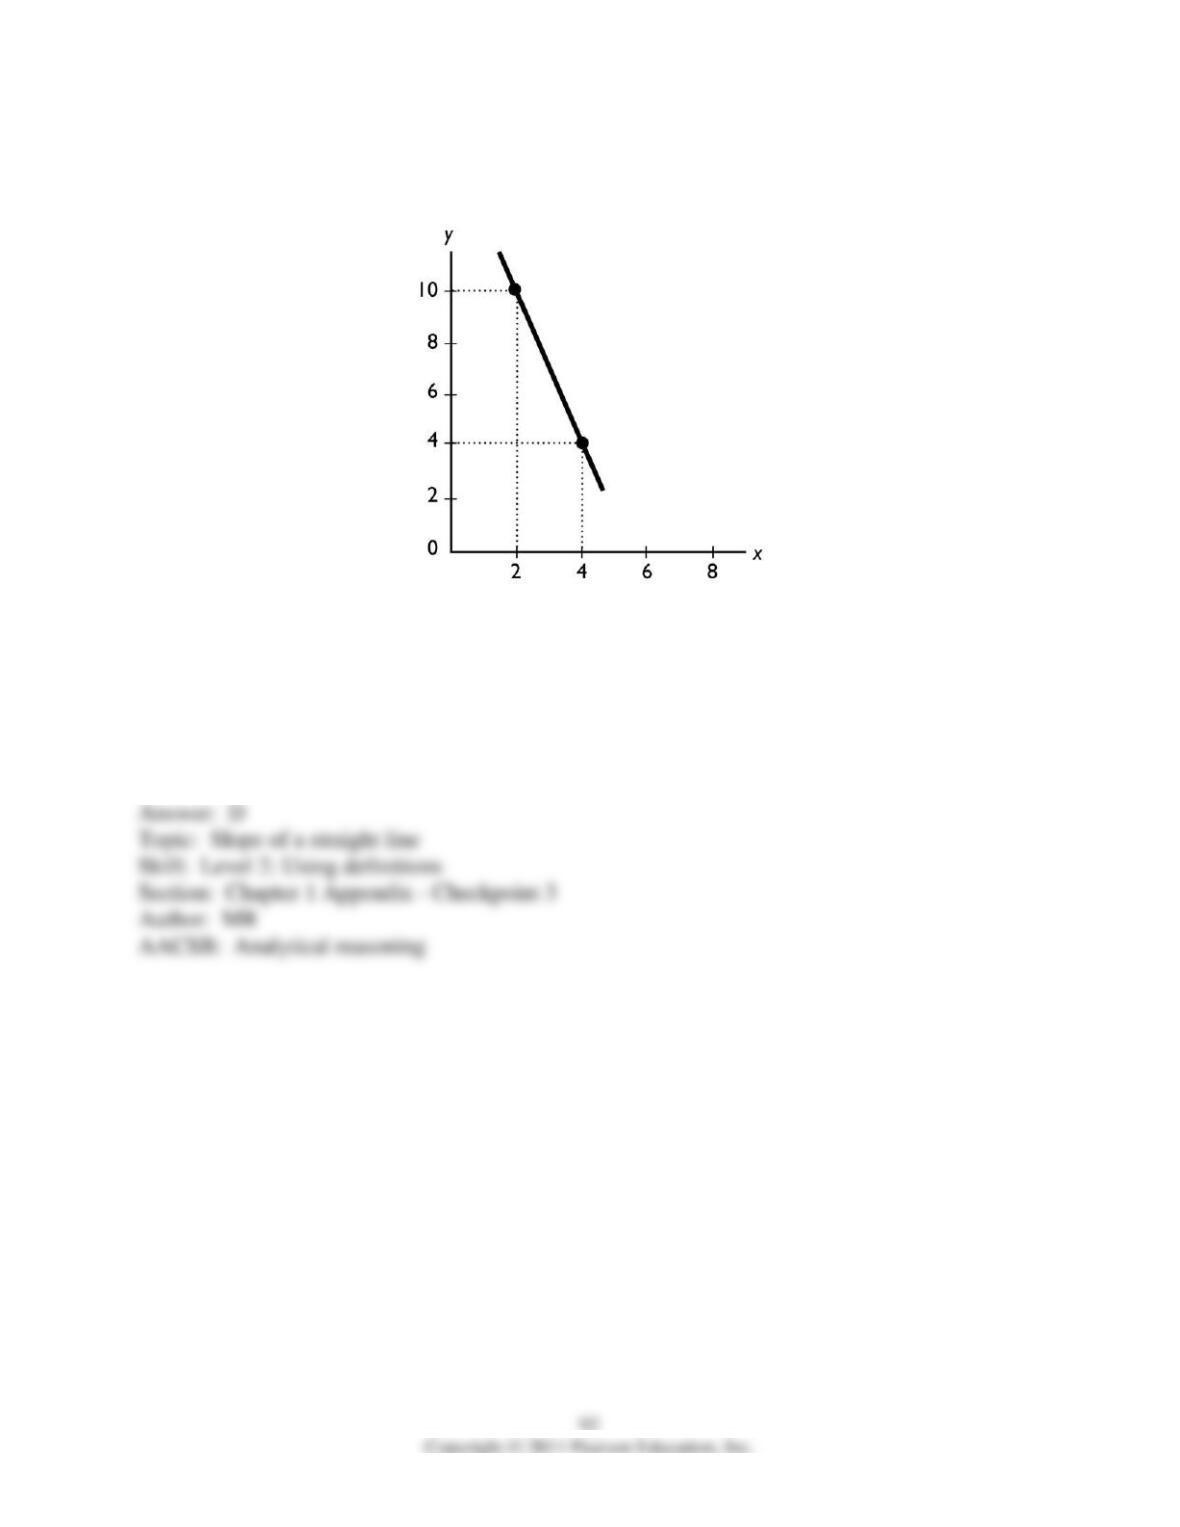
96) The slope of the line shown in the above figure is
A) -1/3.
B) -5.
C) -1.
D) -3.
E) -10.
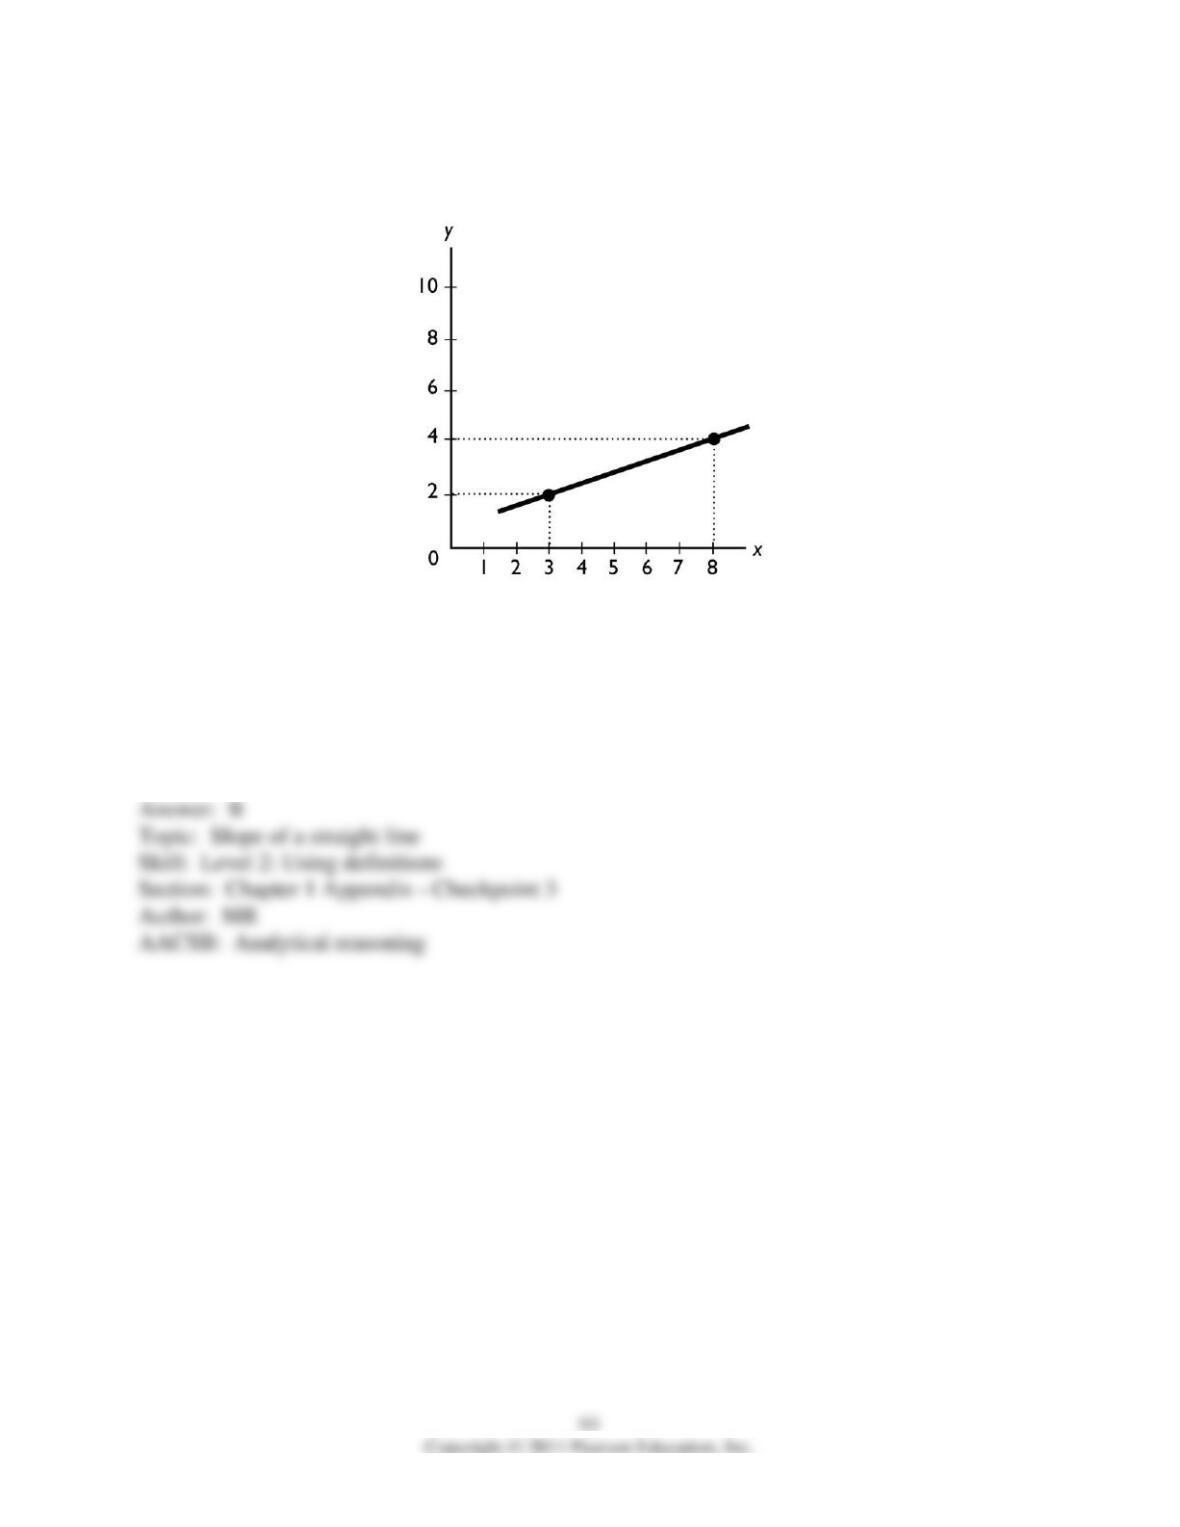
97) The slope of the line shown in the above figure is
A) 5.
B) 2/5.
C) 2/3.
D) 5/2.
E) 2.
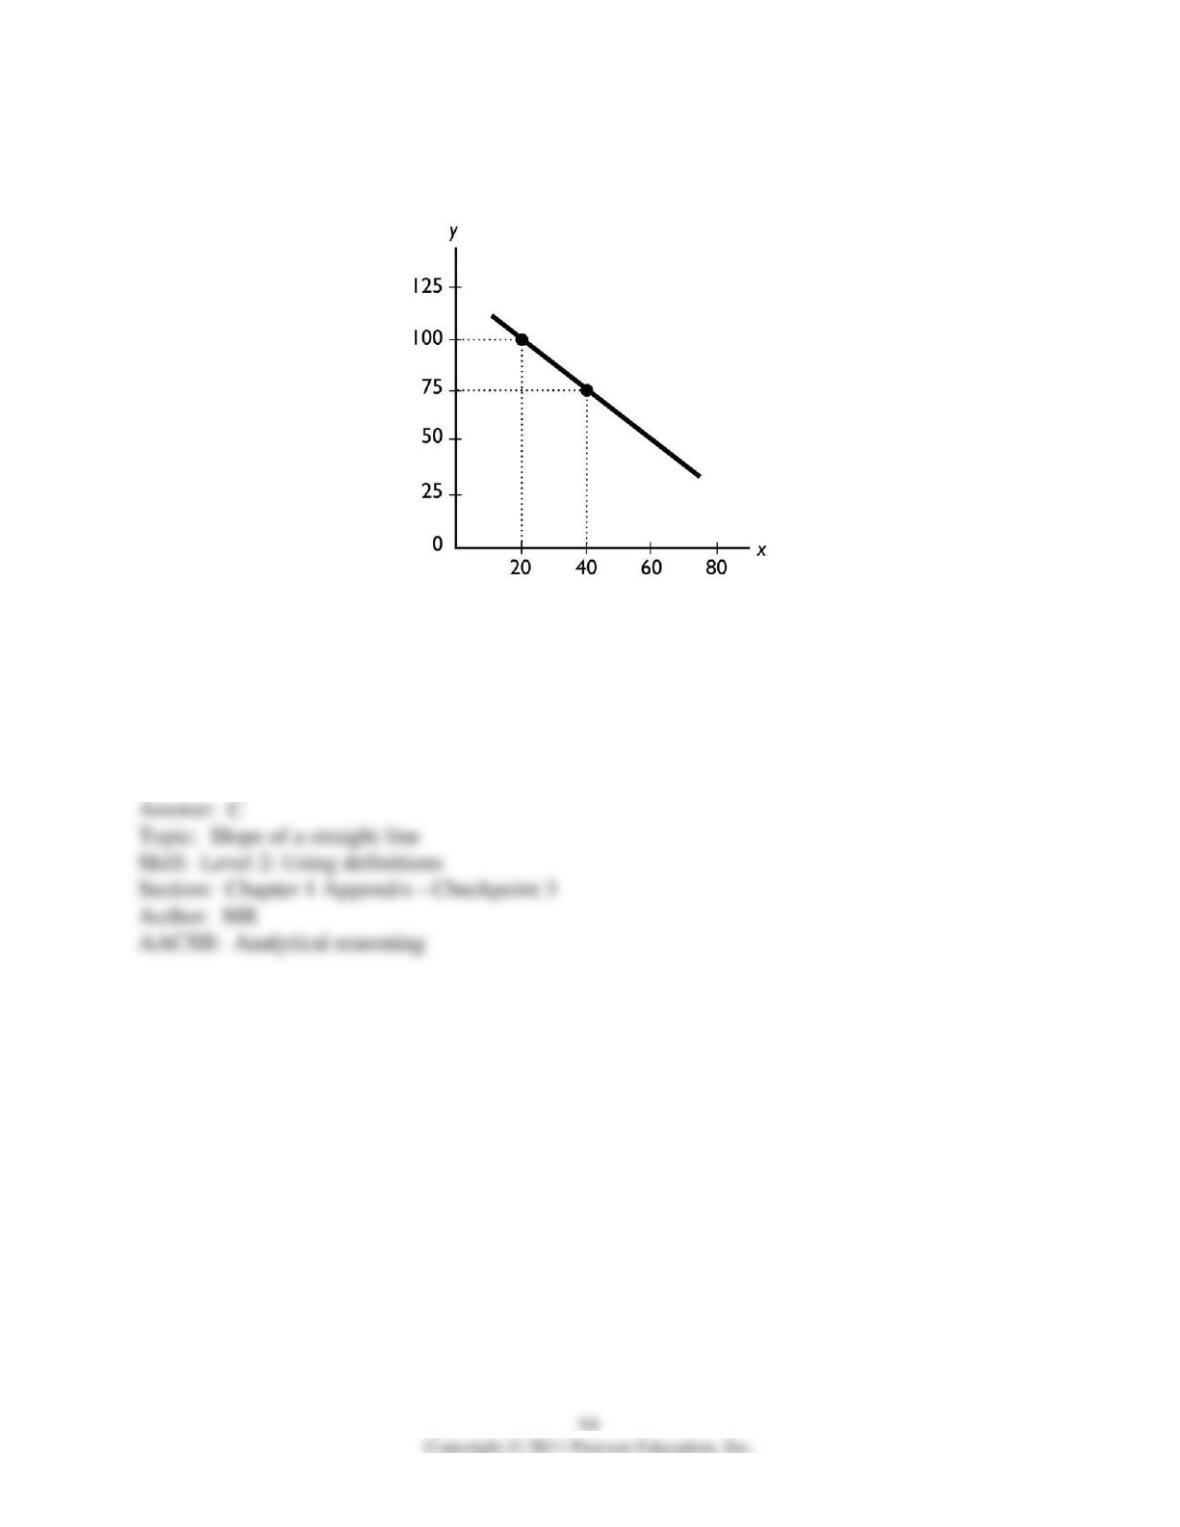
98) The slope of the line shown in the above figure is
A) -1 1/3.
B) -1 2/3.
C) -1.25.
D) -0.80.
E) 5.
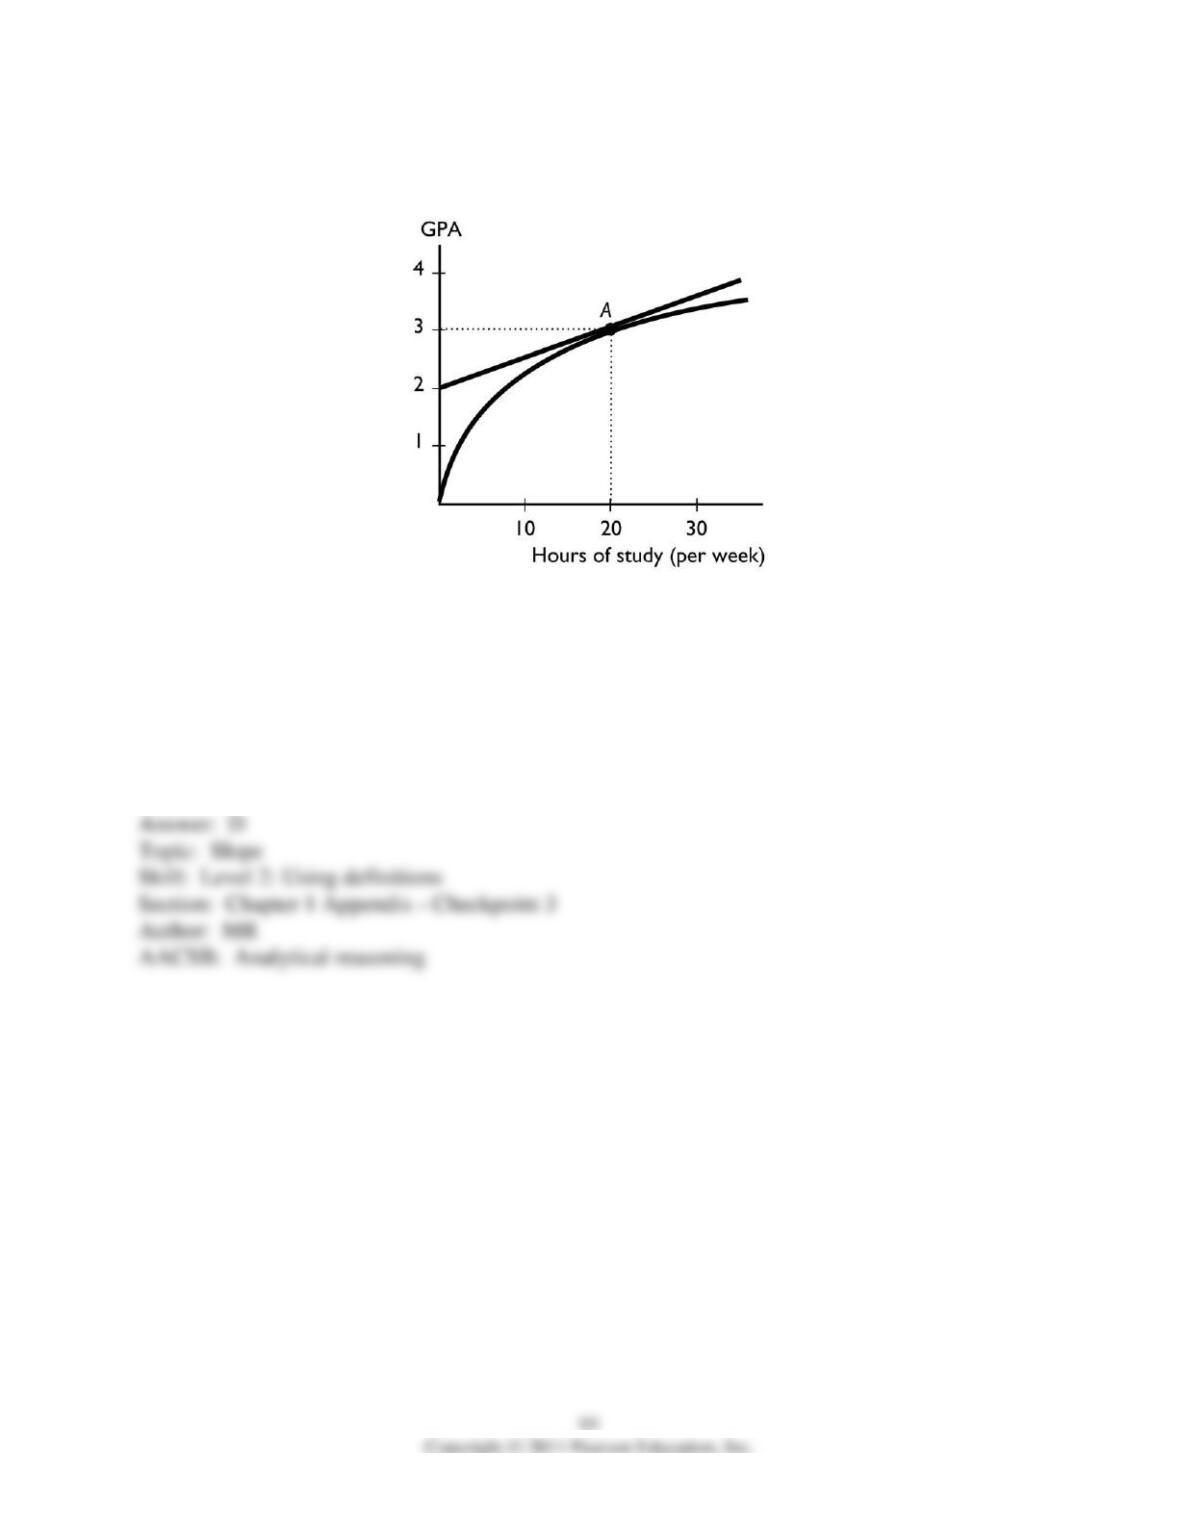
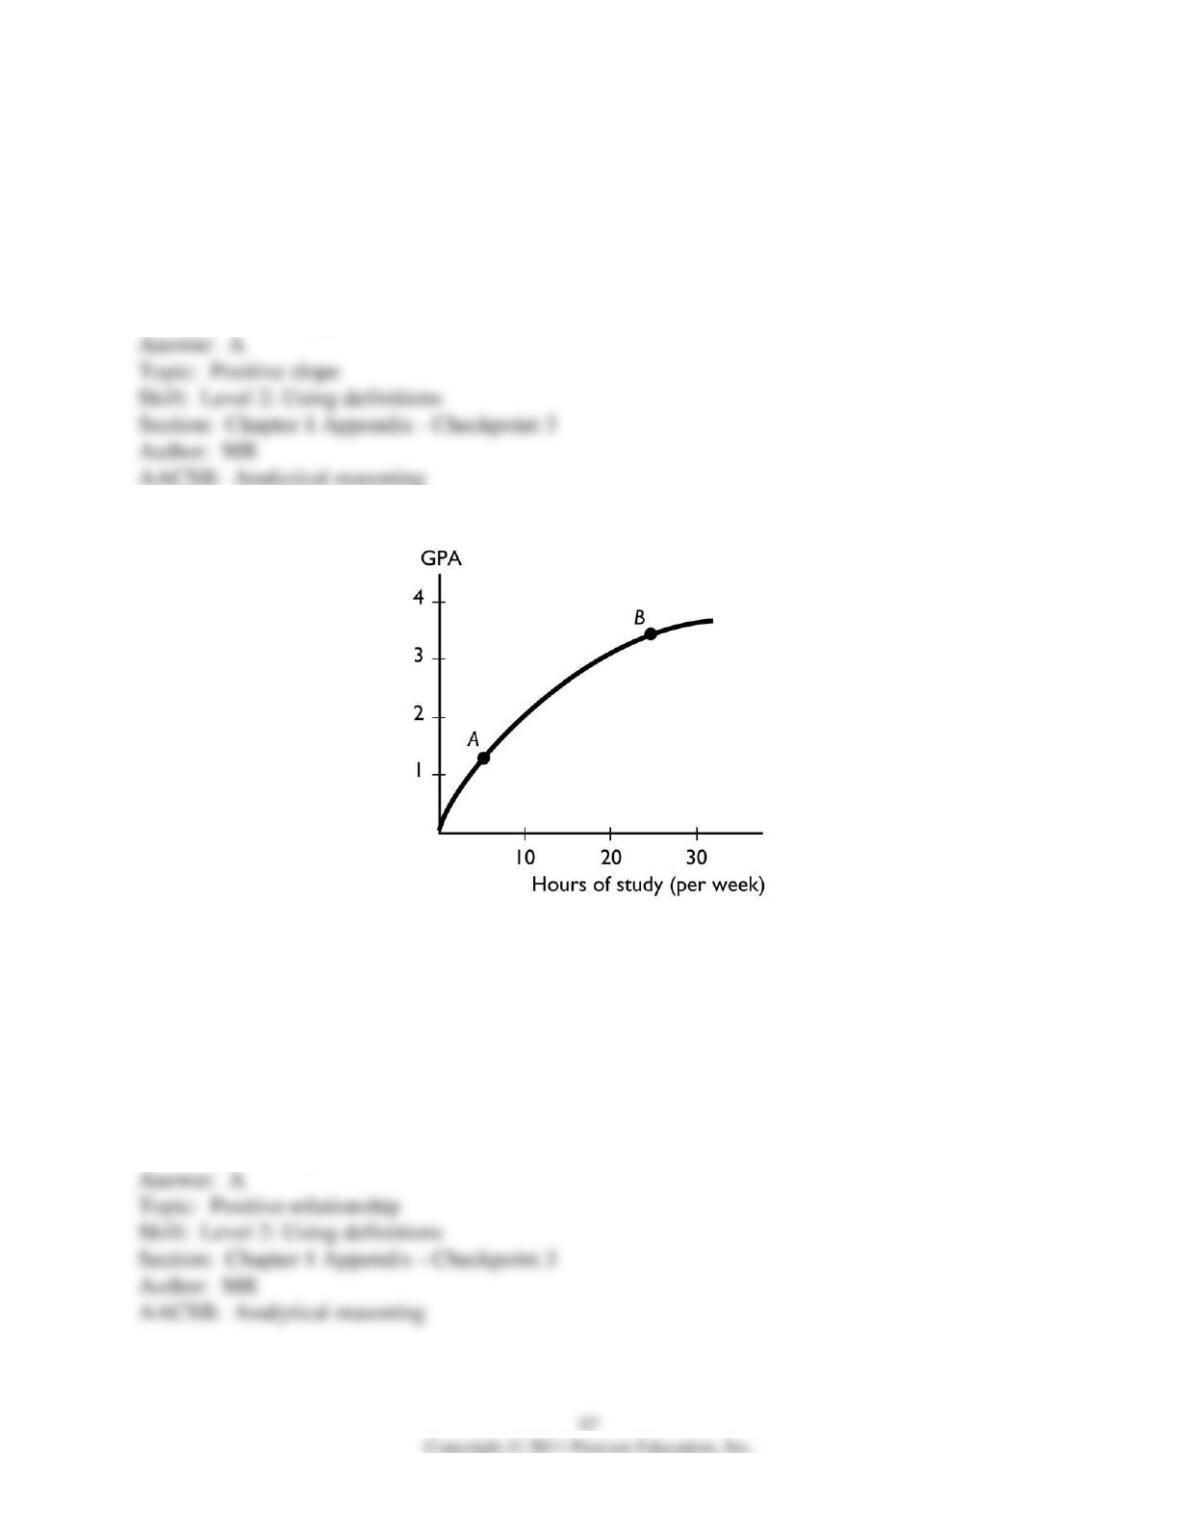
99) The figure above shows the relationship between the time a student spends studying and the
student’s GPA that semester. The slope of the relationship at point A equals
A) 3.
B) 3/20
C) 2/20.
D) 1/20.
E) 0.
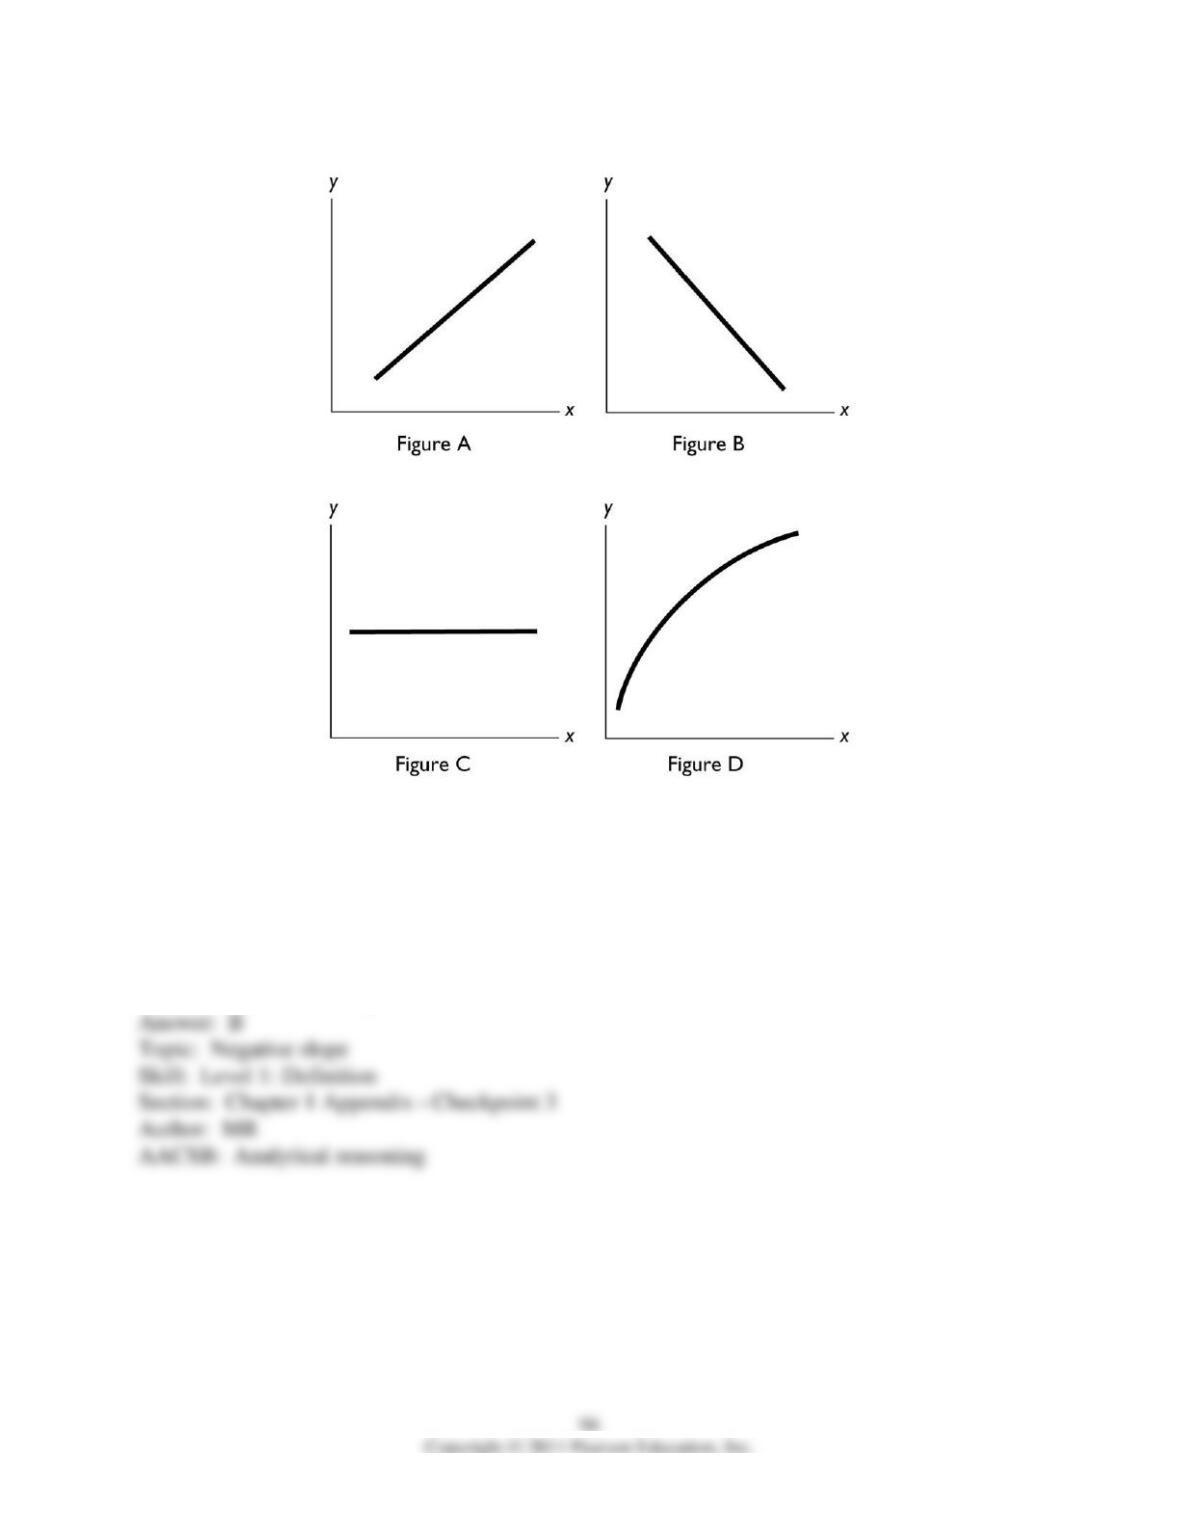
100) In the above figure, which of the figures shows a relationship between x and y with a
negative slope?
A) Figure A
B) Figure B
C) Figure C
D) Figure D
E) Both Figure A and Figure B
101) In the above figure, which of the figures show(s) a relationships between x and y with a
positive slope?
A) Figure A and Figure D
B) Figure B and Figure C
C) Figure C only
D) Figure D only
E) Figure A and Figure B
102) The figure above shows the relationship between the time a student spends studying and the
student’s GPA that semester. This figure shows ________ relationship between the time spent
studying and the GPA.
A) a positive but not linear
B) a negative
C) no
D) a positive, linear
E) cross-sectionally trended
103) The figure above shows the relationship between the time a student spends studying and the
student’s GPA that semester. The slope of the relationship at point A ________ the slope at point
B.
A) is greater than
B) is less than
C) is equal to
D) cannot be compared to
E) can be compared but more information is needed to determine whether the slope is greater
than, less than, or equal to
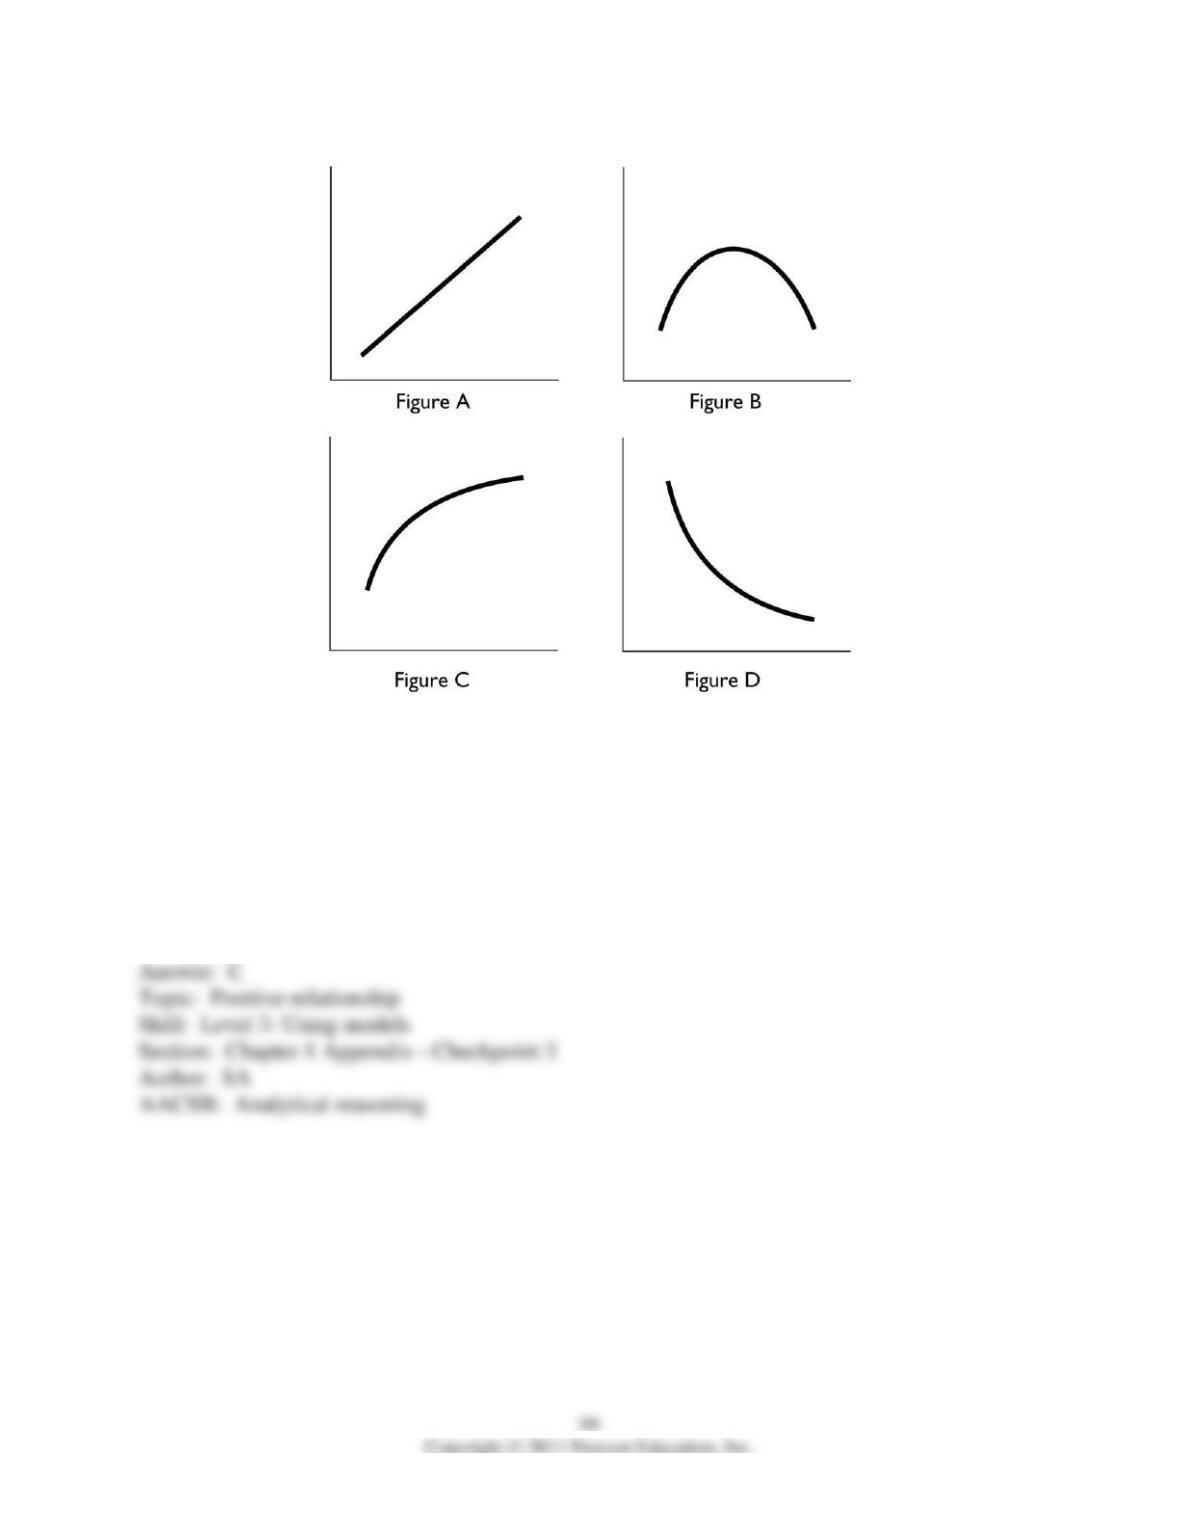
104) In the above, which figure(s) show relationship between the variables that is always
positive?
A) Figure A only
B) Figures C and D
C) Figures A and C
D) Figures A, C, and D
E) Figures A and B
105) In the above, which figure(s) show a relationship between the variables that is always
negative?
A) Figure A only
B) Figure D only
C) Figures A and C
D) Figures A, C, and D
E) Figure B only
106) In the above, which figure shows both a positive and a negative relationship between the
variables?
A) Figure A
B) Figure B
C) Figure C
D) Figure D
E) Figure A, B, and D
107) In the above, which figure(s) has at least one point at which the slope equals zero?
A) Figure B only
B) Figures A and C
C) Figure D only
D) Figures A, C, and D
E) Figures A and D