Archives: Solution Manual
Mechanical Engineering Chapter 12 Homework First Will Consider The Motion Ball Awith
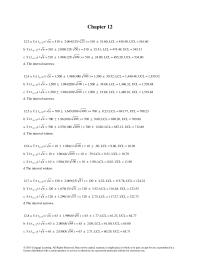
2 1 12–21. A freight train travels at where t is the elapsed time in seconds. Determine the distance traveled in three seconds, and the acceleration at this time. v =6011– e – t 2ft>s, SOLUTION Ans. At Ans.a = […]
Mechanical Engineering Chapter 12 Homework Then The Total Distance Traveled Stotsasbsbsc
1 SOLUTION a=2t–6 dv=a dt Lv 0 Lt 0 dv= (2t –6) dt v=t2–6t ds =v dt Ls 0 Lt 0 ds= (t2–6t) dt s= t 3 3 –3t2 When t=6 s , v=0 Ans. When t=11 s , s=80.7 […]
Chapter 22 neither person supports format change
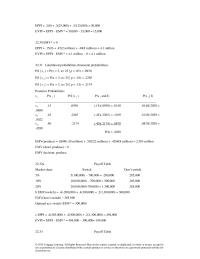
EPPI = .2(0) + .5(25,000) + .3(125,000) = 50,000 EVPI = EPPI – EMV* = 50,000 – 35,000 = 15,000 22.30 EMV* = 0 EPPI = .15(0) + .45(2 million) + .40(8 million) = 4.1 million EVPI = EPPI – […]
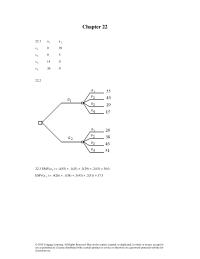
Chapter 22 EMV decision build a medium size plant
Chapter 22 22.1 a 1 a 2 s 1 0 29 s 2 0 5 s 3 14 0 s 4 36 0 22.2 22.3 EMV(a 1 ) = .4(55) + .1(43) + .3(29) + .2(15) = 38.0 EMV(a 2 […]
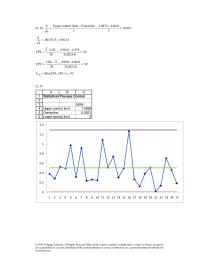
Chapter 21 centerline were taken when the process was out of control
21.36 00107. 3 9841.49873.4 3 CenterlinelimitcontrolUpper n S= − = − = 00214.S;00107. 4 S== 95. )00214(.3 978.49841.4 S3 LSLx CPL = − = − = 92. )00214(.3 9841.4990.4 S3 xUSL CPU = − = − = )CPU,CPL(MinCpk = = […]
Chapter 21 Chance variation represents the variation in student
Chapter 21 21.1Chance variation is caused by a number of randomly occurring events that are part of the production process and that in general cannot be eliminated without changing the process. 21.3 Special variation is caused by specific events or […]
Chapter 20 Regression line Average Seasonal Index
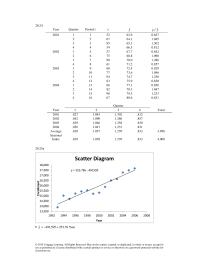
20.24 Year Quarter Period t y y ˆ yy ˆ / 2001 1 1 52 62.9 0.827 2 2 67 64.1 1.045 3 3 85 65.3 1.302 4 4 54 66.5 0.812 2002 1 5 57 67.7 0.842 2 6 […]
Chapter 20 There appears to be a gradual upward trend
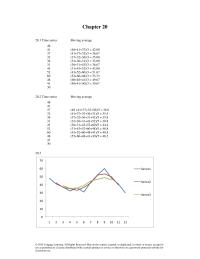
Chapter 20 20.1 Time series Moving average 48 41 (48+41+37)/3 = 42.00 37 (41+37+32)/3 = 36.67 32 (37+32+36)/3 = 35.00 36 (32+36+31)/3 = 33.00 31 (36+31+43)/3 = 36.67 43 (31+43+52)/3 = 42.00 52 (43+52+60)/3 = 51.67 60 (52+60+48)/3 = 53.33 […]
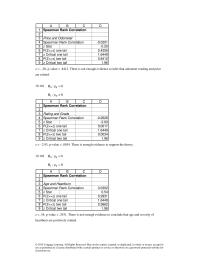
Chapter 19 Spearman Rank Correlation Price And Odometer Spearman
z = –.20, p-value = .8412. There is not enough evidence to infer that odometer reading and price are related. 3 4 5 6 7 8 9 Price and Odometer Spearman Rank Correlation -0.0201 z Stat -0.20 P(Z<=z) one tail […]
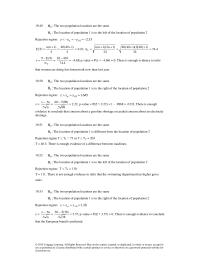
Chapter 19 The location of population 1 is different fro
19.49 :H0 The two population locations are the same :H1 The location of population 1 is to the left of the location of population 2 Rejection region: 33.2zzz 01.−=−=− 410 4 )140(40 4 )1n(n )T(E = + = + […]
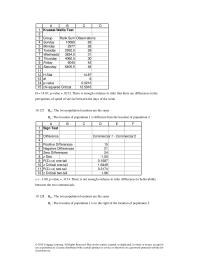
Chapter 19 The two population locations are the same
H = 14.87, p-value = .0213. There is enough evidence to infer that there are differences in the perceptions of speed of service between the days of the week. 7 8 9 10 11 12 13 14 15 Wednesday 3834.5 […]
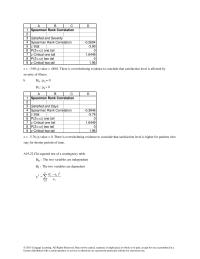
Chapter 19 Spearman Rank Correlation Satisfied And Severity Spearman
5 6 7 8 9 z Stat -3.90 P(Z<=z) one tail 0 z Critical one tail 1.6449 P(Z<=z) two tail 0 z Critical two tail 1.96 z = –3.90; p-value = .0001. There is overwhelming evidence to conclude that satisfaction […]
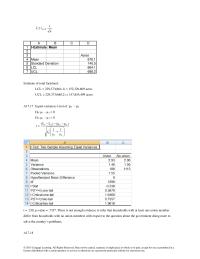
Chapter 19 Spearman rank correlation coefficient test
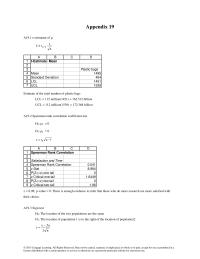
Appendix 19 A19.1 t-estimator of µ n s tx 2/ 4 5 6 7 Mean 1495 Standard Deviation 404 LCL 1451 UCL 1539 Estimate of the total number of plastic bags LCL = 112 million(1451) = 162.512 billion UCL […]
Chapter 18 In this case male–dominated jobs are paid
18.35 In this case male–dominated jobs are paid on average $.039 (3.9 cents) less than female– dominated jobs after adjusting for the value of each job. 15 16 17 18 19 Coefficients Standard Error t Stat P-value Intercept 2.01 4.02 […]
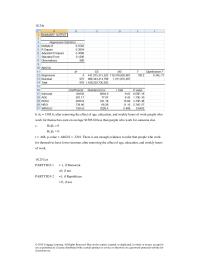
Chapter 18 After removing the effect of age, education
18.24a b. b4 = 1505.6; after removing the effect of age, education, and weekly hours of work people who work for themselves earn on average $1505.60 less than people who work for someone else. c. H0:β4 = 0 H1:β4 > […]
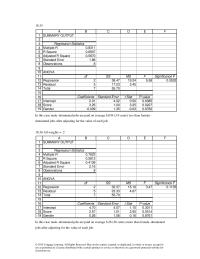
Chapter 18 Homework Square 08051 Adjusted Square 07947 Standard Error
Chapter 18 18.1 a b 18.2 a © 2015 Cengage Learning. All Rights Reserved. May not be copied, scanned, or duplicated, in whole or in part, except for use as permitted in a license distributed with a certain product or […]
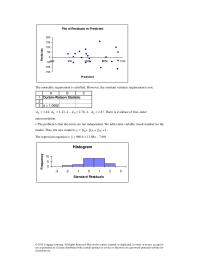
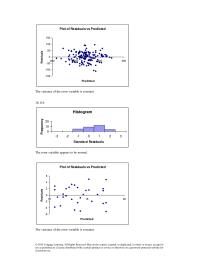
Chapter 17 Predicted The Error Approximately Normally Distributed With
The normality requirement is satisfied. However, the constant variance requirement is not. L d = 1.24, U d = 1.43, 4 – U d = 2.76, 4 – L d = 2.57. There is evidence of first–order 2 3 d […]
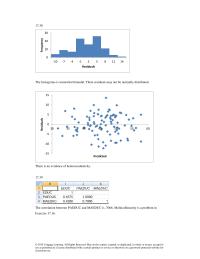
Chapter 17 There residuals may not be normally distributed
17.38 0 10 -10 -7 -4 -1 2 5 8 11 14 Frequency Residuals The histograms is somewhat bimodal. There residuals may not be normally distributed. There is no evidence of heteroscedasticity. -15 -10 -5 0 30 35 40 45 […]
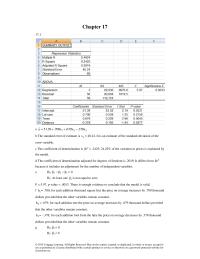
Chapter 17 which we interpret to mean that for each additional thousand
Work experience: t = 3.00, p-value = .0036 Both the GMAT and work experience are linearly related to MBA GPA 7.15 b. H0: β1 = β2 = β3 = β4 = β5 = β6 = 0 H1: At least one […]
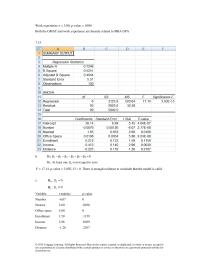
Chapter 17 The coefficient of determination adjusted for degrees
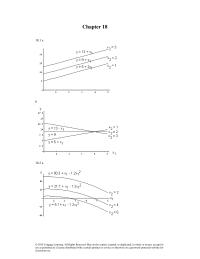
Chapter 17 17.1 a 321 x378.x679.x700.39.51y ˆ−++= b The standard error of estimate is s = 40.24. It is an estimate of the standard deviation of the error variable. c The coefficient of determination is 2 R = .2425; […]
Chapter 17 no union members with respect to the question about
n s tx 2/ 4 5 6 7 Mean 676.1 Standard Deviation 140.5 LCL 664.1 UCL 688.2 Estimate of total farmland: LCL = 229,373(664.1) = 152,326,609 acres UCL = 229,373(688.2) = 157,854,499 acres 1 2 3 A B C […]
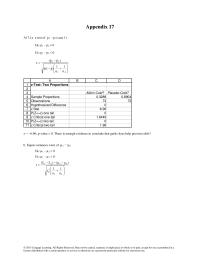
Chapter 17 There is enough evidence to conclude that garlic
Appendix 17 A17.1a z-test of p1 – p2 (case 1) H0: p1 – p2 = 0 H1: p1 – p2 < 0 +− − = 21 21 n 1 n 1 )p ˆ […]
Chapter 16 Homework The error variable appears to be normal.
The variance of the error variable is constant. -150 -100 -50 0 200 250 300 350 Predicted Residuals 16.116 The error variable appears to be normal. 0 10 -3 -2 -1 0 1 2 3 Standard Residuals Frequency The variance […]
Chapter 16 service or otherwise on a password-protected website for
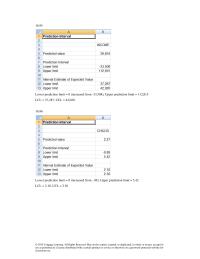
16.95 Lower prediction limit = 0 (increased from -33,508), Upper prediction limit = 112,815 LCL = 37,287, UCL = 42,020 16.96 Lower prediction limit = 0 (increased from -.89), Upper prediction limit = 5.42 LCL = 2.18, UCL = 2.36 […]
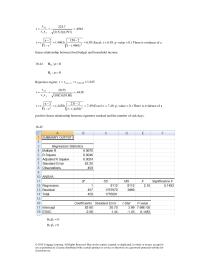
Chapter 16 Linear relationship between food budget and household
4961. )797,1)(2.115( 7.225 ss s r yx xy === 95.6 )4961(.1 2150 )4961(. r1 2n rt 22 = − − = − − = (Excel: t = 6.95, p–value = 0.) There is evidence of a linear relationship between food […]
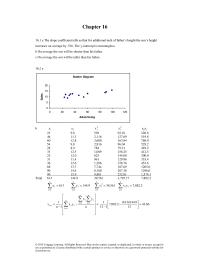
Chapter 16 On average the son will be taller than his father
Chapter 16 16.1 a The slope coefficient tells us that for additional inch of father’s height the son’s height increases on average by .516. The y-intercept is meaningless. b On average the son will be shorter than his father. c […]
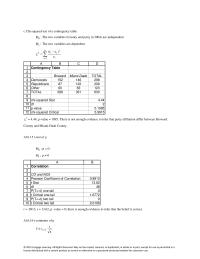
Chapter 16 Contingency Table Broward Democrats Republicans
c Chi-squared test of a contingency table :H0 The two variables (County and party in 2004) are independent :H1 The two variables are dependent = − = 6 1i i 2 ii 2 e )ef( 4 5 6 7 […]
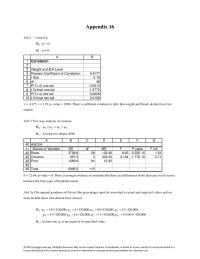
Chapter 16 Correlation Weight And Ba Level Pearson Coefficient
Appendix 16 A16.1 t-test of ρ 0:H0= 0:H1 4 5 6 7 8 9 10 Pearson Coefficient of Correlation 0.4177 t Stat 3.19 df 48 P(T<=t) one tail 0.0013 t Critical one tail 1.6772 P(T<=t) two tail 0.0026 t Critical […]
Chapter 15 The two variables (shift and day) are independent
2 = .055, p-value = .8140. There is not enough evidence to infer that matched pairs difference of sales is not normally distributed. 10 11 12 13 14 15 16 17 18 19 (-1 < z <= 0) 0.3413 […]
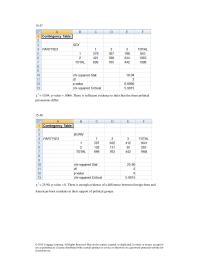
Chapter 15 Americans differ from Americans who work
15.47 2 = 10.04, p-value = .0066. There is sufficient evidence to infer that the three political persuasions differ. 15.48 2 = 25.90, p-value = 0. There is enough evidence of a difference between foreign-born and American-born residents […]
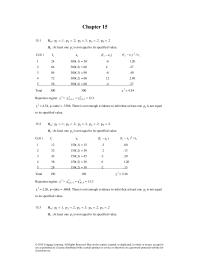
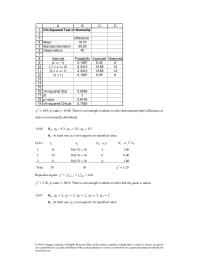
Chapter 15 There Enough Evidence Infer That The Two
Chapter 15 15.1 :H0 = 1 p .1, = 2 p .2, = 3 p .3, = 4 p .2, = 5 p .2 :H1 At least one i p is not equal to its specified value. Cell i i […]
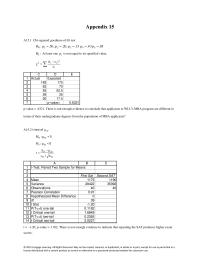
Chapter 15 Program Are Different Terms Their
Appendix 15 A15.1 Chi-squared goodness-of-fit test :H0 50.p1= , 20.p2= , 15.p3= 10.p4= 05.p5= :H1 At least one i p is not equal to its specified value. − = i 2 ii 2 e )ef( 3 4 5 6 7 […]
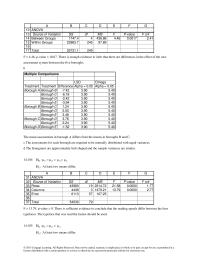
Chapter 14 There Sufficient Evidence Infer That There Are
F = 4.46, p-value = .0017. There is enough evidence to infer that there are differences in the effect of the new assessment system between the five boroughs. 14 15 16 17 Between Groups 1747.4 4 436.86 4.46 0.0017 2.41 […]
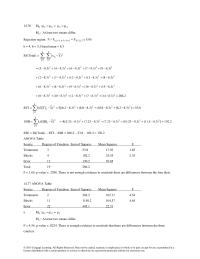
Chapter 14 There is sufficient evidence to indicate that there
14.76 == 210 :H 3 4 = :H1 At least two means differ. Rejection region: 1bkn,1k, FF +−−− 12,3,01. F= = 5.95 k = 4, b = 5, Grand mean = 8.3 SS(Total) = == − b […]
Chapter 14 Conclusion The following pairs of means differ.
F = 4.61, p-value = .0032. There is enough evidence to conclude that at least two means differ. 14.36 43210 :H === :H1 At least two means differ. F = .968, p-value = .4067. There is not enough evidence to […]
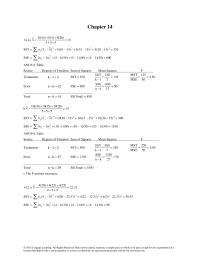
Chapter 14 Degrees of Freedom Sum of Squares
Chapter 14 14.1a 555 )20(5)15(5)10(5 x++ ++ = = 15 SST = =− 2 jj )xx(n 5(10 – 15) 2 + 5(15 – 15) 2 + 5(20 – 15) 2 = 250 SSE = =− 2 jj s)1n( (5 –1)(50) […]
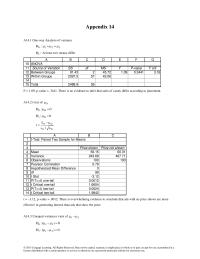
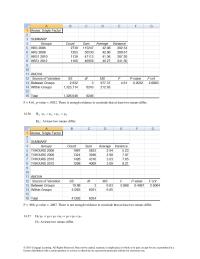
Chapter 14 There is no evidence to infer that sales
Appendix 14 A14.1 One-way Analysis of variance :H0 321 == :H1 At least two means differ 10 13 14 15 Within Groups 2397.5 57 42.06 Total 2488.9 59 F = 1.09, p-value = .3441. There is no evidence to infer […]
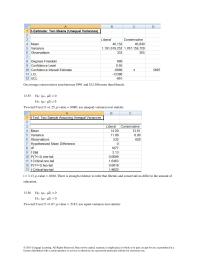
Chapter 13 Variance Observations Hypothesized Mean Difference
© 2015 Cengage Learning. All Rights Reserved. May not be copied, scanned, or duplicated, in whole or in part, except for use as permitted in a license distributed with a certain product or service or otherwise on a password-protected website […]
Chapter 13 There is enough evidence to infer that married
z = -3.72, p-value = .0002. There is enough evidence to infer that married and single, never married people differ in their completion of a graduate degree. 13.173 H0: (p1-p2) = 0 H1: (p1-p2) > 0 z = 3.04, p-value […]
Chapter 13 The histogram of the differences is bell shaped
D1 :H 0 Rejection region: 684.1ttt 39,05., = = − = − =40/63.30 075.19 n/s x t DD D D 4.08, p-value = .0001. There is enough evidence to conclude that companies that advertise in the Yellow Pages have […]
Chapter 13 Experimental data could have been derived by selecting
On average conservatives earn between $991 and $12,386 more than liberals. 13.55 H0: (μ1– μ2) = 0 H1: (μ1– μ2) ≠ 0 Two-tail F test: F =1.25, p-value = .0080; use unequal-variances test statistic t = 3.13, p-value = .0018. […]
Chapter 13 use equal-variances test statistic Rejection region
Chapter 13 13.5a Equal-variances estimator +− 21 2 p2/21 n 1 n 1 st)xx( = (524 – 469) 2.009 + […]
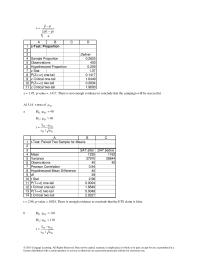
Chapter 13 Proportion Sample Proportion Observations Hypothesized Proportion
n )p1(p pp ˆ z− − = 6 7 8 9 10 11 Hypothesized Proportion 0.259 z Stat 1.07 P(Z<=z) one-tail 0.1417 z Critical one-tail 1.6449 P(Z<=z) two-tail 0.2834 z Critical two-tail 1.9600 z = 1.07, p-value = .1417. There […]
Chapter 13 Assuming Equal Variances Mean Variance Observations
Appendix 13 A13.1 Equal-variances t-test of 21 − 0)(:H 210 =− 0)(:H 211 − + −−− = 21 2 p 2121 n 1 n 1 s )()xx( t 1 2 6 7 8 […]
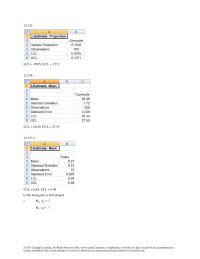
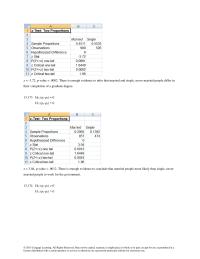
Chapter 12 there is enough evidence to infer that postal workers
12.155 LCL = .0765, UCL = .1271 12.156 LCL = 26.44, UCL = 27.55 12.157 a LCL = 6.84, UCL = 6.98 b The histogram is bell shaped. c :H0 = 7 :H1 < 7 © 2015 Cengage Learning. All […]
Chapter 12 proportion of Americans who support the Democrats
12.83 a n/)p ˆ 1(p ˆ zp ˆ2/ − = .50 1.96 400/)50.1(50.− = .50 .0490 b n/)p ˆ 1(p ˆ zp ˆ2/ − = .33 1.96 400/)33.1(33.− = .33 .0461 c n/)p ˆ […]
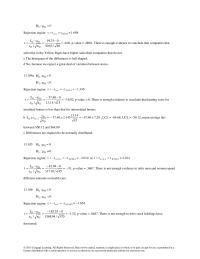
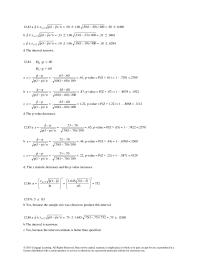
Chapter 12 There Enough Evidence Infer That The Mean
Chapter 12 12.3 a n/stx 2/ = 510 2.064(125/ 25 ) = 510 51.60; LCL = 458.40, UCL = 561.60 b n/stx 2/ = 510 2.009(125/ 50 ) = 510 35.51; LCL = 474.49, […]
Chapter 11 Type Error Occurs When Conclude That The
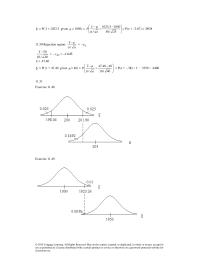
= P( x < 1023.3 given = 1050) = − − 25/50 10503.1023 /n x P = P(z < –2.67) = .0038 11.50 Rejection region: n/ x − […]
Chapter 11 Risky investment is not more successful
Chapter 11 11.1 0 H : The drug is not safe and effective 1 H : The drug is safe and effective 11.2 0 H : I will complete the Ph.D. 1 H : I will not be able to […]
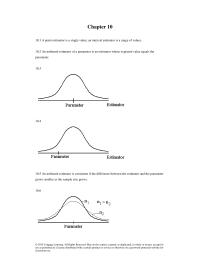
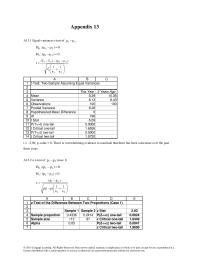
Chapter 10 If there are two unbiased estimators of a parameter
© 2015 Cengage Learning. All Rights Reserved. May not be copied, scanned, or duplicated, in whole or in part, except for use as permitted in a license distributed with a certain product or service or otherwise on a password-protected website […]