Archives
Chapter 1 1 Populationd Samplee Parameterf Statisticansa Descriptive Statistics Deals
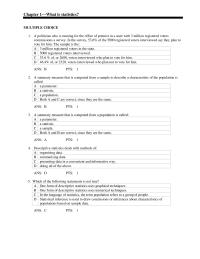
Chapter 1—What is statistics? MULTIPLE CHOICE 1. A politician who is running for the office of premier in a state with 3 million registered voters commissions a survey. In the survey, 53.6% of the 5000 registered voters interviewed say they […]
Chapter 10 1 Find The Probability That The Mean Height
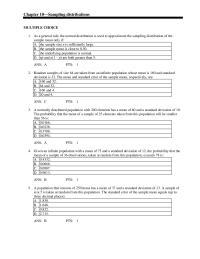
Chapter 10—Sampling distributions MULTIPLE CHOICE 1. As a general rule, the normal distribution is used to approximate the sampling distribution of the sample mean only if: A. the sample size n is sufficiently large. B. the sample mean is close […]
Chapter 11 1 Robust Estimator One That a Unbiased
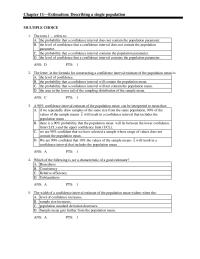
Chapter 11—Estimation: Describing a single population MULTIPLE CHOICE 1. The term 1 – refers to: A. the probability that a confidence interval does not contain the population parameter. B. the level of confidence that a confidence interval does not contain […]
Chapter 11 2 Suppose That The Amount Time Teenagers Spend
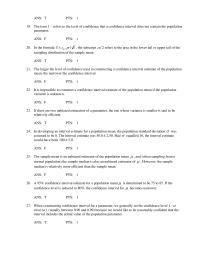
19. The term 1 – refers to the level of confidence that a confidence interval does not contain the population parameter. ANS: F PTS: 1 20. In the formula / 2 /nx z , the subscript / 2 […]
Chapter 12 1 Apts 110 The Expected Value The Difference
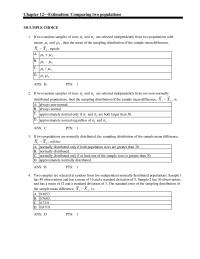
Chapter 12—Estimation: Comparing two populations MULTIPLE CHOICE 1. If two random samples of sizes 1 n and 2 n are selected independently from two populations with means 1 and 2 , then the mean of the sampling distribution […]
Chapter 13 1 12 Suppose You Intend Test The Claim
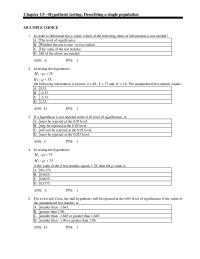
Chapter 13—Hypothesis testing: Describing a single population MULTIPLE CHOICE 1. In order to determine the p-value, which of the following items of information is not needed? A. The level of significance. B. Whether the test is one– or two–tailed. C. […]
Chapter 13 2 The average Australian adult drinks fewer than 3
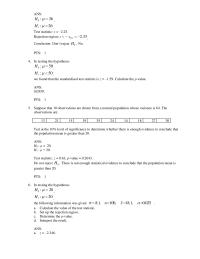
4. In testing the hypotheses 50: 0= H . 50: 1 H . we found that the standardised test statistic is z = –1.59. Calculate the p-value. ANS: 0.0559. PTS: 1 5. Suppose that 10 observations are drawn […]
Chapter 14 1 In testing the difference between two population means
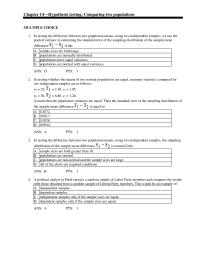
Chapter 14—Hypothesis testing: Comparing two populations MULTIPLE CHOICE 1. In testing the difference between two population means, using two independent samples, we use the pooled variance in estimating the standard error of the sampling distribution of the sample mean difference […]
Chapter 14 2 we estimate that the daily sales during the
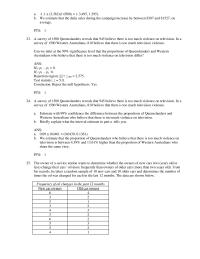
23. A survey of 1500 Queenslanders reveals that 945 believe there is too much violence on television. In a survey of 1500 Western Australians, 810 believe that there is too much television violence. Can we infer at the 99% significance […]
Chapter 15 1 The two sample variances are s1
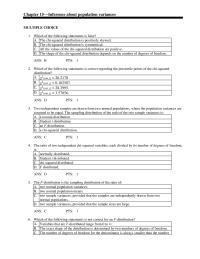
Chapter 15—Inference about population variances MULTIPLE CHOICE 1. Which of the following statements is false? A. The chi-squared distribution is positively skewed. B. The chi-squared distribution is symmetrical. C. All the values of the chi-squared distribution are positive. D. The […]
Chapter 16 1 Dont Reject The Null Hypothesis Nopts 18
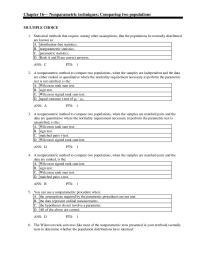
Chapter 16— Nonparametric techniques: Comparing two populations MULTIPLE CHOICE 1. Statistical methods that require, among other assumptions, that the populations be normally distributed are known as: A. distribution-free statistics. B. nonparametric statistics. C. parametric statistics. D. Both A and B […]
Chapter 17 1 Sample Size Selected The Value
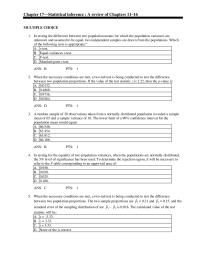
Chapter 17—Statistical inference : A review of Chapters 11–16 MULTIPLE CHOICE 1. In testing the difference between two population means for which the population variances are unknown and assumed to be equal, two independent samples are drawn from the populations. […]
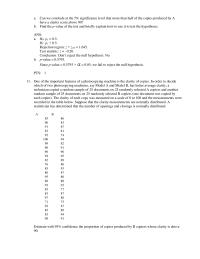
Chapter 17 2 The clarity of each copy was measured on a scale of
a. Can we conclude at the 5% significance level that more than half of the copies produced by A have a clarity score above 90? b. Find the p-value of the test and briefly explain how to use it to […]
Chapter 18 1 Dpts 142 Consider The Following Partial Anova
Chapter 18—Analysis of variance MULTIPLE CHOICE 1. In one-way ANOVA, the amount of total variation that is unexplained is measured by the: A. sum of squares for treatments. B. sum of squares for error. C. total sum of squares. D. […]
Chapter 18 2 Graduate management Admission Test Gmat Scores
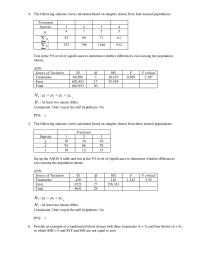
4. The following statistics were calculated based on samples drawn from four normal populations. Treatment Statistic 1 2 3 4 j n 4 7 5 5 j x 52 69 71 61 2 j x 753 798 1248 912 Test […]
Chapter 19 1Onesample test The Parametric Counterpart
Chapter 19—Nonparametric techniques: Comparing two or more populations MULTIPLE CHOICE 1. The non-parametric counterpart of the parametric t-test of D for matched pairs is the: A. Friedman test. B. Kruskal–Wallis test. C. Wilcoxon signed rank sum test. D. Wilcoxon […]
Chapter 19 2 In particular, she would like to investigate the belief
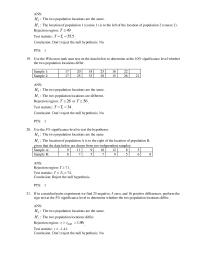
19. Use the Wilcoxon rank sum test on the data below to determine at the 10% significance level whether the two population locations differ. Sample 1: 17 20 18 25 16 22 Sample 2: 17 25 33 38 15 26 […]
Chapter 2 1 Timeseries Data Are Often Graphically
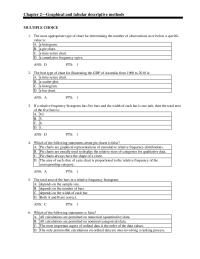
Chapter 2—Graphical and tabular descriptive methods MULTIPLE CHOICE 1. The most appropriate type of chart for determining the number of observations at or below a specific value is: A. a histogram. B. a pie chart. C. a time-series chart. D. […]
Chapter 2 2 Set 3the Frequency Distribution For Sample 200
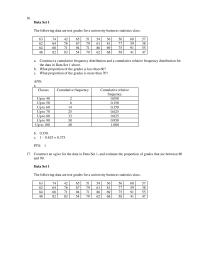
16. Data Set 1 The following data are test grades for a university business statistics class. 63 74 42 65 51 54 36 56 68 57 62 64 76 67 79 61 81 77 59 38 84 68 71 94 […]
Chapter 20 1 The Number Degrees Freedom Associated With The
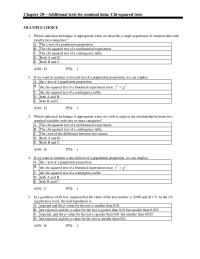
Chapter 20—Additional tests for nominal data: Chi-squared tests MULTIPLE CHOICE 1. Which statistical technique is appropriate when we describe a single population of nominal data with exactly two categories? A. The z-test of a population proportion. B. The chi-squared test […]
Chapter 20 2 A major insurance firm interviewed a random sample of
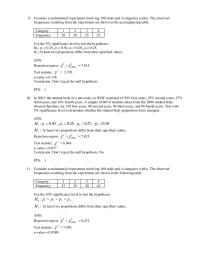
9. Consider a multinomial experiment involving 100 trials and 4 categories (cells). The observed frequencies resulting from the experiment are shown in the accompanying table. Category 1 2 3 4 Frequency 18 30 25 27 Use the 5% significance level […]
Chapter 21 1 Apts 161 The Least Squares Method For
Chapter 21—Simple linear regression and correlation MULTIPLE CHOICE 1. Testing whether the slope of the population regression line could be zero is equivalent to testing whether the: A. sample coefficient of correlation could be zero. B. standard error of estimate […]
Chapter 21 2 The Manager Fast Food Restaurant Wishes Determine
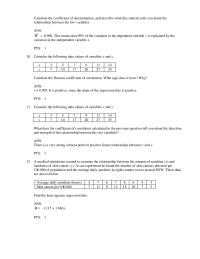
Calculate the coefficient of determination, and describe what this statistic tells you about the relationship between the two variables. 10. Consider the following data values of variables x and y. x 3 5 7 9 11 14 y 7 10 […]
Chapter 21 3 An ardent fan of television game shows has observed that
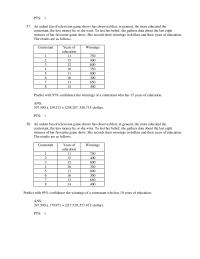
PTS: 1 57. An ardent fan of television game shows has observed that, in general, the more educated the contestant, the less money he or she wins. To test her belief, she gathers data about the last eight winners of […]
Chapter 21 4 Predict With 95 Confidence The Average Number
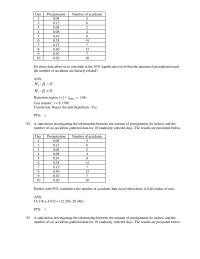
Day Precipitation Number of accidents 1 0.05 5 2 0.12 6 3 0.05 2 4 0.08 4 5 0.10 8 6 0.35 14 7 0.15 7 8 0.30 13 9 0.10 7 10 0.20 10 Do these data allow us […]
Chapter 22 1 Apts 150 For The Multiple Regression Model
Chapter 22—Multiple regression MULTIPLE CHOICE 1. In testing the validity of a multiple regression model, a small value of the F-test statistic indicates that: A. most of the variation in the independent variables is explained by the variation in y. […]
Chapter 22 2 After Some Consideration Developed The Multiple Regression
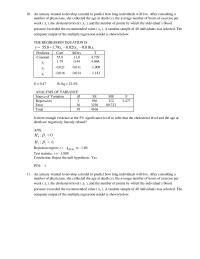
10. An actuary wanted to develop a model to predict how long individuals will live. After consulting a number of physicians, she collected the age at death (y), the average number of hours of exercise per week ( 1 x […]
Chapter 23 1 General Represent Nominal Independent Variable
Chapter 23—Model building MULTIPLE CHOICE 1. In explaining the amount of money spent on children’s clothes each month, which of the following independent variables is best represented with an indicator variable? A. Age. B. Height. C. Gender. D. Weight. 2. […]
Chapter 23 2 However Wants Know There Aredifferences Among The
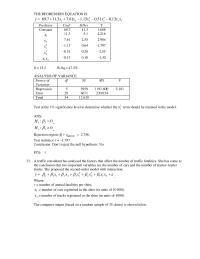
THE REGRESSION EQUATION IS =y 21 2 2 2 121 13.051.015.161.73.117.69 xxxxxx −−−++ . Predictor Coef StDev T Constant 69.7 41.3 1.688 1 x 11.3 5.1 2.216 2 x 7.61 2.55 2.984 2 1 x –1.15 0.64 –1.797 2 2 […]
Chapter 23 3 35 Professor Accounting Wanted Develop Multiple Regression
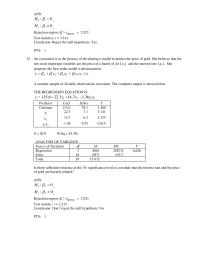
32. An economist is in the process of developing a model to predict the price of gold. She believes that the two most important variables are the price of a barrel of oil )( 1 x and the interest rate […]

Chapter 24 1 Bpts 153 Order Represent Qualitative Independent Variable
Chapter 24–Statistical inference: Conclusion MULTIPLE CHOICE 1. For a sample of size 18 taken from a normally distributed population with standard deviation equal to 5, a 95% confidence interval for the population mean would require: A. z = 1.960. B. […]
Chapter 24 2 Question Deals Withthe Amount Weekly Exercise Question
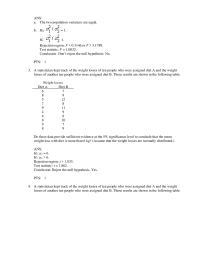
3. A statistician kept track of the weight losses of ten people who were assigned diet A and the weight losses of another ten people who were assigned diet B. These results are shown in the following table. Weight losses […]
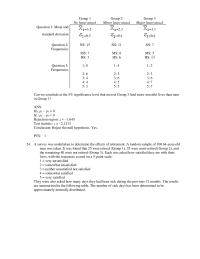
Chapter 24 3 A survey was undertaken to determine the effects
Group 1 Group 2 Group 3 No heart attack Minor heart attack Major heart attack Question 1: Mean and =3.2 =2.3 =1.1 standard deviation =0.5 =0.4 =0.4 Question 2: Frequencies NS: 15 NS: 11 NS: 7 MS: 7 MS: 8 […]
Chapter 25 1 Dpts 147 The Four Components The Multiplicative
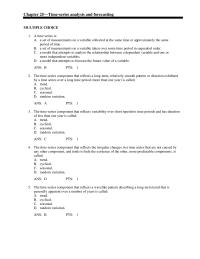
Chapter 25—Time-series analysis and forecasting MULTIPLE CHOICE 1. A time series is: A. a set of measurements on a variable collected at the same time or approximately the same period of time. B. a set of measurements on a variable […]
Chapter 25 2 The Following Seasonal Indexes And Trend Line
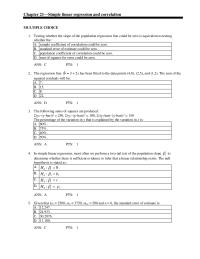
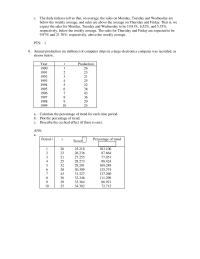
8. Annual production (in millions) of computer chips in a large electronics company was recorded, as shown below. Year t Production 1990 1 26 1991 2 23 1992 3 21 1993 4 25 1994 5 32 1995 6 38 1996 […]
Chapter 25 3 Use Excel Calculate Y For Each Value
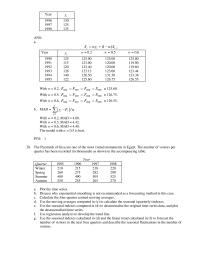
Year t y 1996 130 1997 125 1998 135 28. The Pyramids of Giza are one of the most visited monuments in Egypt. The number of visitors per quarter has been recorded (in thousands) as shown in the accompanying table: […]
Chapter 26 1 The Australian Bureau of Statistics regularly publishes
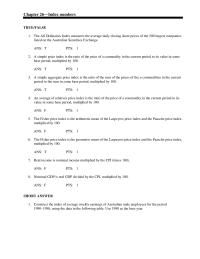
ANS: T PTS: 1 ANS: T PTS: 1 ANS: F PTS: 1 ANS: F PTS: 1 ANS: T PTS: 1 ANS: F PTS: 1 ANS: F PTS: 1 Chapter 26—Index numbers TRUE/FALSE 1. The All Ordinaries Index measures the average […]
Chapter 27 1 Emv 22million Design Would The Best Alternative
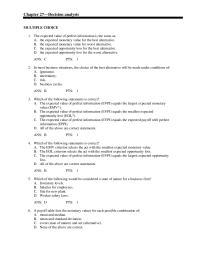
Chapter 27—Decision analysis MULTIPLE CHOICE 1. The expected value of perfect information is the same as: A. the expected monetary value for the best alternative. B. the expected monetary value for worst alternative. C. the expected opportunity loss for the […]
Chapter 4 1 The Mean Fifty Sales Receipts
Chapter 4—Numerical descriptive measures MULTIPLE CHOICE 1. Which of the following statements about the arithmetic mean is not always correct? A . The sum of the deviations from the mean is zero. B . Half of the observations are on […]
Chapter 4 2 The Following Data Represent The Ages In
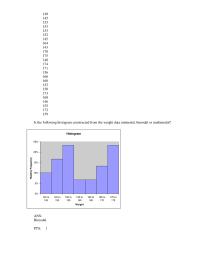
149 145 153 153 153 152 145 164 143 170 175 148 174 171 156 166 168 152 150 173 168 146 155 172 159 Is the following histogram constructed from the weight data unimodal, bimodal or multimodal? Histogram 0% […]
Chapter 4 3 Calculate The Interquartile Ranged What Does The
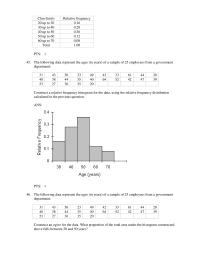
45. The following data represent the ages (in years) of a sample of 25 employees from a government department: 31 43 56 23 49 42 33 61 44 28 48 38 44 35 40 64 52 42 47 39 53 […]
Chapter 5 1 Given That Events And Are
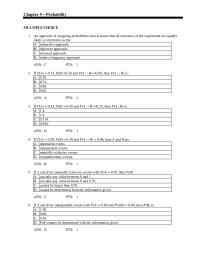
Chapter 5—Probability MULTIPLE CHOICE 1. An approach of assigning probabilities that assumes that all outcomes of the experiment are equally likely is referred to as the: A. subjective approach. B. objective approach. C. classical approach. D. relative frequency approach. 2. […]
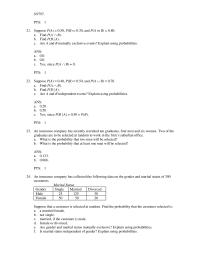
Chapter 5 2 The Client Selected Maleb The Client Selected
21. Suppose P(A) = 0.50, P(B) = 0.30, and P(A or B) = 0.80. a. Find P(A B). b. Find P(B | A). c. Are A and B mutually exclusive events? Explain using probabilities. ANS: a. 0.0. b. 0.0. […]
Chapter 6 1 Data Published The United Nations Statistical Divisionans
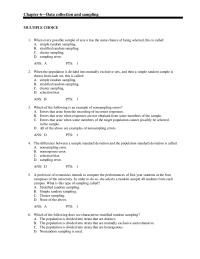
Chapter 6—Data collection and sampling MULTIPLE CHOICE 1. When every possible sample of size n has the same chance of being selected, this is called: A. simple random sampling. B. stratified random sampling. C. cluster sampling. D. sampling error. 2. […]
Chapter 7 1 Find The Mean And Standard Deviation The
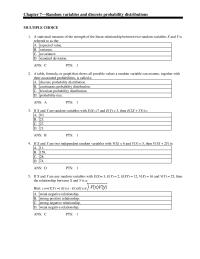
Chapter 7—Random variables and discrete probability distributions MULTIPLE CHOICE 1. A statistical measure of the strength of the linear relationship between two random variables X and Y is referred to as the: A. expected value. B. variance. C. covariance. D. […]
Chapter 8 2 What Are The Mean And Standard Deviation
25. The mean and the standard deviation of an exponential distribution are equal to each other. 26. If the random variable X is exponentially distributed and the parameter of the distribution = 4, then P(X 0.25) = 0.3679. […]
Chapter 8 The variable 5X is also normally distributed
Chapter 8—Continuous probability distributions MULTIPLE CHOICE 1. Given that Z is a standard normal random variable, P(–1.3 Z 1.8) is: A. 0.4032. B. 0.5248. C. 0.8673. D. 0.4641. 2. Given that Z is a standard normal variable, the […]