Chapter 26—Index numbers
TRUE/FALSE
1. The All Ordinaries Index measures the average daily closing share prices of the 500 largest companies
listed on the Australian Securities Exchange.
2. A simple price index is the ratio of the price of a commodity in the current period to its value in some
base period, multiplied by 100.
3. A simple aggregate price index is the ratio of the sum of the prices of the n commodities in the current
period to the sum in some base period, multiplied by 100.
4. An average of relatives price index is the ratio of the price of a commodity in the current period to its
value in some base period, multiplied by 100.
5. The Fisher price index is the arithmetic mean of the Laspeyres price index and the Paasche price index,
multiplied by 100.
6. The Fisher price index is the geometric mean of the Laspeyres price index and the Paasche price index,
multiplied by 100.
7. Real income is nominal income multiplied by the CPI (times 100).
8. Nominal GDP is real GDP divided by the CPI, multiplied by 100.
SHORT ANSWER
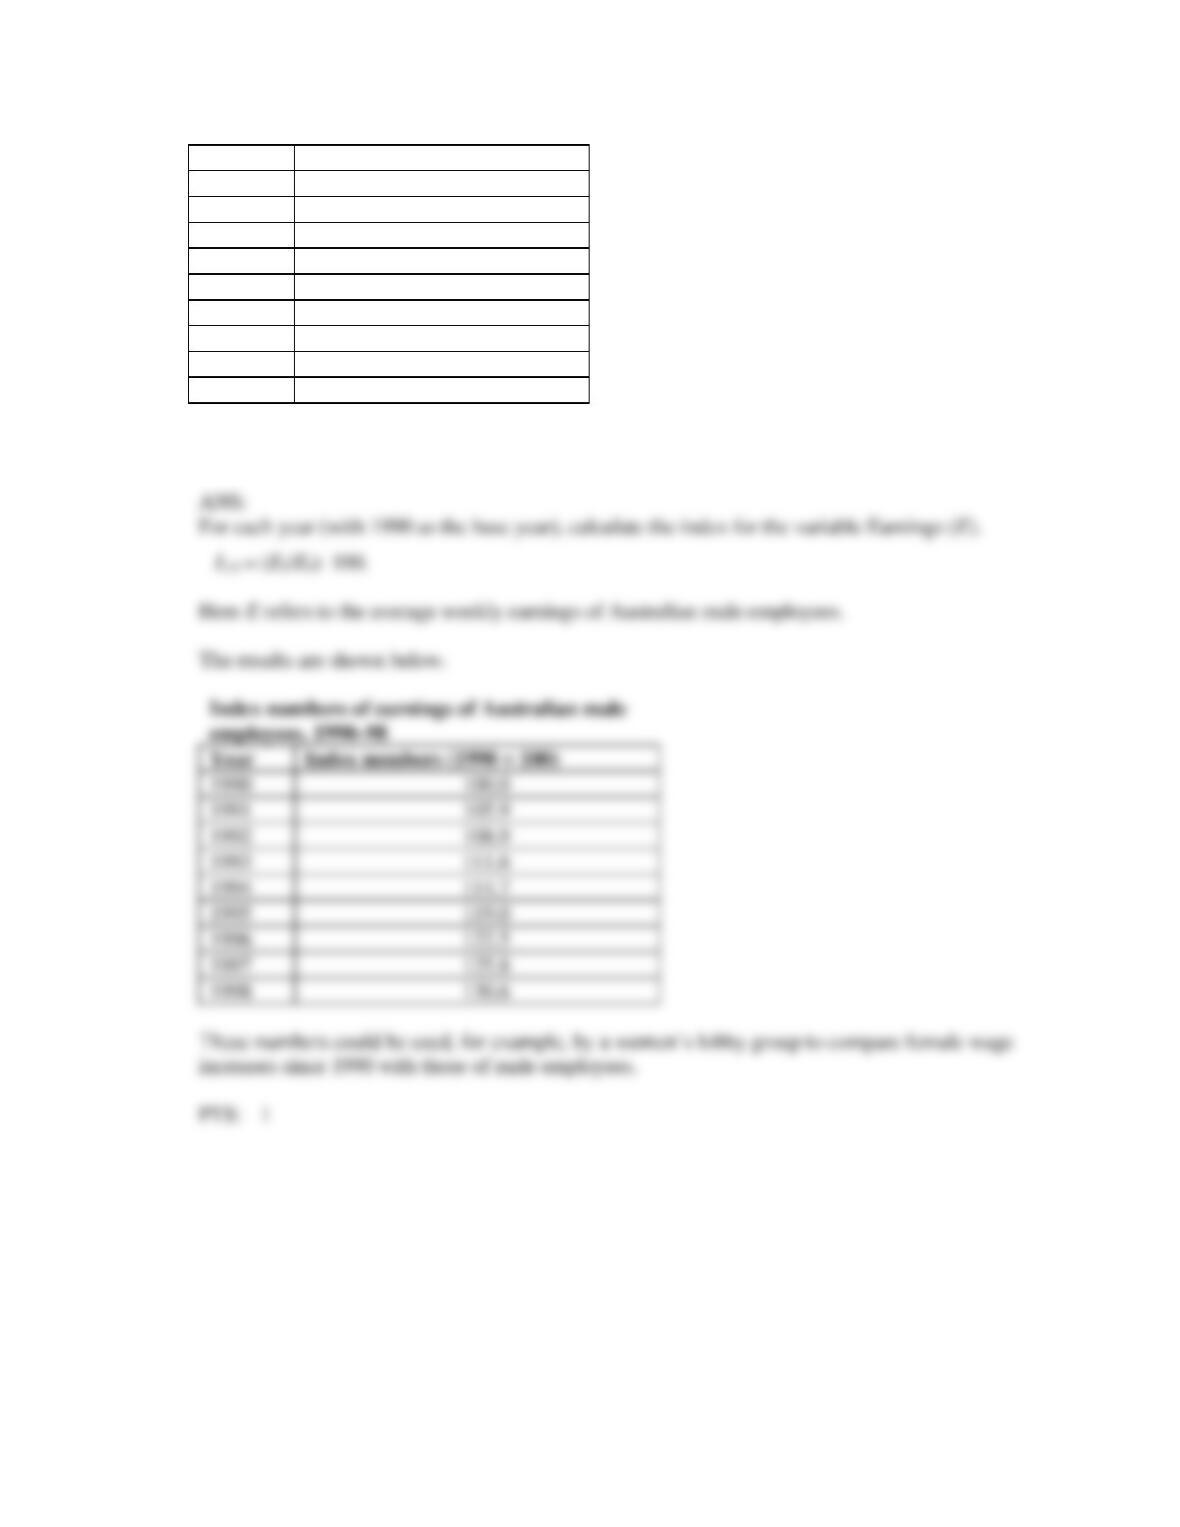
1. Construct the index of average weekly earnings of Australian male employees for the period
1990–1998, using the data in the following table. Use 1990 as the base year.
Average weekly earnings of Australian
male employees, 1990–98
Year
Average earnings ($)
1990
542.30
1991
574.10
1992
590.35
1993
605.23
1994
621.95
1995
645.10
1996
664.28
1997
682.35
1998
708.30
Source: Australian Bureau of Statistics, Australian Economic Indicators, ABS Cat. No. 1350.0, ABS,
Canberra.
2. The Australian Bureau of Statistics regularly publishes the average retail prices of selected items for
each Australian capital city. The following table presents the prices of oranges, bananas, potatoes,
tomatoes, carrots and onions in Melbourne during the June quarter in 2008 and 2010.
employees, 1990–98
Year
Index numbers (1990 = 100)
1990
1991
1992
1993
1994
1995
1996
1997
1998
Fruit and vegetable prices ($/kg)
Item
June 2008
June 2010
Oranges
2.98
2.95
Bananas
2.32
2.37
Potatoes
2.69
2.44
Tomatoes
3.72
4.59
Carrots
2.20
1.95
Onions
2.57
2.35
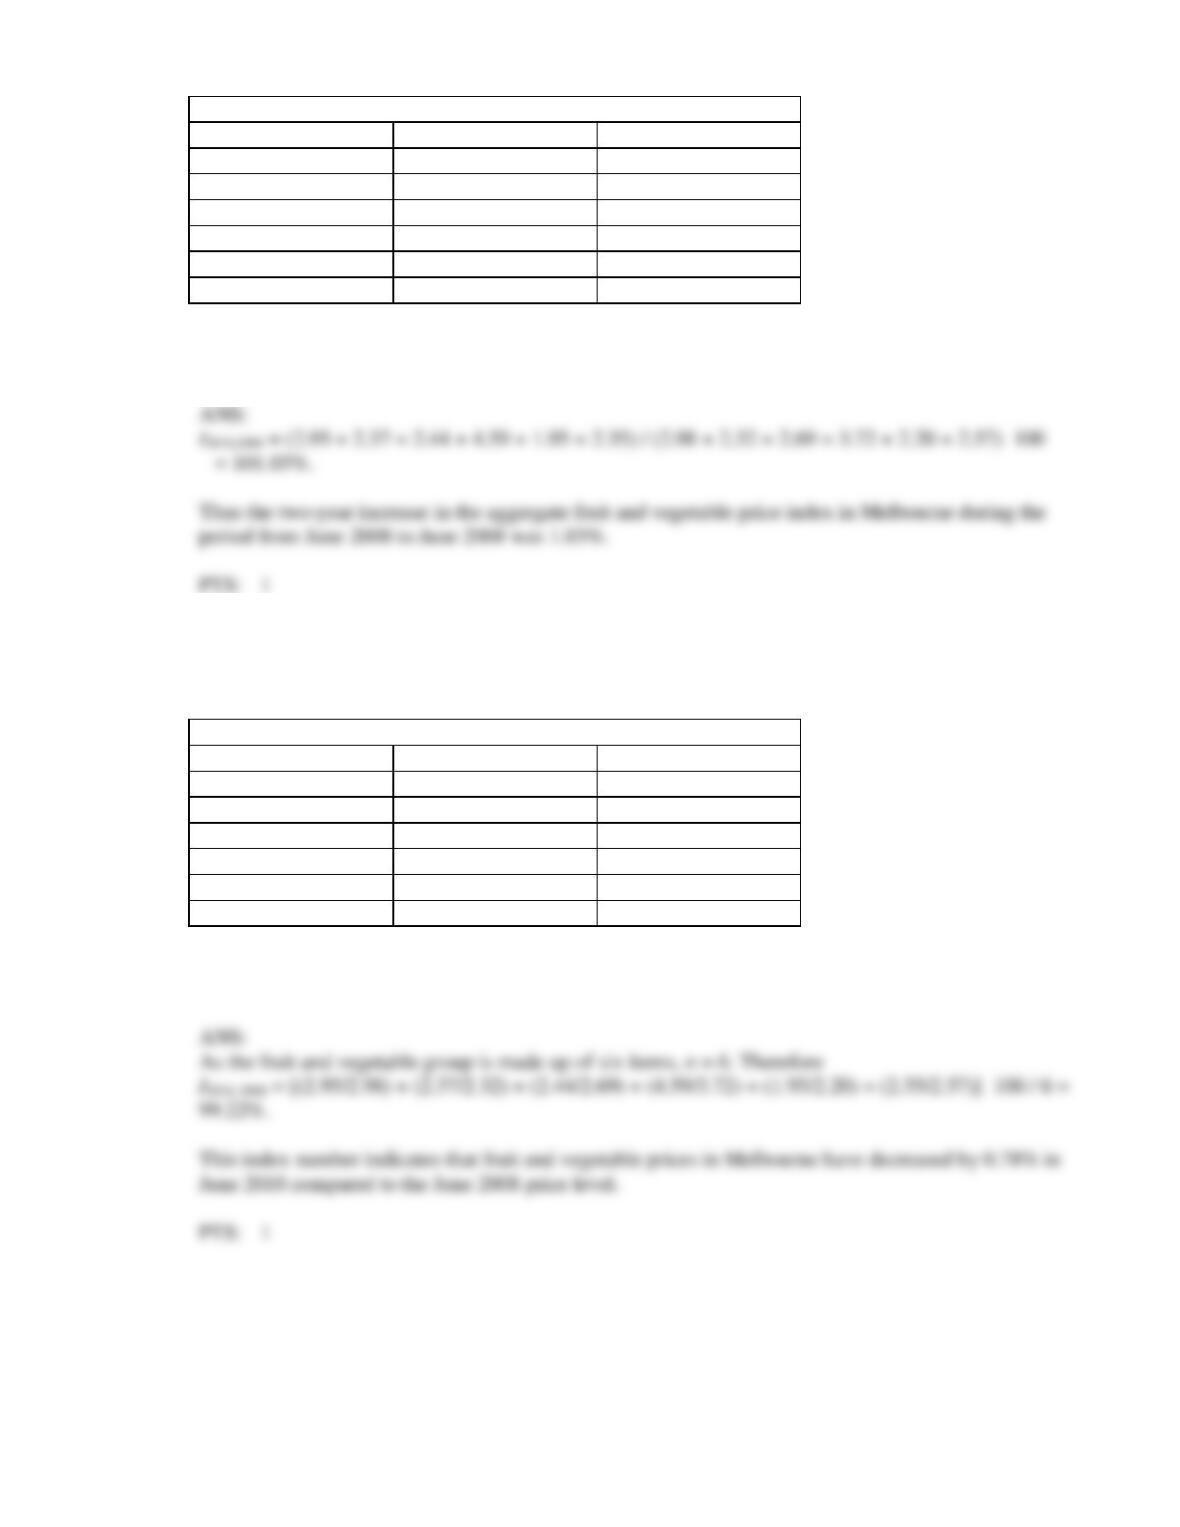
Construct a simple aggregate index of the prices for the fruit and vegetable group using June 2008 as
the base period.
3. The Australian Bureau of Statistics regularly publishes the average retail prices of selected items for
each Australian capital city. The following table presents the prices of oranges, bananas, potatoes,
tomatoes, carrots and onions in Melbourne during the June quarter in 2008 and 2010.
Fruit and vegetable prices ($/kg)
Item
June 2008
June 2010
Oranges
2.98
2.95
Bananas
2.32
2.37
Potatoes
2.69
2.44
Tomatoes
3.72
4.59
Carrots
2.20
1.95
Onions
2.57
2.35
Construct the average of relative price indexes for the fruit and vegetable group for June 2010 (with
base June 2008 = 100).
4. In September 1997, a Brisbane family’s weekly diet consisted of 6 kg of fish, 2 kg of beef and 2 kg of
veal. One year later, because of the cost increases in these products, the family’s diet has changed so
that each week they consume 4 kg of chicken and 1 kg each of beef, veal, pork and fish. The prices are
listed in the table below.
September 1997
September 1998
Price ($)
Quantity (kg)
Price ($)
Quantity (kg)
Item
pi,1997
qi,1997
pi,1998
qi,1998
Beef
5.50
2
5.92
1
Veal
7.48
2
8.06
1
Pork
4.80
0
5.05
1
Chicken
3.62
0
3.45
4
Fish
5.13
6
6.25
1
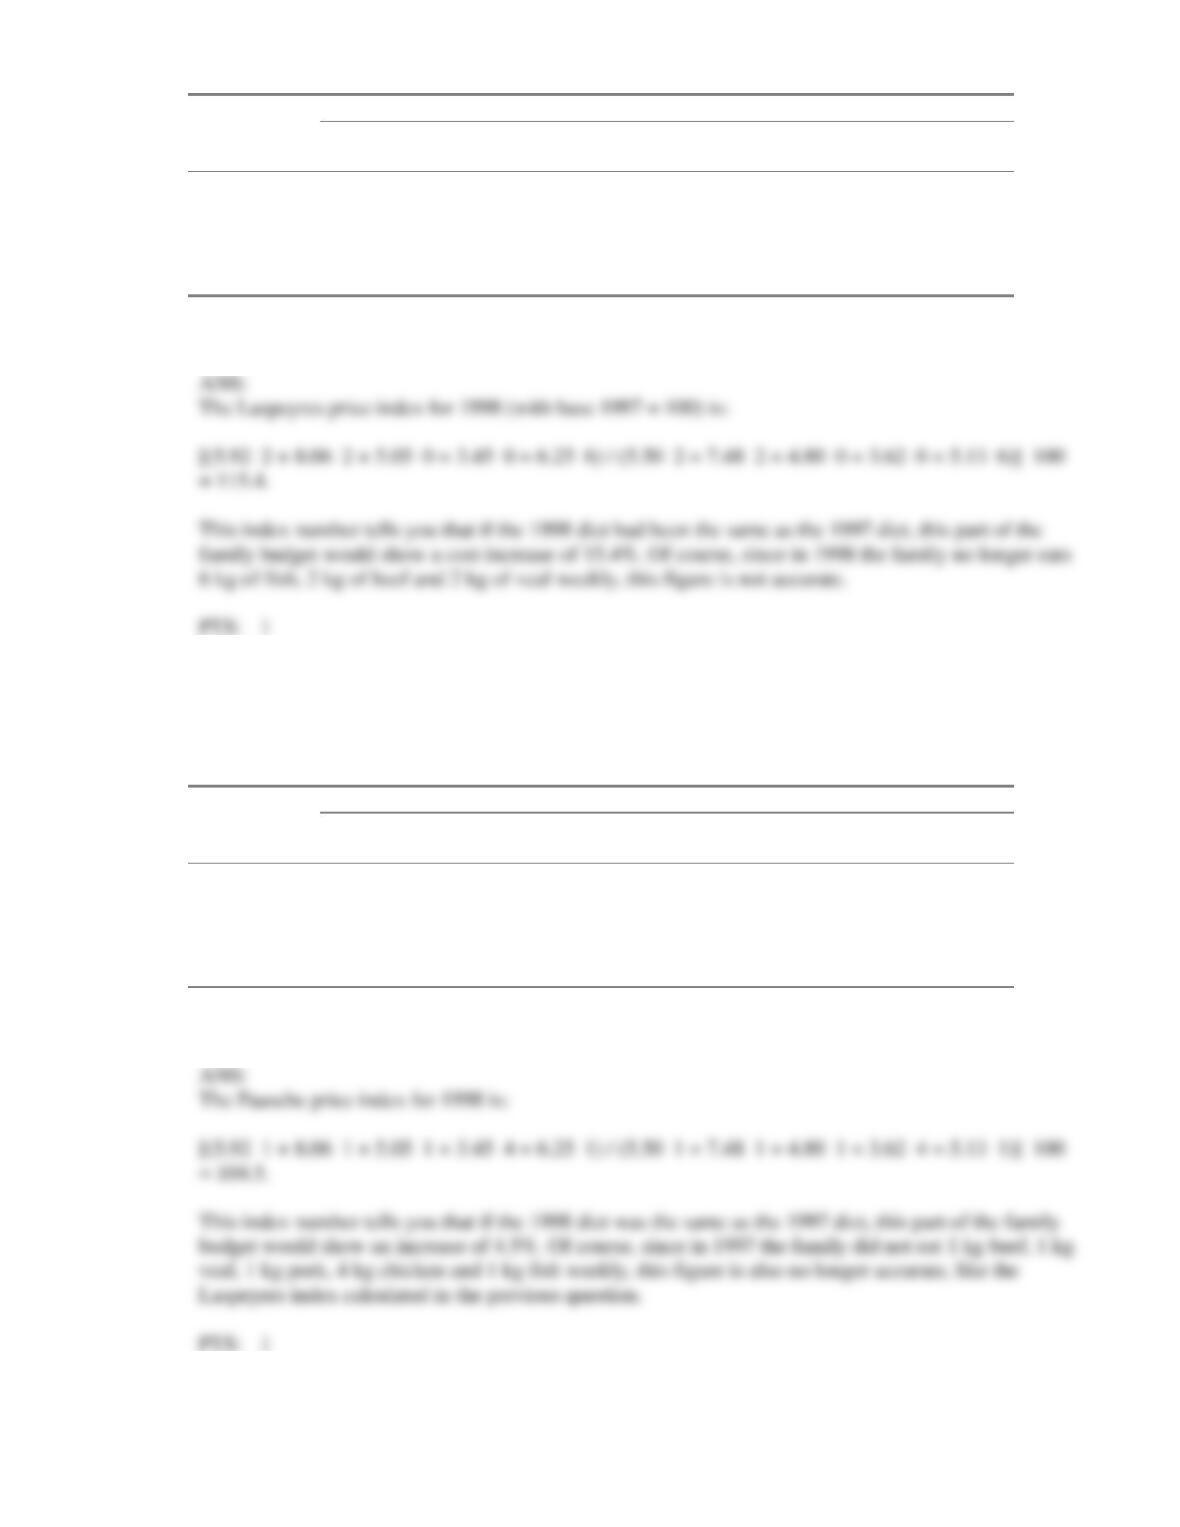
Calculate the Laspeyres price index for 1998, using 1997 as the base.
5. In September 1997, a Brisbane family’s weekly diet consisted of 6 kg of fish, 2 kg of beef and 2 kg of
veal. One year later, because of the cost increases in these products, the family’s diet has changed so
that each week they consume 4 kg of chicken and 1 kg each of beef, veal, pork and fish. The prices are
listed in the table below.
September 1997
September 1998
Price ($)
Quantity (kg)
Price ($)
Quantity (kg)
Item
pi,1997
qi,1997
pi,1998
qi,1998
Beef
5.50
2
5.92
1
Veal
7.48
2
8.06
1
Pork
4.80
0
5.05
1
Chicken
3.62
0
3.45
4
Fish
5.13
6
6.25
1
Calculate the Paasche price index for 1998, using 1997 as the base.
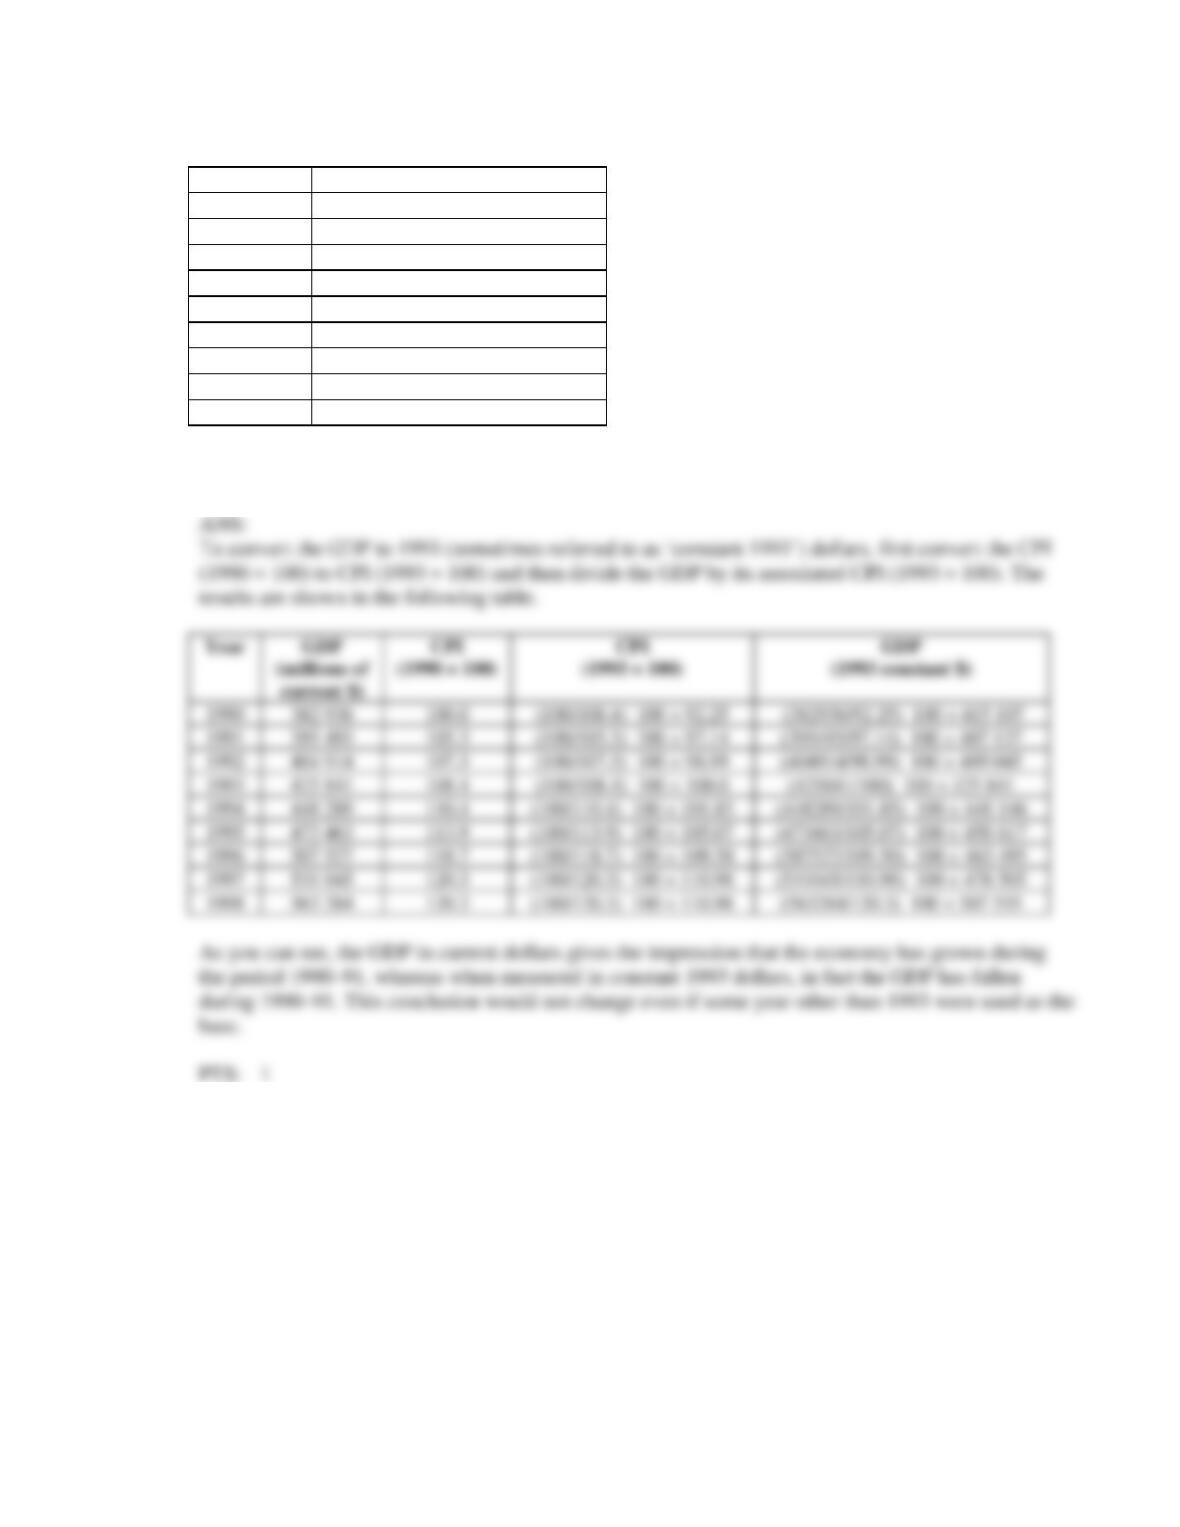
6. The gross domestic product is often used as a measure of the economic performance of a country. The
annual GDP of Australia for the years 1990–98 is shown in the following table. Use the CPI in Table
23.2 in the textbook (pp 966–7) to deflate these figures to 1993 dollars.
Year
GDP (millions of current $)
1990
382 936
1991
395 493
1992
404 914
1993
425 841
1994
448 289
1995
473 463
1996
507 527
1997
531 045
1998
563 284
Source: Australian Bureau of Statistics, Australian Economic Indicators, ABS Cat. No. 1350.0, ABS,
Canberra.
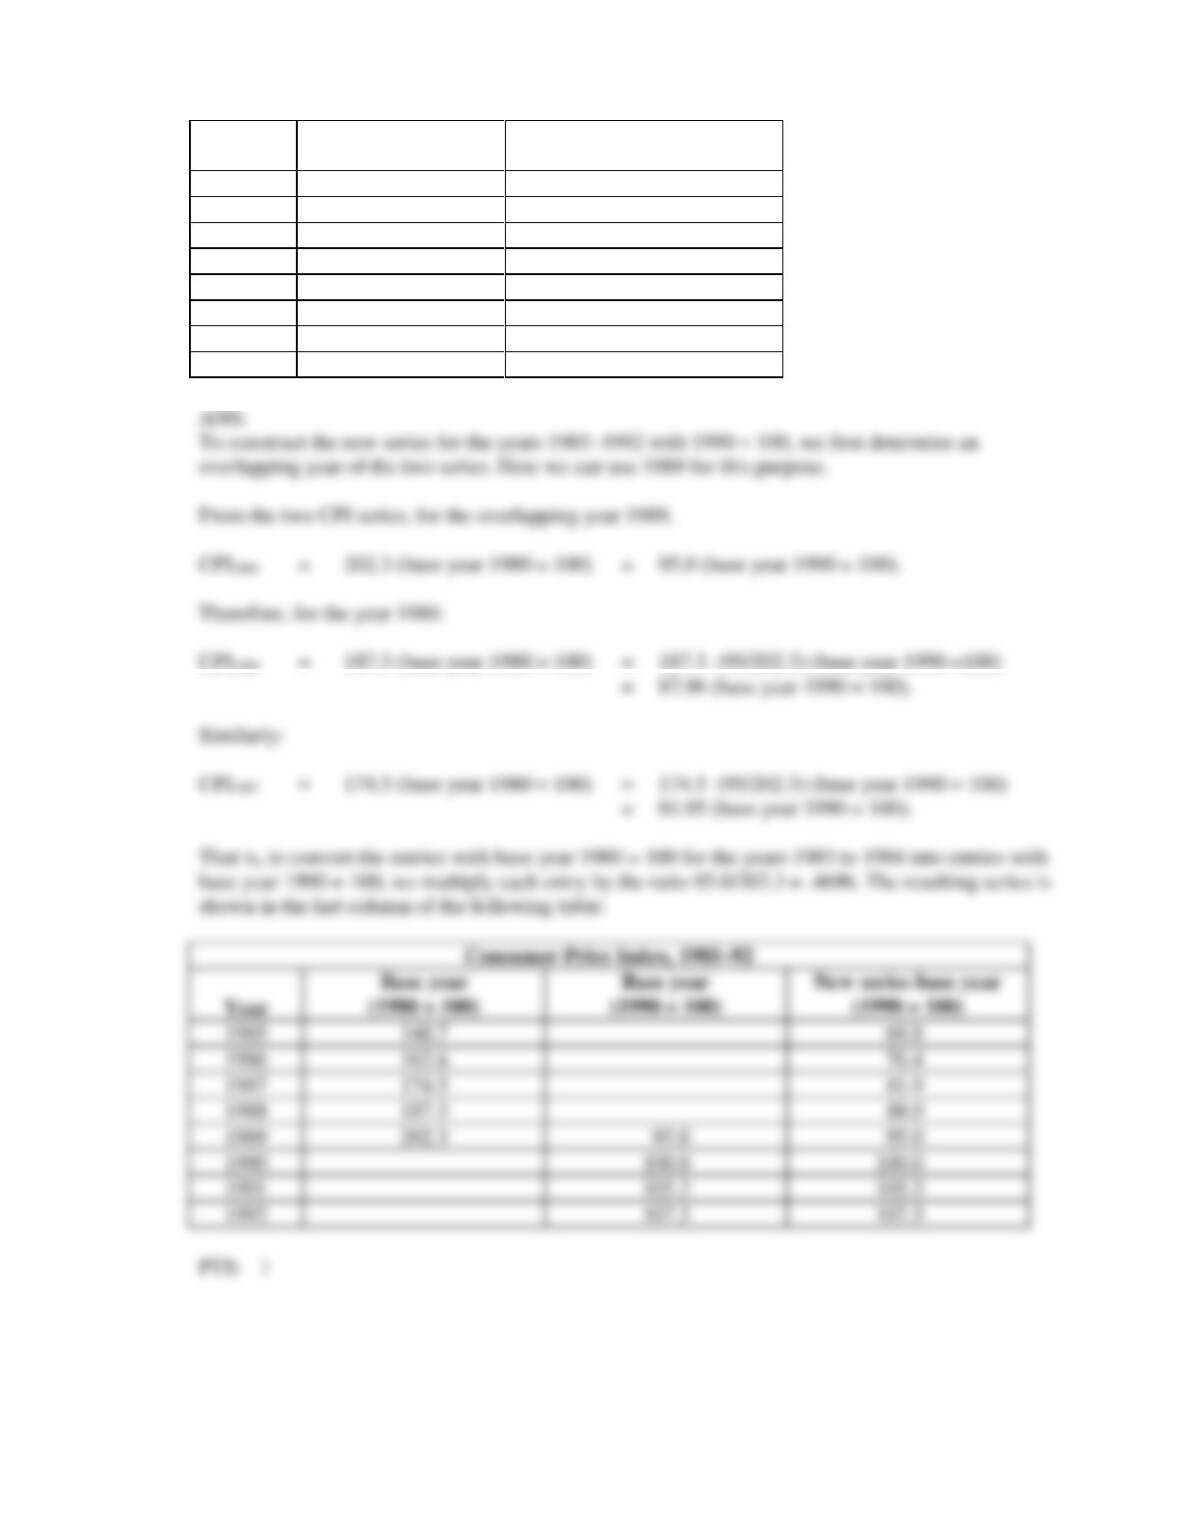
7. The following are the two CPI series (one for 1985–1989 with base 1980 = 100 and the other for
1989–1992 with base 1990 = 100) published in various issues of ABS publications. Create a new CPI
series for the period 1985–1992 with 1990 as the base year.
Consumer price index with different base periods, Australia
Year
Base period
(1980 = 100)
Base period
(1990 = 100)
1985
148.7
1986
162.6
1987
174.5
1988
187.3
1989
202.3
95.0
1990
100.0
1991
105.3
1992
107.3