Chapter 4—Numerical descriptive measures
MULTIPLE CHOICE
1. Which of the following statements about the arithmetic mean is not always correct?
A
.
The sum of the deviations from the mean is zero.
B
.
Half of the observations are on either side of the mean.
C
.
The mean is a measure of the middle (centre) of a distribution.
D
.
The value of the mean times the number of observations equals the sum of all of the
observations.
2. In a histogram, the proportion of the total area that must be to the left of the median is:
A
.
exactly 0.50.
B
.
less than 0.50 if the distribution is skewed to the left.
C
.
more than 0.50 if the distribution is skewed to the right.
D
.
between 0.25 and 0.60 if the distribution is symmetric and unimodal.
3. Which of the following statements is true?
A
.
The sum of the deviations from the arithmetic mean is always zero.
B
.
The sum of the squared deviations from the arithmetic mean is always zero.
C
.
The arithmetic mean is always less than the geometric mean.
D
.
The standard deviation is always smaller than the variance.
E
.
The distance between the first and third quartiles is twice the distance between the first
quartile and the median.
4. If two data sets have the same range:
A
.
the distances from the smallest to the largest observations in both sets will be the same.
B
.
the smallest and largest observations are the same in both sets.
C
.
both sets will have the same mean.
D
.
both sets will have the same interquartile range.
5. Which of the following statements is true?
A
.
When the distribution is skewed to the left, mean > median > mode.
B
.
When the distribution is skewed to the right, mean < median < mode.
C
.
When the distribution is symmetric and unimodal, mean = median = mode.
D
.
When the distribution is symmetric and bimodal, mean = median = mode.
6. The sample mean is preferred to the sample median when:
A
.
the data is quantitative and ranked.
B
.
the aim is to measure the variability in a data set.
C
.
the median does not exist.
D
.
the data is quantitative and there are some extreme values in a data set.
7. A sample of 16 observations has a standard deviation of 2. The sum of the squared deviations from the
sample mean is:
A
.
60.
B
.
64.
C
.
30.
D
.
16.
8. Which measure of central location is meaningful when the data are categorical?
A
.
The arithmetic mean.
B
.
The geometric mean.
C
.
The median.
D
.
The mode.
9. Which of the following are measures of the linear relationship between two variables?
A
.
The covariance.
B
.
The coefficient of correlation.
C
.
The variance.
D
.
Both A and B.
10. If the relationship between two variables can be illustrated without error with a straight line sloping
upward then the correlation coefficient between the two variables is equal to:
A
.
1.
B
.
–1.
C
.
0.
D
.
0.5.
11. Generally speaking, if two variables are unrelated (as one increases, the other shows no pattern), the
correlation coefficient between them will be:
A
.
close to 1.
B
.
close to –1.
C
.
equal to the product of their standard deviations.
D
.
none of the above.
12. Which measure of variability is appropriate when a sample is likely to contain one or several extreme
values?
A
.
The variance.
B
.
The standard deviation.
C
.
The interquartile range.
D
.
The range.
13. Chebyshev’s theorem states that the percentage of measurements in a data set that fall within three
standard deviations of their mean is:

A
.
75%.
B
.
at least 75%.
C
.
89%.
D
.
at least 89%.
14. The empirical rule states that the approximate percentage of measurements in a data set (provided that
the data set has a bell-shaped distribution) that fall within two standard deviations of their mean is
approximately:
A
.
68%.
B
.
75%.
C
.
95%.
D
.
99%.
15. Since the population is always larger than the sample, the population mean:
A
.
is always larger than the sample mean.
B
.
is always smaller than the sample mean.
C
.
is always larger than or equal to the sample mean.
D
.
is always smaller than or equal to the sample mean.
E
.
can be smaller than, or larger than, or equal to the sample mean.
16. Which of the following summary measures is affected by outliers?
A
.
The median.
B
.
The interquartile range.
C
.
The range.
D
.
The mode.
17. Which of the following summary measures cannot be easily approximated from a box-and-whisker
plot?

A
.
The range.
B
.
The interquartile range.
C
.
The second quartile.
D
.
The standard deviation.
E
.
All of the above.
18. The average score for a class of 30 students was 75. The 20 male students in the class averaged 70.
The female students in the class averaged:
A
.
75.
B
.
85.
C
.
65.
D
.
70.
E
.
80.
19. Which of the following is not a measure of variability?
A
.
The range.
B
.
The variance.
C
.
The arithmetic mean.
D
.
The standard deviation.
E
.
The interquartile range.
20. The length of the box in the box-and-whisker plot portrays the:
A
.
median.
B
.
interquartile range.
C
.
range.
D
.
third quartile.
21. Expressed in percentiles, the interquartile range is the difference between the:
A
.
10% and 90% values.
B
.
25% and 75% values.
C
.
15% and 85% values.
D
.
30% and 70% values.
22. Which of the following statements is true for the following data values: 7, 5, 6, 4, 7, 8 and 12?
A
.
The mean, median and mode are all equal.
B
.
Only the mean and median are equal.
C
.
Only the mean and mode are equal.
D
.
Only the median and mode are equal.
TRUE/FALSE
1. Two classifications of statistical descriptions are measures of central location and measures of
variability.
2. The mean is the most frequently used measure of central location for quantitative data.
3. Measures of variability describe typical values in the data.
4. Lily has been keeping track of what she spends on eating out. The last week’s expenditures for meals
eaten out were $5.69, $5.95, $6.19, $10.91, $7.49, $14.53 and $7.66. The mean amount Lily spends on
meals is $8.35.
5. A data sample has a mean of 107, a median of 122 and a mode of 134. The distribution of the data is
positively skewed.
6. A student scores 87, 73, 92 and 86 on four exams during the semester, and 95 on the final exam. If the
final is weighted double and the four others weighted equally, the student’s final average would be 88.
7. In a bell-shaped distribution, there is no difference in the values of the mean, median and mode.
8. The mean is a measure of the deviation in a data set.
9. In a positively skewed distribution, the mean is larger than the median and the median is larger than
the mode.
10. In a negatively skewed distribution, the mean is smaller than the median and the median is smaller
than the mode.
11. The difference between the largest and smallest values in an ordered array is called the range.
12. Quartiles divide the values in a data set into four parts of equal size.
13. The range is considered the weakest measure of variability.
14. The coefficient of variation allows us to compare two sets of data based on different measurement
units.
15. The value of the standard deviation will always exceed that of the variance.
16. Chebyshev’s theorem applies only to data sets that have a mound-shaped distribution.
17. The interquartile range is found by taking the difference between the 1st and 3rd quartiles and dividing
that value by 2.
18. The standard deviation is expressed in terms of the original units of measurement, but the variance is
not.
19. The value of the standard deviation may be either positive or negative, while the value of the variance
will always be positive.
20. While Chebyshev’s theorem applies to any distribution, regardless of shape, the empirical rule applies
only to distributions that are bell-shaped and symmetrical.
21. The mean of fifty sales receipts is $65.75 and the standard deviation is $10.55. Using Chebyshev’s
theorem, at least 75% of the sales receipts were between $44.65 and $86.85.
22. The median of a set of data would be more representative than the mean of that data set when the
average of the data values is larger than most of the values.
23. If the coefficient of correlation r = +1, then the best-fit linear equation will actually be satisfied by all
of the data points.
24. The standard deviation is the square of the variance.
25. According to Chebyshev’s theorem, at least 93.75% of observations should fall within 4 standard
deviations of the mean.
26. The coefficient of correlation indicates the direction and the strength of the linear relationship between
two variables.
27. If the coefficient of correlation r = 0, then there is no linear relationship whatsoever between the
dependent variable y and the independent variable x.
28. Chebyshev’s theorem states that the percentage of observations in a data set that should fall within 5
standard deviations of their mean is at least 96%.
29. The empirical rule states that the percentage of observations in a data set (provided that the data set has
a bell-shaped and symmetric distribution) that fall within one standard deviation of their mean is
approximately 75%.
30. Since the sample is always smaller than the population, the sample mean is always smaller than the
population mean.
31. The length of the box in the box-and-whisker plot portrays the interquartile range.
32. Expressed in percentiles, the interquartile range is the difference between the 25th and 75th percen-
tiles.
33. A sample of 15 observations has a standard deviation of 4. The sum of the squared deviations from the
sample mean is 60.
34. A perfect straight line parallel to the horizontal axis would produce a correlation coefficient value of
one.
35. When the standard deviation is expressed as a percentage of the mean, the result is the coefficient of
correlation.
36. The value of the mean times the number of observations equals the sum of all of the observations.
37. In a histogram, the proportion of the total area that must be to the left of the median is less than 0.50 if
the distribution is skewed to the left.
38. In a histogram, the proportion of the total area that must be to the left of the median is more than 0.50
if the distribution is skewed to the right.
39. If two data sets have the same range, the distances from the first quartile to the third quartile in the two
data sets are the same.
40. In a histogram, the proportion of the total area that must be to the right of the mean is exactly 0.50 if
the distribution is symmetric and unimodal.
41. The disadvantage of the variance compared to the standard deviation is that the unit attached to the
variance is the squared unit of the original measurements, while the standard deviation is expressed in
the same units as the original measurements.
42. Generally speaking, if two variables have a strong positive linear relationship, the covariance between
them is equal to one.
43. The sum of the deviations from the median is always zero.
44. The mode is a measure of variability for qualitative data.
45. Percentiles can be converted into quintiles and deciles, where quintiles divide the data into fifths and
deciles divide the data into tenths.
46. The interquartile range is the difference between the 25th and 75th percentiles.
SHORT ANSWER
1. Monthly rent data in dollars for a sample of 10 one-bedroom apartments in Perth are given below:
220
200
230
215
235
250
260
210
265
250
a. Compute the sample monthly average rent.
b. Compute the sample median.
c. What is the mode?
2. A sample of 25 families were asked how many pets they owned. Their responses are summarised in
the following table.
Number of pets
0
1
2
3
4
5
Number of families
3
10
5
4
2
1
a. Determine the mean, the median and the mode of the number of pets owned per family.
b. Describe briefly what each statistic in part (a) tells you about the data.
3. What are the relative magnitudes of the mean, median and mode for a unimodal distribution that is:
a. symmetrical?
b. skewed to the left?
c. skewed to the right?
4. A basketball player has the following points for seven games: 20, 25, 32, 18, 19, 22, 30. Compute the
following measures of central location and variability:
a. mean.
b. median.
c. standard deviation.
d. coefficient of variation.
The following data represent the numbers of bedrooms in a sample of 10 suburban houses in Mel-
bourne:
3
3
2
2
4
5
2
5
4
2
Use these data to answer the following question/s.
5. a. Compute the mean.
b. Compute the median.
6. a. Compute the range.
b. Compute the variance.
c. Compute the standard deviation.
7. Compute the coefficient of variation.
8. The following data represent the weights (in kilograms) of a sample of 30 horses:
Weight
165
175
150
155
173
149
145
153
153
153
152
145
164
143
170
175
148
174
171
156
166
168
152
150
173
168
146
155
172
159
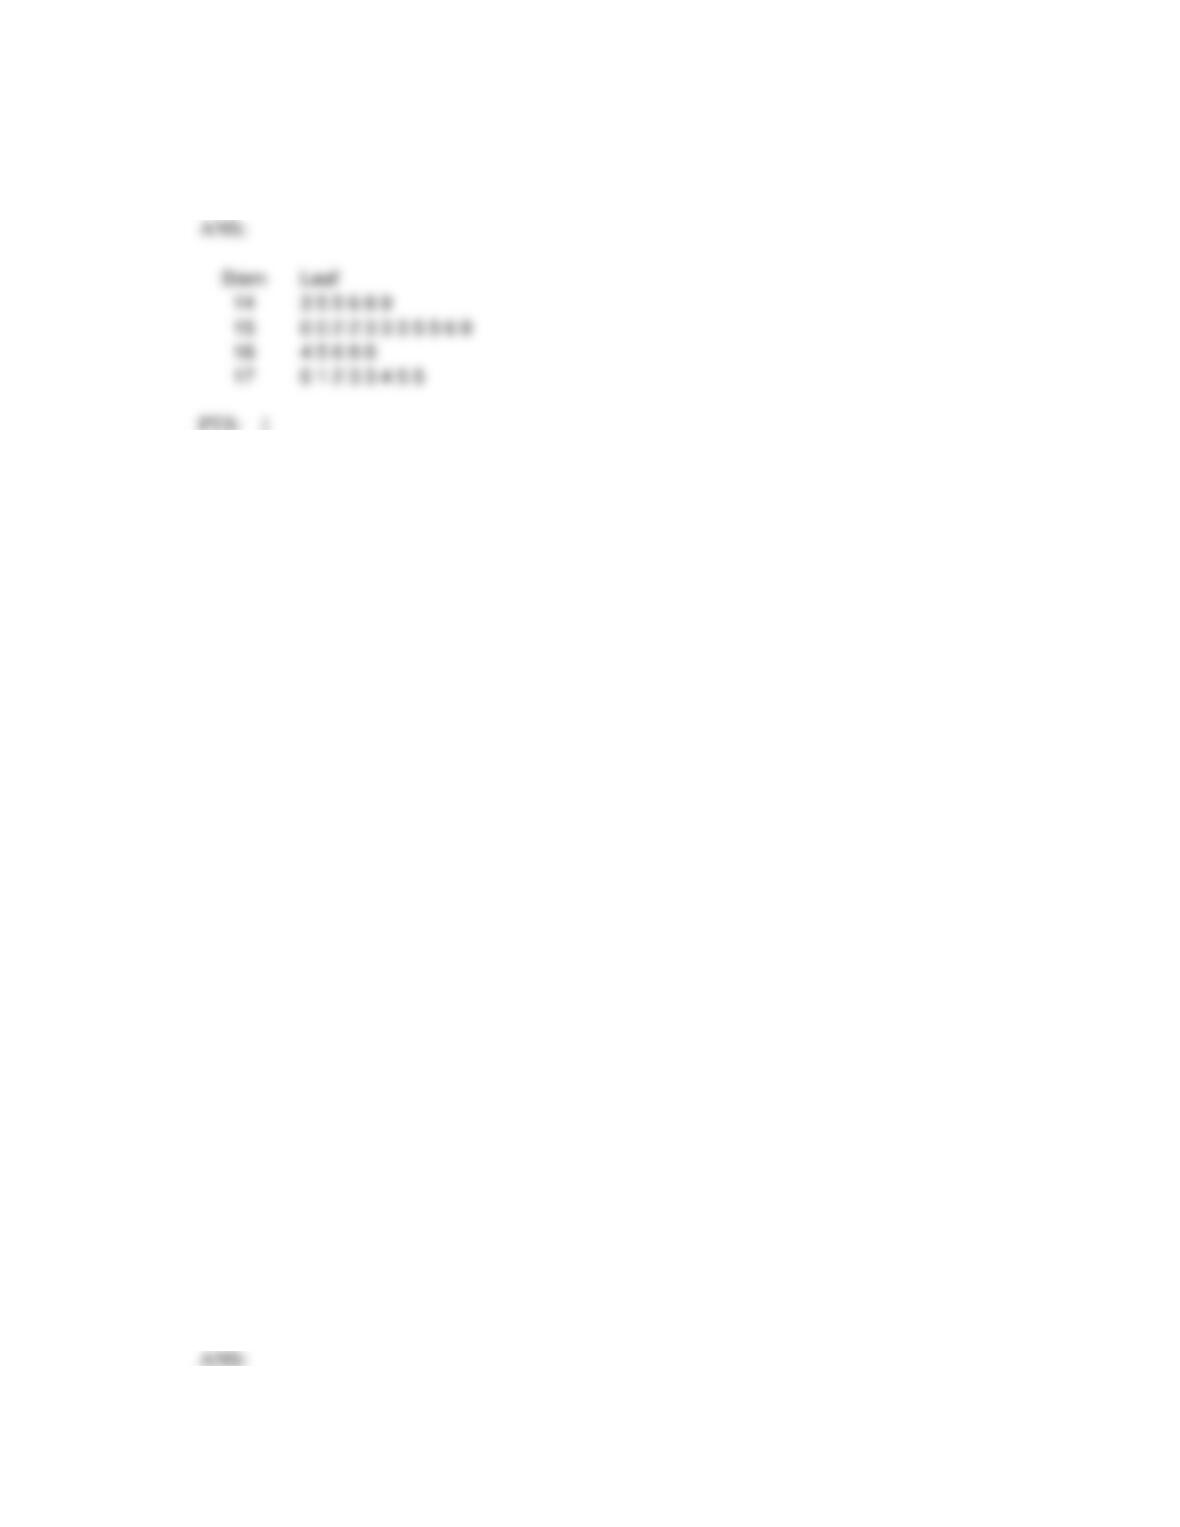
Construct a stem-and-leaf display for the weights.
9. The following data represent the weights (in kilograms) of a sample of 30 horses:
Weight
165
175
150
155
173
149
145
153
153
153
152
145
164
143
170
175
148
174
171
156
166
168
152
150
173
168
146
155
172
159
Find the median weight.
10. The following data represent the weights (in kilograms) of a sample of 30 horses:
Weight
165
175
150
155
173
149
145
153
153
153
152
145
164
143
170
175
148
174
171
156
166
168
152
150
173
168
146
155
172
159
Determine the location and value of the lower quartile of the weights.
11. The following data represent the weights (in kilograms) of a sample of 30 horses:
Weight
165
175
150
155
173
149
145
153
153
153
152
145
164
143
170
175
148
174
171
156
166
168
152
150
173
168
146
155
172
159
Determine the location and value of the upper quartile of the weights.
12. The following data represent the weights (in kilograms) of a sample of 30 horses:
Weight
165
175
150
155
173
149
145
153
153
153
152
145
164
143
170
175
148
174
171
156
166
168
152
150
173
168
146
155
172
159
Determine the location and value of the 65th percentile of the weights.
13. The following data represent the weights (in kilograms) of a sample of 30 horses:
Weight
165
175
150
155
173
149
145
153
153
153
152
145
164
143
170
175
148
174
171
156
166
168
152
150
173
168
146
155
172
159
Compute the sample mean weight.
14. The following data represent the weights (in kilograms) of a sample of 30 horses:
Weight
165
175
150
155
173
149
145
153
153
153
152
145
164
143
170
175
148
174
171
156
166
168
152
150
173
168
146
155
172
159
Compute the sample variance and sample standard deviation.
15. The following data represent the weights (in kilograms) of a sample of 30 horses:
Weight
165
175
150
155
173
149
145
153
153
153
152
145
164
143
170
175
148
174
171
156
166
168
152
150
173
168
146
155
172
159
Compute the range and interquartile range of the data.
16. The following data represent the weights (in kilograms) of a sample of 30 horses:
Weight
165
175
150
155
173
149
145
153
153
153
152
145
164
143
170
175
148
174
171
156
166
168
152
150
173
168
146
155
172
159
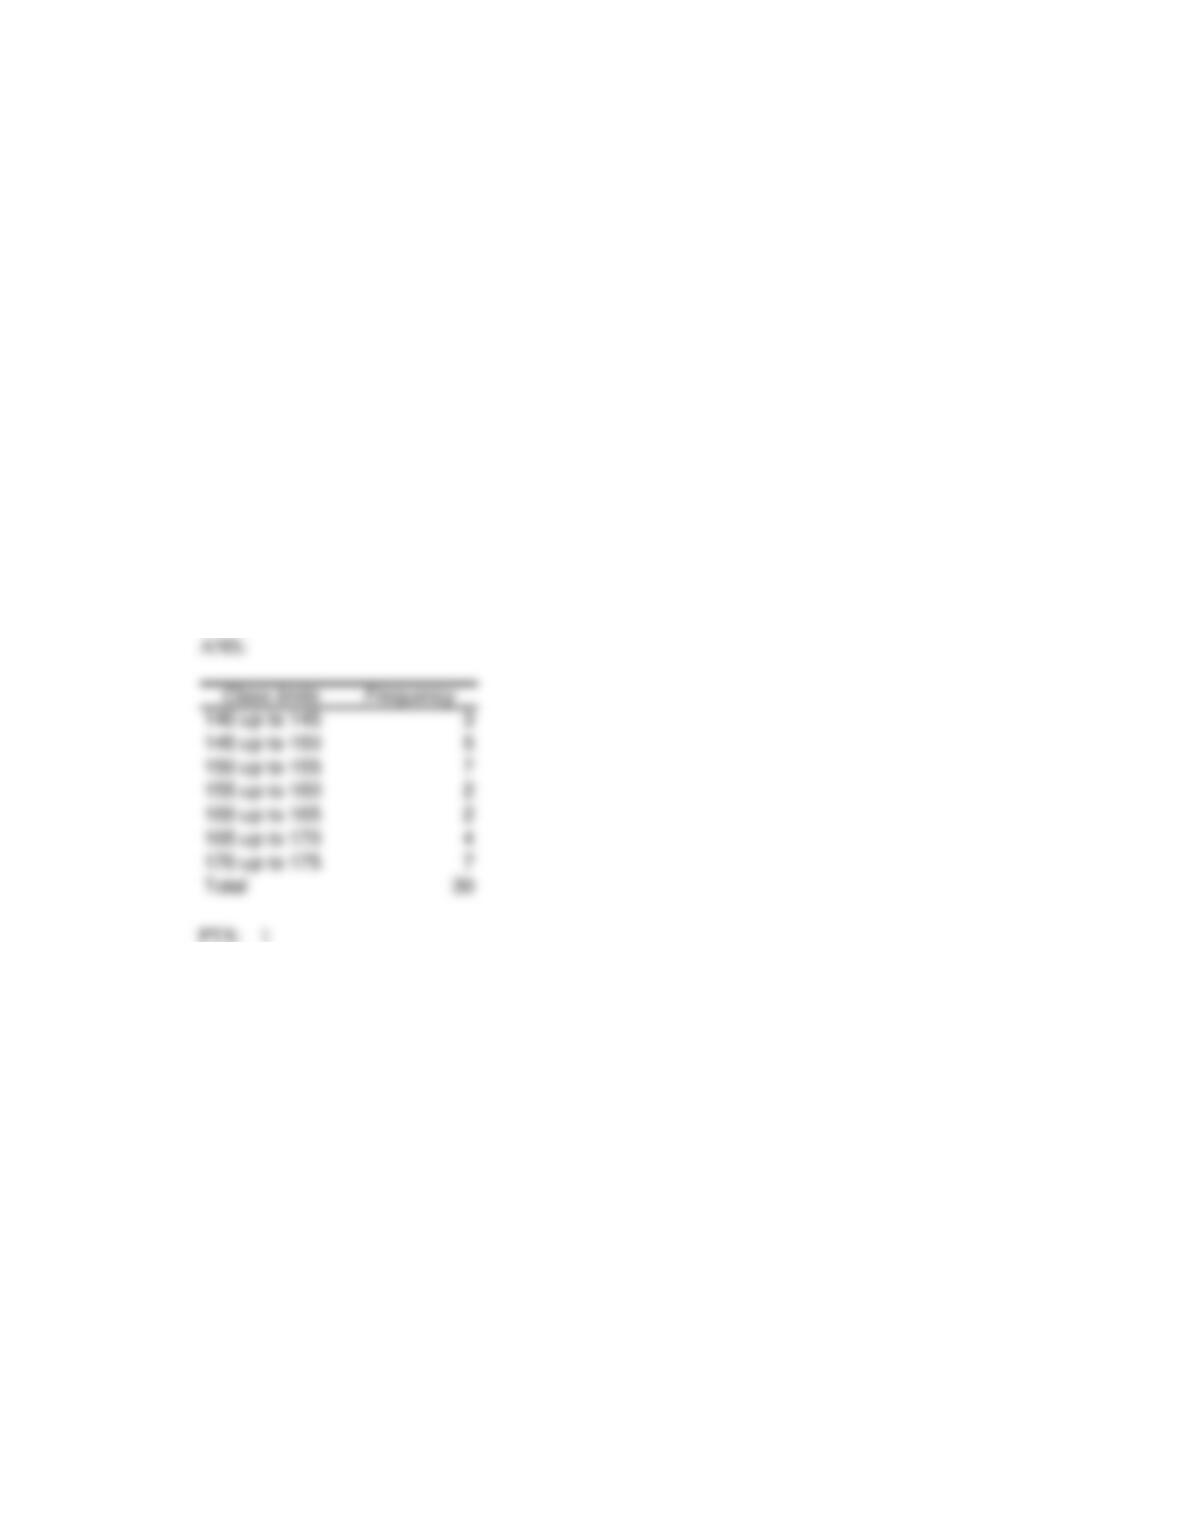
Construct a frequency distribution for the data, using class intervals of width 5 and the value 140 as the
lower limit of the first class.
17. The following data represent the weights (in kilograms) of a sample of 30 horses:
Weight
165
175
150
155
173
149
145
153
153
153
152
145
164
143
170
175
148
174
171
156
166
168
152
150
173
168
146
155
172
159
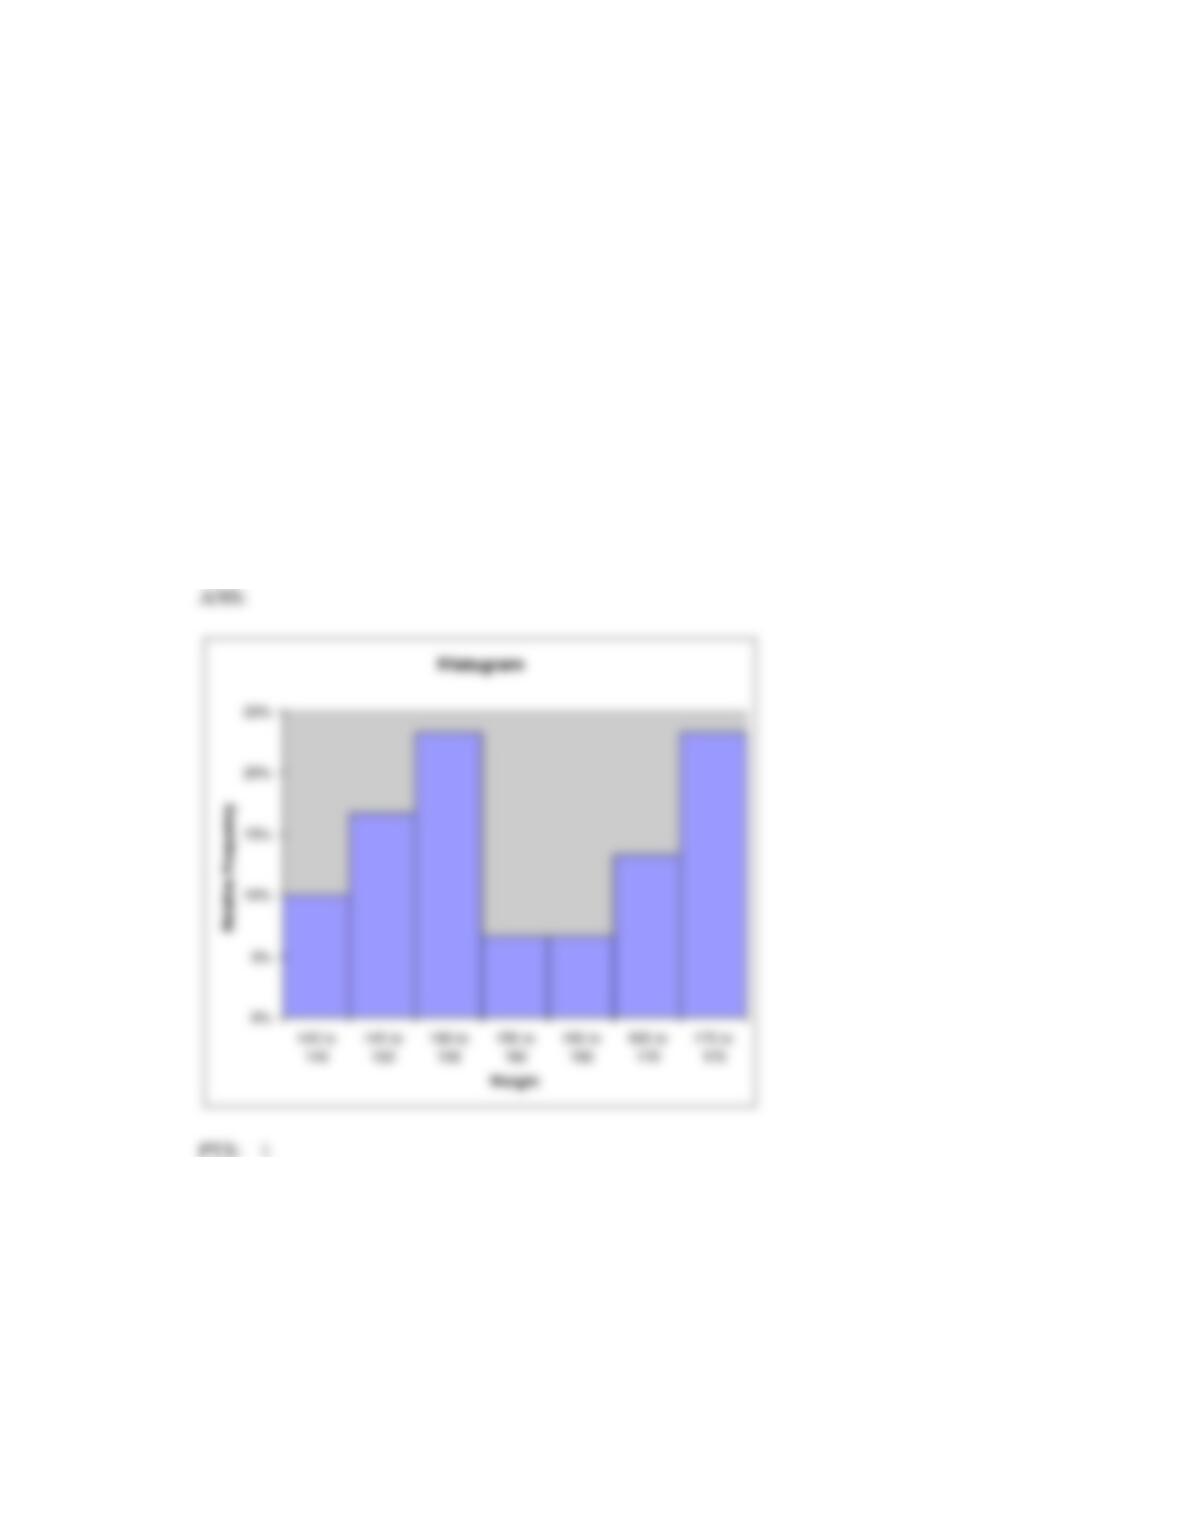
Construct a relative frequency histogram for the data, using class intervals of width 5 and the value
140 as the lower limit of the first class.
20. The following data represent the weights (in kilograms) of a sample of 30 horses:
Weight
165
175
150
155
173