Group 1
Group 2
Group 3
No heart attack
Minor heart attack
Major heart attack
Question 1: Mean and
=3.2
=2.3
=1.1
standard deviation
=0.5
=0.4
=0.4
Question 2:
Frequencies
NS: 15
NS: 11
NS: 7
MS: 7
MS: 8
MS: 5
HS: 3
HS: 6
HS: 13
Question 3:
Frequencies
1: 8
1: 4
1: 2
2: 6
2: 5
2: 3
3: 4
3: 6
3: 6
4: 4
4: 5
4: 7
5: 3
5: 5
5: 7
Can we conclude at the 5% significance level that men in Group 3 lead more stressful lives than men
in Group 1?
24. A survey was undertaken to determine the effects of retirement. A random sample of 100 64-year-old
men was taken. It was found that 25 were retired (Group 1), 35 were semi-retired (Group 2), and
the remaining 40 were not retired (Group 3). Each was asked how satisfied they are with their
lives, with the responses scored on a 5-point scale:
1 = very unsatisfied
2 = somewhat unsatisfied
3 = neither unsatisfied nor satisfied
4 = somewhat satisfied
5 = very satisfied
They were also asked how many days they had been sick during the previous 12 months. The results
are summarised in the following table. The number of sick days has been determined to be
approximately normally distributed.
Group 1
Group 2
Group 3
Retired
Semi-retired
Not retired
Satisfaction frequencies
1: 10
1: 7
1: 5
2: 8
2: 9
2: 7
3: 4
3: 8
3: 9
4: 2
4: 6
4: 10
5: 1
5: 5
5: 9
Number of sick days
= 9.5
= 6.7
= 4.3
Mean and standard deviation
s1 = 1.3
s2 = 1.2
s3 = 0.9
a. Can we conclude at the 5% significance level that the number of sick days differs among the three
groups of men?
b. Can we conclude at the 1% significance level that the men in Group 3 are sick less frequently than
the men in Group 1?
c. Find the p-value of the test.
d. Estimate with 99% confidence the difference in the mean number of sick days between Groups 2
and 3.
25. A survey was undertaken to determine the effects of retirement. A random sample of 100 64-year-old
men was taken. It was found that 25 were retired (Group 1), 35 were semi-retired (Group 2), and
the remaining 40 were not retired (Group 3). Each was asked how satisfied they are with their
lives, with the responses scored on a 5-point scale:
1 = very unsatisfied
2 = somewhat unsatisfied
3 = neither unsatisfied nor satisfied
4 = somewhat satisfied
5 = very satisfied
They were also asked how many days they had been sick during the previous 12 months. The results
are summarised in the following table. The number of sick days has been determined to be
approximately normally distributed.
Group 1
Group 2
Group 3
Retired
Semi-retired
Not retired
Satisfaction frequencies
1: 10
1: 7
1: 5
2: 8
2: 9
2: 7
3: 4
3: 8
3: 9
4: 2
4: 6
4: 10
5: 1
5: 5
5: 9
Number of sick days
= 9.5
= 6.7
= 4.3
Mean and standard deviation
s1 = 1.3
s2 = 1.2
s3 = 0.9
a. Can we conclude at the 5% significance level that the mean number of sick days among Group 3 is
less than 5.0?
b. Can we conclude at the 10% significance level that the variance of the number of sick days differs
between Groups 1 and 3?
c. Estimate with 98% confidence the mean number of sick days for Group 1.
d. Estimate with 98% confidence the ratio of the variances of the number of sick days in Groups 2
and 3.
26. A survey was undertaken to determine the effects of retirement. A random sample of 100 64-year-old
men was taken. It was found that 25 were retired (Group 1), 35 were semi-retired (Group 2), and
the remaining 40 were not retired (Group 3). Each was asked how satisfied they are with their
lives, with the responses scored on a 5-point scale:
1 = very unsatisfied
2 = somewhat unsatisfied
3 = neither unsatisfied nor satisfied
4 = somewhat satisfied
5 = very satisfied
They were also asked how many days they had been sick during the previous 12 months. The results
are summarised in the following table. The number of sick days has been determined to be
approximately normally distributed.
Group 1
Group 2
Group 3
Retired
Semi-retired
Not retired
Satisfaction frequencies
1: 10
1: 7
1: 5
2: 8
2: 9
2: 7
3: 4
3: 8
3: 9
4: 2
4: 6
4: 10
5: 1
5: 5
5: 9
Number of sick days
= 9.5
= 6.7
= 4.3
Mean and standard deviation
s1 = 1.3
s2 = 1.2
s3 = 0.9
a. Can we conclude at the 1% significance level that the variance of the number of sick days in
Group 3 is less than 1.0?
b. Estimate with 90% confidence the variance of the number of sick days in Group 2.
c. Can we conclude at the 5% significance level that men who are not retired are more satisfied than
those who are retired?
d. Can we conclude at the 5% significance level that the proportion of men who are very satisfied
differs between Groups 1 and 3?
27. A survey was undertaken to determine the effects of retirement. A random sample of 100 64-year-old
men was taken. It was found that 25 were retired (Group 1), 35 were semi-retired (Group 2), and
the remaining 40 were not retired (Group 3). Each was asked how satisfied they are with their
lives, with the responses scored on a 5-point scale:
1 = very unsatisfied
2 = somewhat unsatisfied
3 = neither unsatisfied nor satisfied
4 = somewhat satisfied
5 = very satisfied
They were also asked how many days they had been sick during the previous 12 months. The results
are summarised in the following table. The number of sick days has been determined to be
approximately normally distributed.
Group 1
Group 2
Group 3
Retired
Semi-retired
Not retired
Satisfaction frequencies
1: 10
1: 7
1: 5
2: 8
2: 9
2: 7
3: 4
3: 8
3: 9
4: 2
4: 6
4: 10
5: 1
5: 5
5: 9
Number of sick days
= 9.5
= 6.7
= 4.3
Mean and standard deviation
s1 = 1.3
s2 = 1.2
s3 = 0.9
a. Can we conclude at the 10% significance level that the proportion of men who are very satisfied
differs between Groups 2 and 3?
b. Find the p-value of the test.
c. Estimate with 98% confidence the difference in the proportion of men who are very satisfied
between Groups 2 and 3.
d. Can we conclude at the 5% significance level that the proportion of all 64-year-old men who are
very satisfied is at least 10%?
e. Find the p-value of the test.
f. Estimate with 90% confidence the proportion of all 64-year-old men who are at least somewhat
satisfied.
28. US scientists claim that playing soft, soothing music in the presence of tomato plants can improve both
the size and the taste of the tomatoes. To test the claim, 10 tomatoes grown without music and 10
tomatoes grown with music are randomly selected. The tomatoes are weighed in ounces, and an
expert rates the taste of the tomatoes on a five-point scale, where 1 = poor and 5 = excellent. The
results are shown in the following table.
Without music
With music
Weight
Taste
Weight
Taste
10
2
13
3
12
3
13
3
13
3
14
4
13
4
12
3
12
3
14
2
9
3
13
3
11
2
15
4
12
3
12
4
13
2
13
3
10
2
15
4
a. Can we conclude at the 10% significance level that the weights of the tomatoes grown with music
are greater than those grown without music? (Assume that the weights are normally distributed)
b. Estimate with 99% confidence the difference in mean weights between the two groups of
tomatoes. (Assume that the weights are normally distributed.)
c. Can we conclude at the 5% significance level that the mean weight of the tomatoes grown with
music exceeds 13 ounces? (Assume that the weights are normally distributed.)
d. Estimate with 98% confidence the mean weight of the tomatoes grown without music. (Assume
that the weights are normally distributed.)
e. Aside from the assumption of normality, what other assumption must be made? Test with α = 0.05
to determine whether this assumption is violated.
29. US scientists claim that playing soft, soothing music in the presence of tomato plants can improve both
the size and the taste of the tomatoes. To test the claim, 10 tomatoes grown without music and 10
tomatoes grown with music are randomly selected. The tomatoes are weighed in ounces, and an
expert rates the taste of the tomatoes on a five-point scale, where 1 = poor and 5 = excellent. The
results are shown in the following table.
Without music
With music
Weight
Taste
Weight
Taste
10
2
13
3
12
3
13
3
13
3
14
4
13
4
12
3
12
3
14
2
9
3
13
3
11
2
15
4
12
3
12
4
13
2
13
3
10
2
15
4
a. Assume that the weights are normally distributed. Estimate with 90% confidence the ratio of the
variances of the weights of the two groups of tomatoes.
b. Assume that the weights are normally distributed. Can we conclude at the 5% level of significance
that the variance of the weights of the tomatoes grown without music is less than 4?
c. Assume that the weights are normally distributed. Estimate with 99% confidence the variance of
the weights of the tomatoes grown with music.
d. Assume that the weights are not normally distributed. Can we conclude at the 5% significance
level that the weights of the tomatoes grown with music are greater than the weights of those
grown without music?
e. Can we conclude at the 5% significance level that the tomatoes grown with music taste better than
those grown without music?
30. Users of word processors have been complaining about the frequent breakdowns of the monitors and
about the eye irritation caused by the monitors. The research and development department of a major
computer manufacturer has developed a new type of monitor. To determine if the new type of monitor
is superior to the old type, eight of each type are used by 16 people for two years. At the end of this
period, the number of breakdowns is recorded. In addition, each person rates his or her monitor for eye
comfort on a five-point scale, where 1 = poor and 5 = excellent. The results are shown in the following
table.
Old type of monitor
New type of monitor
# of breakdowns
Eye comfort
# of breakdowns
Eye comfort
3
2
3
4
5
3
2
3
5
2
2
3
2
1
1
3
3
3
0
2
3
2
2
3
4
2
2
3
5
1
3
4
a. Can we conclude at the 5% significance level that the new type of monitor breaks down less
frequently than the old type? (Assume that the breakdowns are normally distributed.)
b. Estimate with 99% confidence the difference in the mean breakdown rate between the two types of
monitor (assume that the breakdowns are normally distributed).
c. Aside from the assumption of normality, what other assumption must be made? Test with α = 0.05
to determine whether this assumption is violated.
d. Can we conclude at the 1% significance level that the mean number of breakdowns of the new
type of monitor is less than 2? (Assume that the breakdowns are normally distributed.)
31. Users of word processors have been complaining about the frequent breakdowns of the monitors and
about the eye irritation caused by the monitors. The research and development department of a major
computer manufacturer has developed a new type of monitor. To determine if the new type of monitor
is superior to the old type, eight of each type are used by 16 people for two years. At the end of this
period, the number of breakdowns is recorded. In addition, each person rates his or her monitor for eye
comfort on a five-point scale, where 1 = poor and 5 = excellent. The results are shown in the following
table.
Old type of monitor
New type of monitor
# of breakdowns
Eye comfort
# of breakdowns
Eye comfort
3
2
3
4
5
3
2
3
5
2
2
3
2
1
1
3
3
3
0
2
3
2
2
3
4
2
2
3
5
1
3
4
a. Estimate with 98% confidence the mean number of breakdowns of the old type of monitor.
(Assume that the breakdowns are normally distributed).
b. Estimate with 98% confidence the ratio of the variances of the number of breakdowns of the two
types of monitor. (Assume that the breakdowns are normally distributed.)
c. Can we conclude at the 1% significance level that the variance of the number of breakdowns of the
old type of monitor is at least 1? (Assume that the breakdowns are normally distributed.)
d. Estimate with 98% confidence the variance of the number of breakdowns of the new type of
monitor. (Assume that the breakdowns are normally distributed.)
32. Users of word processors have been complaining about the frequent breakdowns of the monitors and
about the eye irritation caused by the monitors. The research and development department of a major
computer manufacturer has developed a new type of monitor. To determine if the new type of monitor
is superior to the old type, eight of each type are used by 16 people for two years. At the end of this
period, the number of breakdowns is recorded. In addition, each person rates his or her monitor for eye
comfort on a five-point scale, where 1 = poor and 5 = excellent. The results are shown in the following
table.
Old type of monitor
New type of monitor
# of breakdowns
Eye comfort
# of breakdowns
Eye comfort
3
2
3
4
5
3
2
3
5
2
2
3
2
1
1
3
3
3
0
2
3
2
2
3
4
2
2
3
5
1
3
4
a. Can we conclude at the 5% significance level that the new type of monitor breaks down less
frequently than the old type? (Assume that the breakdowns are not normally distributed.)
b. Can we conclude at the 5% significance level that the new type of monitor is more comfortable on
the eye than the old type?
33. The manufacturers of two competing brands of battery have been arguing about which one is best. To
help resolve the dispute, a consumer magazine performed an experiment. A battery of each type (or
group of batteries where necessary) was inserted into four types of radio and five types of toy. The
radios and toys were turned on and the amount of time (in hours) until the batteries wore out was
recorded. These data are shown in the following table.
Time to wear out battery
Brand A
Brand B
Radio 1
7.3
6.8
Radio 2
6.5
6.4
Radio 3
9.7
9.7
Radio 4
10.4
10.2
Toy 1
4.5
4.1
Toy 2
7.3
7.9
Toy 3
6.1
6.0
Toy 4
12.5
12.0
Toy 5
15.8
13.3
a. Can we conclude at the 5% significance level that the two brands of battery differ? (Assume that
the times are normally distributed.)
b. Estimate with 90% confidence the mean difference in times between the two brands of battery.
(Assume that the times are normally distributed.)
c. Can we conclude at the 5% significance level that the two brands of battery differ? (Assume that
the times are not normally distributed.)
34. When the brakes are applied on a car traveling at high speed, there is a danger, particularly on slippery
roads, that the brakes may lock, making the car difficult to handle. US car manufacturers have been
experimenting with new types of brakes to overcome locking. Two such brakes were recently
developed. To test them, two identical cars were used. One was fitted with Brand A brakes, and the
other was fitted with Brand B brakes. In a series of runs on different road conditions, both cars,
travelling at 60 kilometres per hour, had their brakes activated. The distances of the skids (in feet)
were recorded and are shown in the accompanying table.
Skid distances
Road condition
Brand A brakes
Brand B brakes
Dry
156
154
Wet (light rain)
215
225
Wet (heavy rain)
240
261
Light snow
385
390
Heavy snow
463
488
a. Can we conclude at the 10% significance level that Brand A is superior? (Assume that the
distances are normally distributed.)
b. Estimate with 95% confidence the mean difference in stopping distance between the two brake
brands. (Assume that the distances are normally distributed.)
c. Can we conclude at the 5% significance level that Brand A is superior? (Assume that the distances
are not normally distributed.)
35. An industrial psychologist wanted to determine the effect on production of varying the light levels in a
large plant. On different days, the amount of light was set at four different levels. On each day, the
number of units produced was counted and recorded. These data are shown in the following table.
Light levels
Number of units
produced
1
2
3
4
23
25
28
32
26
29
30
35
28
28
26
34
27
31
31
31
24
30
30
36
a. Can we conclude at the 5% significance level that differences in production exist among the four
light levels? (Assume that production is normally distributed.)
b. Based on the results of a., estimate with 99% confidence the mean production with light level 1.
c. Based on the results of a., estimate with 98% confidence the difference in mean production
between light levels 3 and 4.
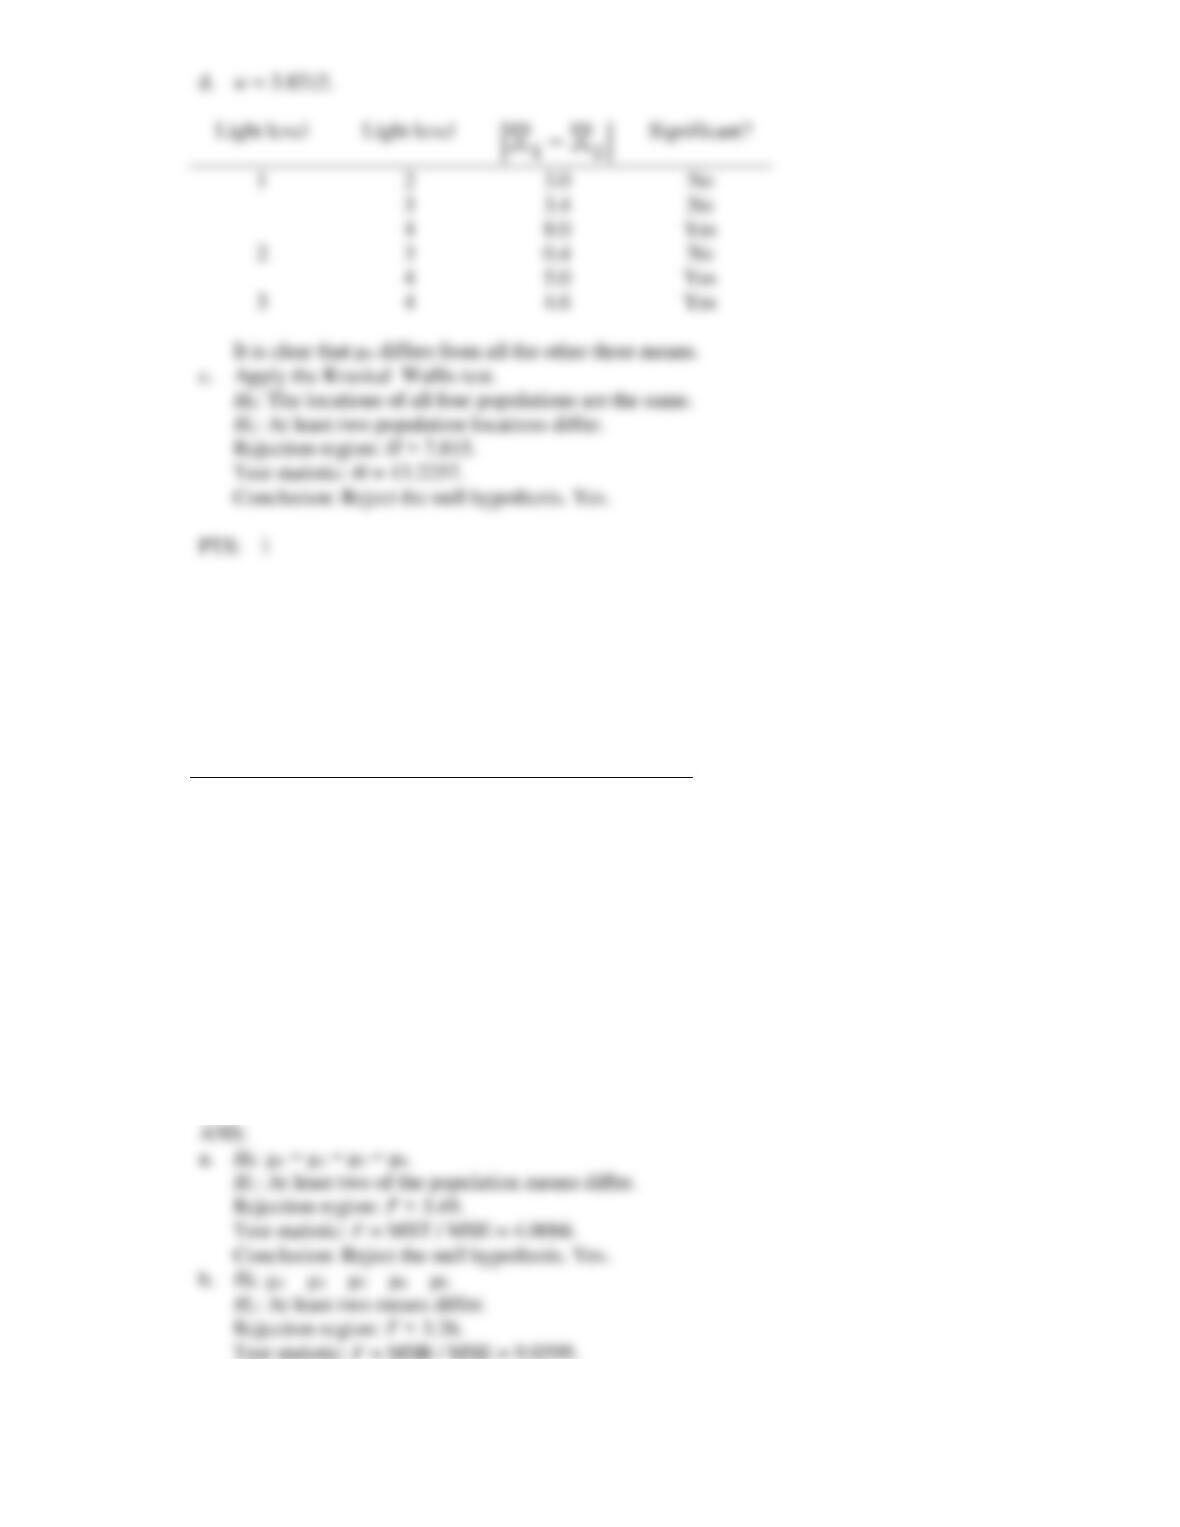
d. Apply Tukey’s multiple comparison method with α = 0.05 to determine which means differ.
e. Can we conclude at the 5% significance level that differences in production exist among the four
light levels? (Assume that production is not normally distributed.)
36. An industrial consultant wanted to determine the effect on production of varying the light levels in a
large plant. During four different weeks, the amount of light was set at four different levels. Because
the psychologist felt that the day of the week might be a factor in production, the daily production for
the five working days of the week was recorded. These data are shown in the following table.
Number of units produced
Light levels
Day
1
2
3
4
Monday
15
20
24
18
Tuesday
18
20
19
19
Wednesday
22
23
23
20
Thursday
24
25
27
23
Friday
20
20
21
20
a. Can we conclude at the 5% significance level that there are differences in production among the
four light levels? (Assume that production is normally distributed.)
b. Can we conclude at the 5% significance level that there are differences in production among the
five days of the week? (Assume that production is normally distributed.)
c. Can we conclude at the 5% significance level that there are differences in production among the
four light levels? (Assume that production is not normally distributed.)
37. Some chefs have long suspected that there are large discrepancies between an oven’s temperature
setting and the actual oven temperature. To investigate this issue, a statistician took a random sample
of five stoves of each of four brands and set each oven temperature at 400°C. The actual oven
temperatures were observed and the absolute difference between the two values was recorded. These
data are shown in the following table.
Absolute differences between actual and
set temperatures
Stove brands
1
2
3
4
9
6
3
8
12
4
5
5
11
7
0
6
15
7
7
7
10
6
6
8
a. Can we conclude at the 5% significance level that there are differences among the four brands of
stove? (Assume that the data are normally distributed.)
b. Based on the results of a., estimate with 95% confidence the mean value for brand 2.
c. Based on the results of a., estimate with 90% confidence the difference in mean values between
brands 1 and 2.
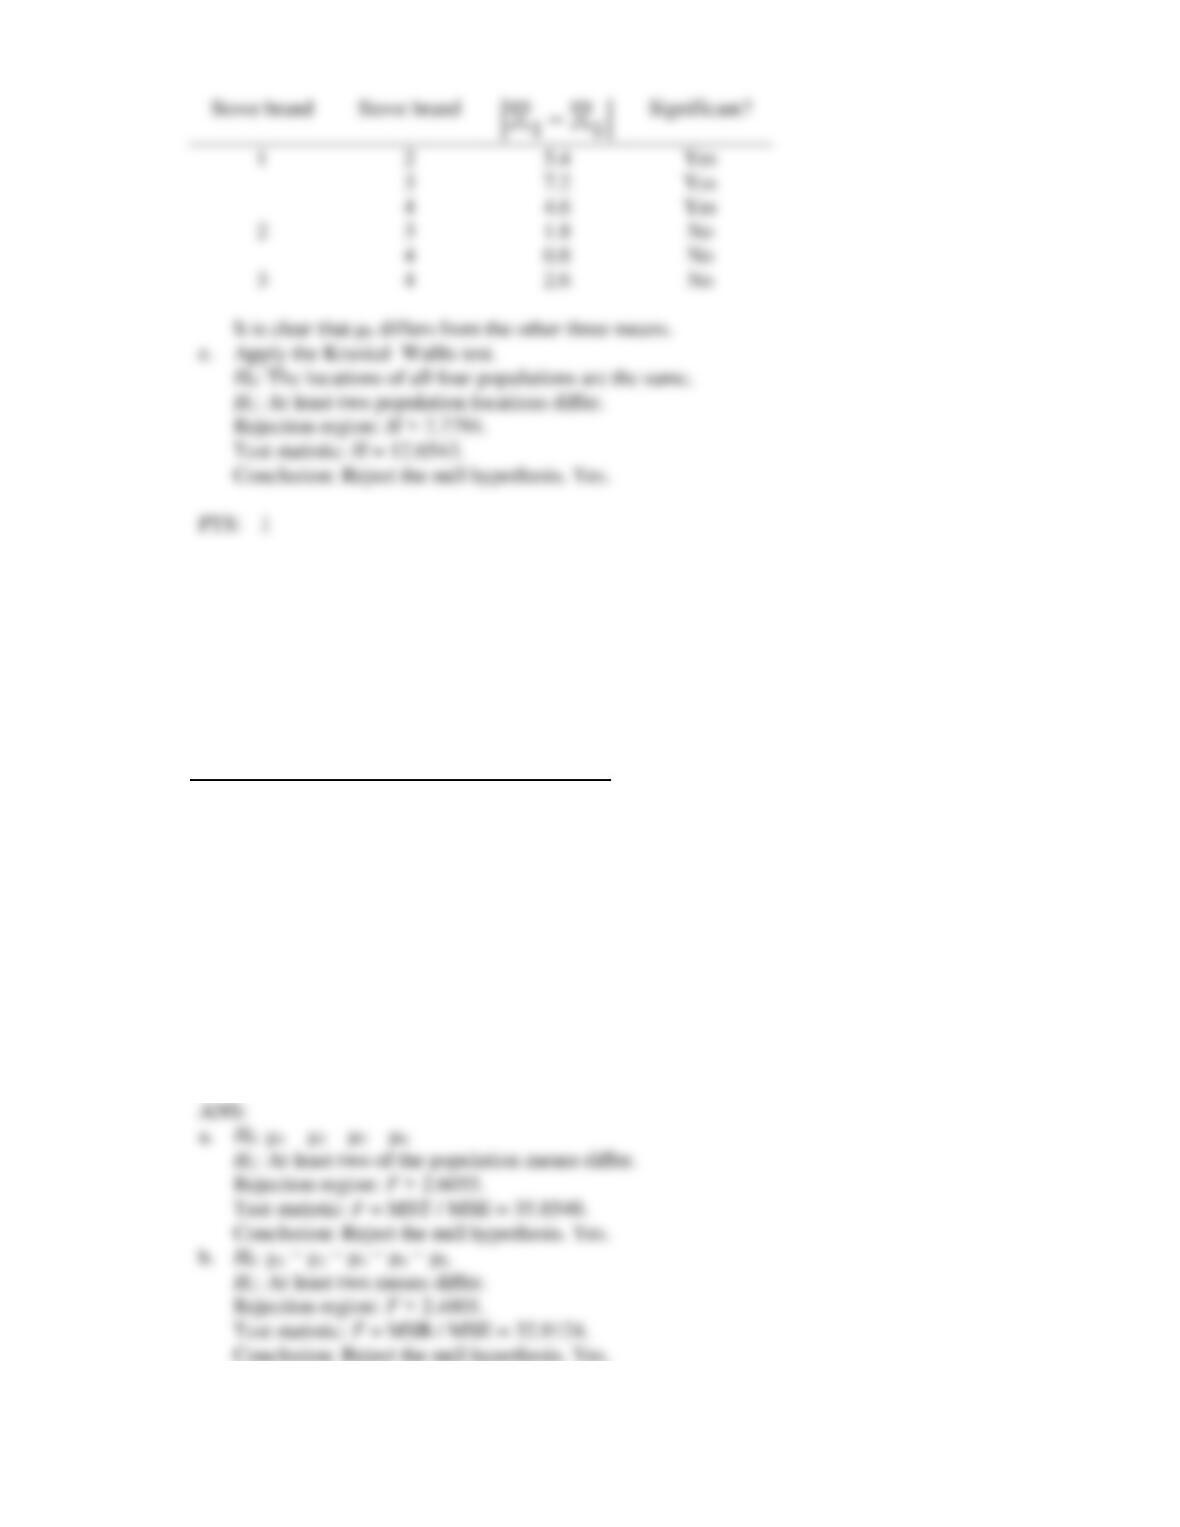
d. Apply Tukey’s multiple comparison method (α = 0.5) to determine which means differ.
e. Can we conclude at the 10% significance level that there are differences among the four brands of
stove? (Assume that the data are not normally distributed.)
38. Some chefs have long suspected that there are large errors between an oven’s temperature setting and
the actual oven temperature. To investigate the issue, a statistician took a stove from each of four
brands. He set each stove at five different temperature settings (250, 300, 350, 400 and 450) and
measured the absolute error (the difference between the actual temperature and the oven setting).
These results are shown in the following table.
Errors in oven temperatures
Stove brands
Oven settings
1
2
3
4
250
4
3
7
5
300
6
7
11
11
350
7
7
14
10
400
9
8
15
12
450
10
10
18
14
a. Can we conclude at the 10% significance level that there are differences in errors among the four
stove brands? (Assume that the errors are normally distributed.)
b. Can we conclude at the 10% significance level that there are differences in errors among the five
oven settings? (Assume that the errors are normally distributed.)
c. Can we conclude at the 10% significance level that there are differences in errors among the four
stove brands? (Assume that the errors are not normally distributed.)