
THE REGRESSION EQUATION IS
=y
21
2
2
2
121 13.051.015.161.73.117.69 xxxxxx −−−++
.
Predictor
Coef
StDev
T
Constant
69.7
41.3
1.688
1
x
11.3
5.1
2.216
2
x
7.61
2.55
2.984
2
1
x
–1.15
0.64
–1.797
2
2
x
–0.51
0.20
–2.55
21xx
–0.13
0.10
–1.30
S = 15.2 R-Sq = 47.2%.
ANALYSIS OF VARIANCE
Source of
Variation
df
SS
MS
F
Regression
5
5959
1191.800
5.181
Error
29
6671
230.034
Total
34
12 630
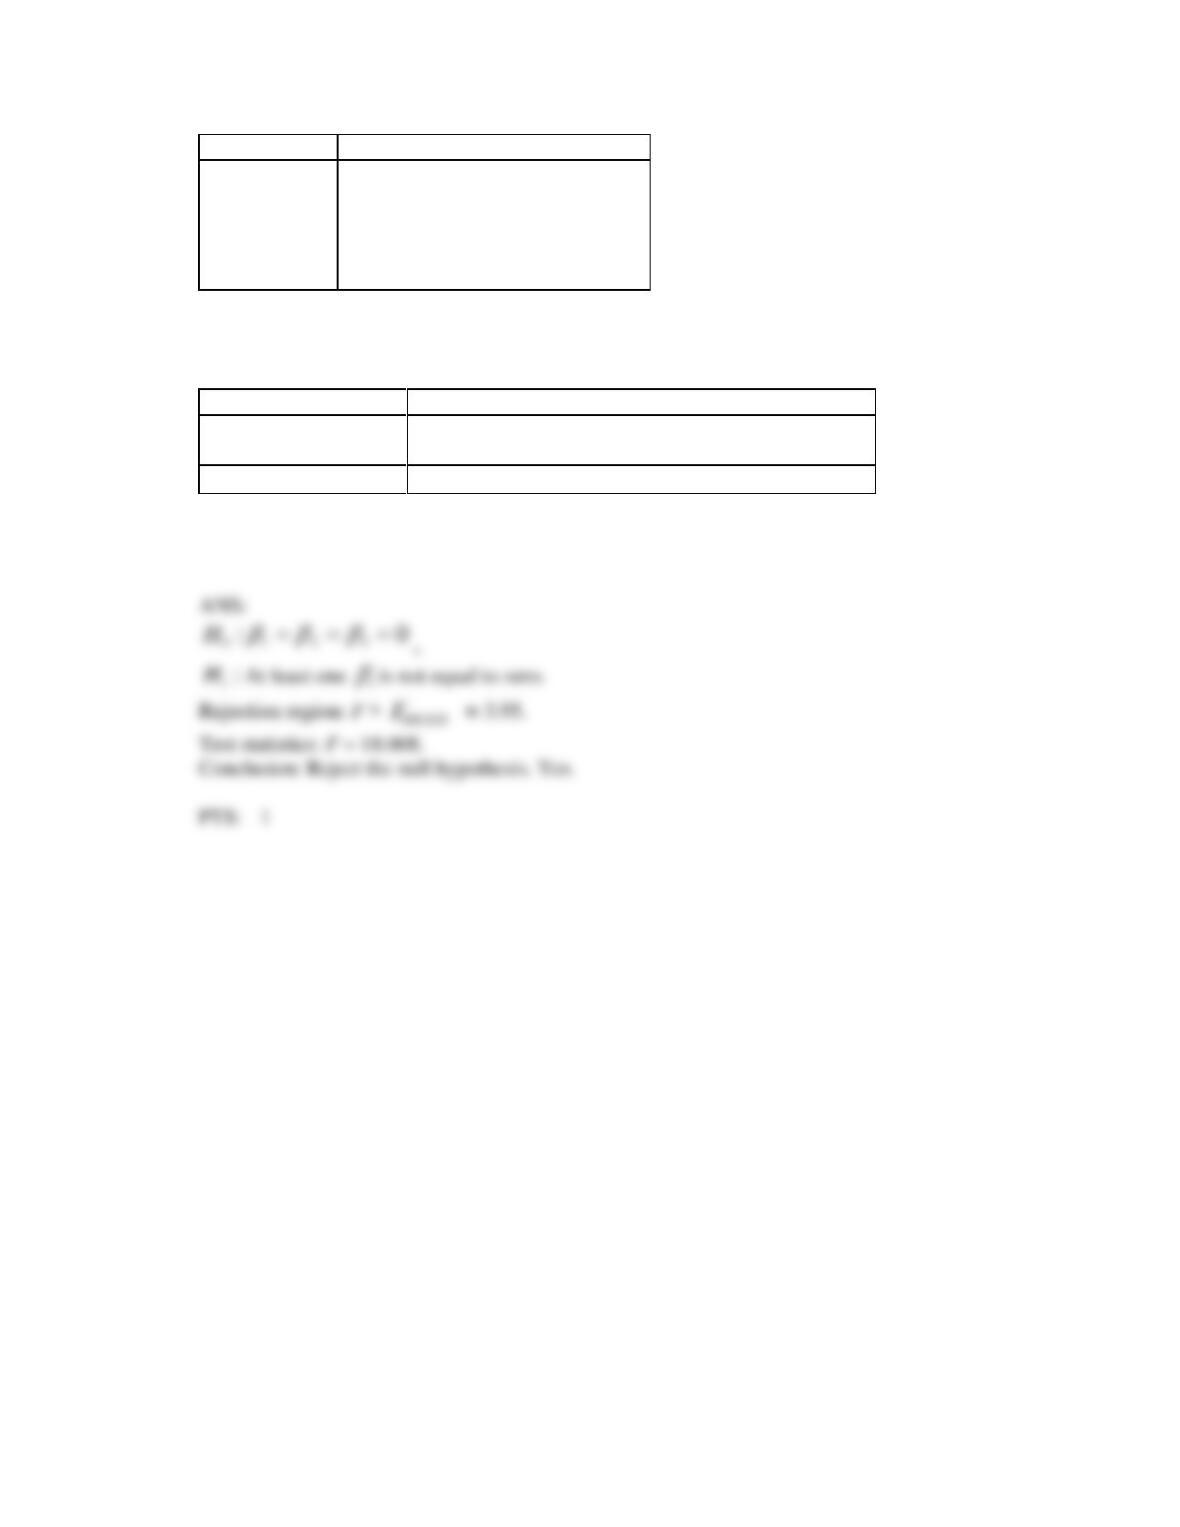
Test at the 1% significance level to determine whether the
2
1
x
term should be retained in the model.
21. A traffic consultant has analysed the factors that affect the number of traffic fatalities. She has come to
the conclusion that two important variables are the number of cars and the number of tractor–trailer
trucks. She proposed the second-order model with interaction:
=y
++++++ 215
2
24
2
1322110 xxxxxx
.
Where:
y = number of annual fatalities per shire.
1
x
= number of cars registered in the shire (in units of 10 000).
2
x
= number of trucks registered in the shire (in units of 1000).
The computer output (based on a random sample of 35 shires) is shown below.

THE REGRESSION EQUATION IS
=y
21
2
2
2
121 13.051.015.161.73.117.69 xxxxxx −−−++
.
Predictor
Coef
StDev
T
Constant
69.7
41.3
1.688
1
x
11.3
5.1
2.216
2
x
7.61
2.55
2.984
2
1
x
–1.15
0.64
–1.797
2
2
x
–0.51
0.20
–2.55
21xx
–0.13
0.10
–1.30
S = 15.2 R-Sq = 47.2%.
ANALYSIS OF VARIANCE
Source of
Variation
df
SS
MS
F
Regression
5
5959
1191.800
5.181
Error
29
6671
230.034
Total
34
12 630
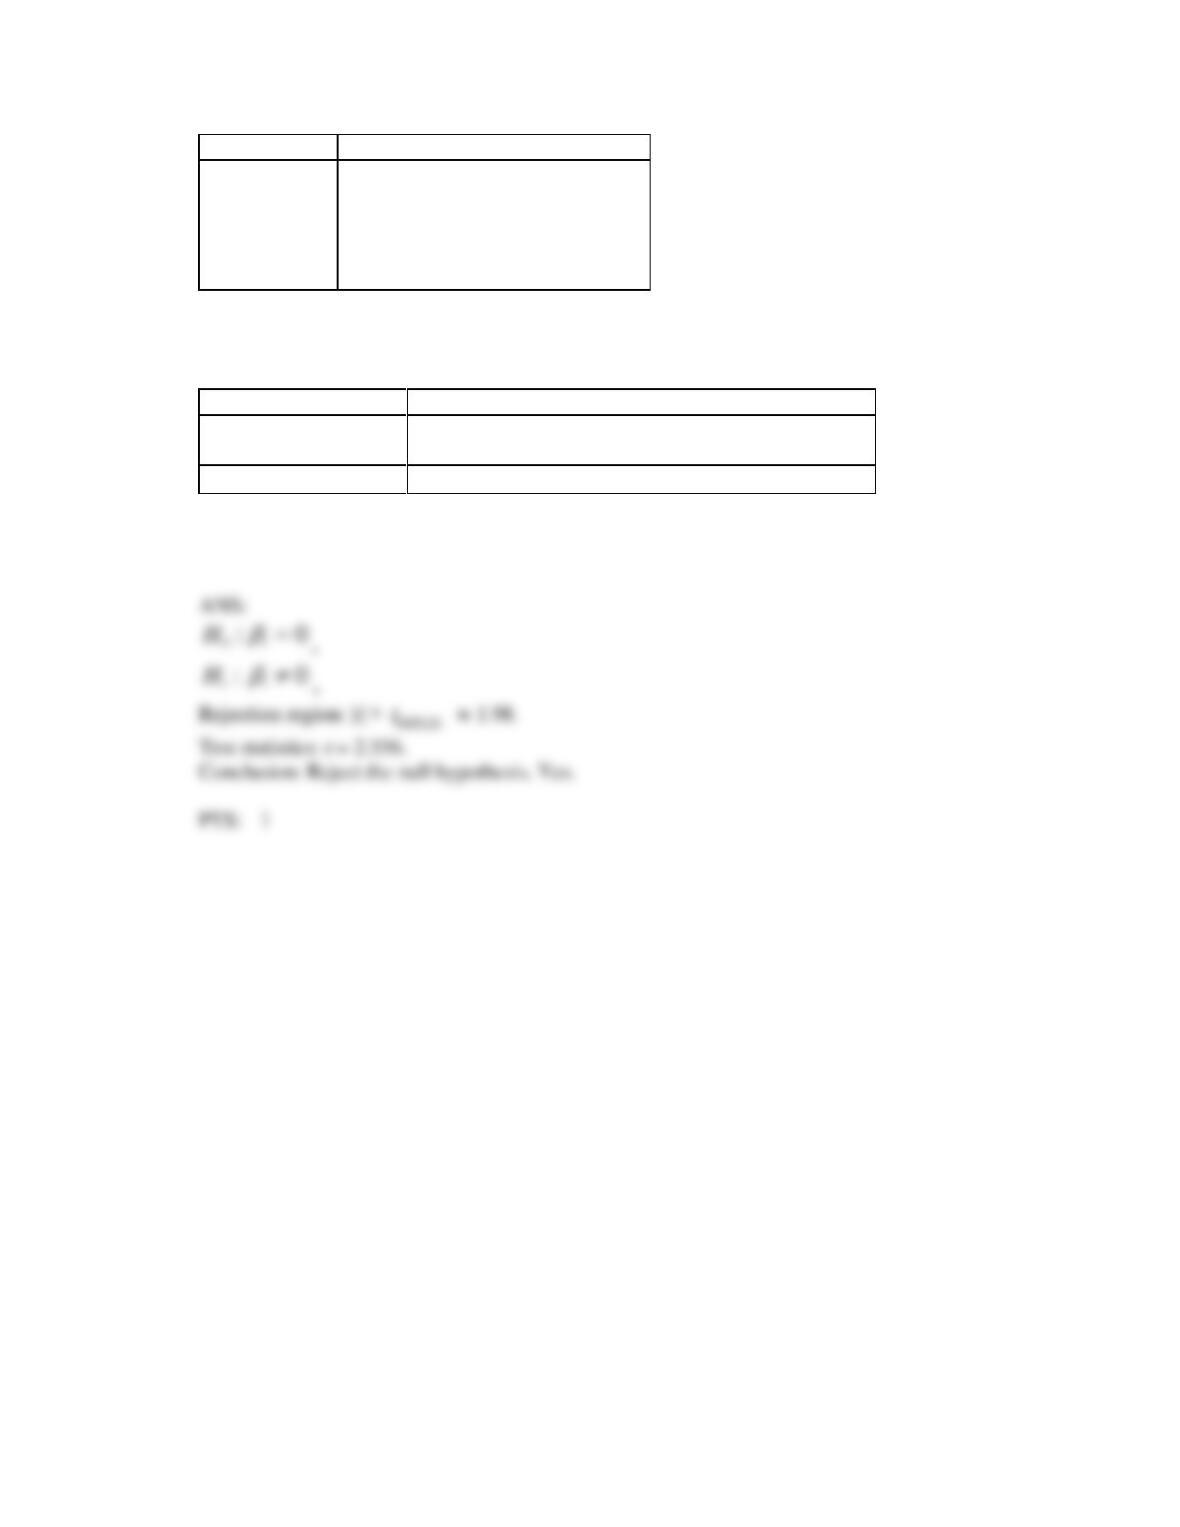
Test at the 1% significance level to determine whether the
2
2
x
term should be retained in the model.
22. A traffic consultant has analysed the factors that affect the number of traffic fatalities. She has come to
the conclusion that two important variables are the number of cars and the number of tractor–trailer
trucks. She proposed the second-order model with interaction:
=y
++++++ 215
2
24
2
1322110 xxxxxx
.
Where:
y = number of annual fatalities per shire.
1
x
= number of cars registered in the shire (in units of 10 000).
2
x
= number of trucks registered in the shire (in units of 1000).
The computer output (based on a random sample of 35 shires) is shown below.

THE REGRESSION EQUATION IS
=y
21
2
2
2
121 13.051.015.161.73.117.69 xxxxxx −−−++
.
Predictor
Coef
StDev
T
Constant
69.7
41.3
1.688
1
x
11.3
5.1
2.216
2
x
7.61
2.55
2.984
2
1
x
–1.15
0.64
–1.797
2
2
x
–0.51
0.20
–2.55
21xx
–0.13
0.10
–1.30
S = 15.2 R-Sq = 47.2%.
ANALYSIS OF VARIANCE
Source of
Variation
df
SS
MS
F
Regression
5
5959
1191.800
5.181
Error
29
6671
230.034
Total
34
12 630
Test at the 1% significance level to determine whether the interaction term should be retained in the
model.
23. A traffic consultant has analysed the factors that affect the number of traffic fatalities. She has come to
the conclusion that two important variables are the number of cars and the number of tractor–trailer
trucks. She proposed the second-order model with interaction:
=y
++++++ 215
2
24
2
1322110 xxxxxx
.
Where:
y = number of annual fatalities per shire.
1
x
= number of cars registered in the shire (in units of 10 000).
2
x
= number of trucks registered in the shire (in units of 1000).
The computer output (based on a random sample of 35 shires) is shown below.

THE REGRESSION EQUATION IS
=y
21
2
2
2
121 13.051.015.161.73.117.69 xxxxxx −−−++
.
Predictor
Coef
StDev
T
Constant
69.7
41.3
1.688
1
x
11.3
5.1
2.216
2
x
7.61
2.55
2.984
2
1
x
–1.15
0.64
–1.797
2
2
x
–0.51
0.20
–2.55
21xx
–0.13
0.10
–1.30
S = 15.2 R-Sq = 47.2%.
ANALYSIS OF VARIANCE
Source of
Variation
df
SS
MS
F
Regression
5
5959
1191.800
5.181
Error
29
6671
230.034
Total
34
12 630
What does the coefficient of
2
1
x
tell you about the model?
24. A traffic consultant has analysed the factors that affect the number of traffic fatalities. She has come to
the conclusion that two important variables are the number of cars and the number of tractor–trailer
trucks. She proposed the second-order model with interaction:
=y
++++++ 215
2
24
2
1322110 xxxxxx
.
Where:
y = number of annual fatalities per shire.
1
x
= number of cars registered in the shire (in units of 10 000).
2
x
= number of trucks registered in the shire (in units of 1000).
The computer output (based on a random sample of 35 shires) is shown below.

THE REGRESSION EQUATION IS
=y
21
2
2
2
121 13.051.015.161.73.117.69 xxxxxx −−−++
.
Predictor
Coef
StDev
T
Constant
69.7
41.3
1.688
1
x
11.3
5.1
2.216
2
x
7.61
2.55
2.984
2
1
x
–1.15
0.64
–1.797
2
2
x
–0.51
0.20
–2.55
21xx
–0.13
0.10
–1.30
S = 15.2 R-Sq = 47.2%.
ANALYSIS OF VARIANCE
Source of
Variation
df
SS
MS
F
Regression
5
5959
1191.800
5.181
Error
29
6671
230.034
Total
34
12 630
What does the coefficient of
2
2
x
tell you about the model?
25. A traffic consultant has analysed the factors that affect the number of traffic fatalities. She has come to
the conclusion that two important variables are the number of cars and the number of tractor–trailer
trucks. She proposed the second-order model with interaction:
=y
++++++ 215
2
24
2
1322110 xxxxxx
.
Where:
y = number of annual fatalities per shire.
1
x
= number of cars registered in the shire (in units of 10 000).
2
x
= number of trucks registered in the shire (in units of 1000).
The computer output (based on a random sample of 35 shires) is shown below.

THE REGRESSION EQUATION IS
=y
21
2
2
2
121 13.051.015.161.73.117.69 xxxxxx −−−++
.
Predictor
Coef
StDev
T
Constant
69.7
41.3
1.688
1
x
11.3
5.1
2.216
2
x
7.61
2.55
2.984
2
1
x
–1.15
0.64
–1.797
2
2
x
–0.51
0.20
–2.55
21xx
–0.13
0.10
–1.30
S = 15.2 R-Sq = 47.2%.
ANALYSIS OF VARIANCE
Source of
Variation
df
SS
MS
F
Regression
5
5959
1191.800
5.181
Error
29
6671
230.034
Total
34
12 630
What is the multiple coefficient of determination? What does this statistic tell you about the model?
26. An economist is analysing the incomes of professionals (physicians, dentists and lawyers). He realises
that an important factor is the number of years of experience. However, he wants to know if there are
differences among the three professional groups. He takes a random sample of 125 professionals and
estimates the multiple regression model:
++++= 3322110 xxxy
.
where
y
= annual income (in $1000).
1
x
= years of experience.
2
x
= 1 if physician.
= 0 if not.
3
x
= 1 if dentist.
= 0 if not.
The computer output is shown below.
THE REGRESSION EQUATION IS
=y
321 44.716.1007.265.71 xxx −++
.
Predictor
Coef
StDev
T
Constant
71.65
18.56
3.860
1
x
2.07
0.81
2.556
2
x
10.16
3.16
3.215
3
x
–7.44
2.85
–2.611
S = 42.6 R-Sq = 30.9%.
ANALYSIS OF VARIANCE
Source of Variation
df
SS
MS
F
Regression
3
98 008
32 669.333
18.008
Error
121
219 508
1814.116
Total
124
317 516
Do these results allow us to conclude at the 1% significance level that the model is useful in predicting
the income of professionals?
27. An economist is analysing the incomes of professionals (physicians, dentists and lawyers). He realises
that an important factor is the number of years of experience. However, he wants to know if there are
differences among the three professional groups. He takes a random sample of 125 professionals and
estimates the multiple regression model:
++++= 3322110 xxxy
.
where
y
= annual income (in $1000).
1
x
= years of experience.
2
x
= 1 if physician.
= 0 if not.
3
x
= 1 if dentist.
= 0 if not.
The computer output is shown below.
THE REGRESSION EQUATION IS
=y
321 44.716.1007.265.71 xxx −++
.
Predictor
Coef
StDev
T
Constant
71.65
18.56
3.860
1
x
2.07
0.81
2.556
2
x
10.16
3.16
3.215
3
x
–7.44
2.85
–2.611
S = 42.6 R-Sq = 30.9%.
ANALYSIS OF VARIANCE
Source of Variation
df
SS
MS
F
Regression
3
98 008
32 669.333
18.008
Error
121
219 508
1814.116
Total
124
317 516
Is there enough evidence at the 5% significance level to conclude that income and experience are
linearly related?
28. An economist is analysing the incomes of professionals (physicians, dentists and lawyers). He realises
that an important factor is the number of years of experience. However, he wants to know if there are
differences among the three professional groups. He takes a random sample of 125 professionals and
estimates the multiple regression model:
++++= 3322110 xxxy
.
where
y
= annual income (in $1000).
1
x
= years of experience.
2
x
= 1 if physician.
= 0 if not.
3
x
= 1 if dentist.
= 0 if not.
The computer output is shown below.

THE REGRESSION EQUATION IS
=y
321 44.716.1007.265.71 xxx −++
.
Predictor
Coef
StDev
T
Constant
71.65
18.56
3.860
1
x
2.07
0.81
2.556
2
x
10.16
3.16
3.215
3
x
–7.44
2.85
–2.611
S = 42.6 R-Sq = 30.9%.
ANALYSIS OF VARIANCE
Source of Variation
df
SS
MS
F
Regression
3
98 008
32 669.333
18.008
Error
121
219 508
1814.116
Total
124
317 516
Is there enough evidence at the1% significant level to conclude that physicians earn more on average
than lawyers?
29. An economist is analysing the incomes of professionals (physicians, dentists and lawyers). He realises
that an important factor is the number of years of experience. However, he wants to know if there are
differences among the three professional groups. He takes a random sample of 125 professionals and
estimates the multiple regression model:
++++= 3322110 xxxy
.
where
y
= annual income (in $1000).
1
x
= years of experience.
2
x
= 1 if physician.
= 0 if not.
3
x
= 1 if dentist.
= 0 if not.
The computer output is shown below.

THE REGRESSION EQUATION IS
=y
321 44.716.1007.265.71 xxx −++
.
Predictor
Coef
StDev
T
Constant
71.65
18.56
3.860
1
x
2.07
0.81
2.556
2
x
10.16
3.16
3.215
3
x
–7.44
2.85
–2.611
S = 42.6 R-Sq = 30.9%.
ANALYSIS OF VARIANCE
Source of Variation
df
SS
MS
F
Regression
3
98 008
32 669.333
18.008
Error
121
219 508
1814.116
Total
124
317 516
Is there enough evidence at the 10% significance level to conclude that dentists earn less on average
than lawyers?
30. An economist is in the process of developing a model to predict the price of gold. She believes that the
two most important variables are the price of a barrel of oil
)( 1
x
and the interest rate
).( 2
x
She
proposes the first-order model with interaction:
++++= 31322110 xxxxy
.
A random sample of 20 daily observations was taken. The computer output is shown below.
THE REGRESSION EQUATION IS
=y
2121 36.17.143.226.115 xxxx −++
.
Predictor
Coef
StDev
T
Constant
115.6
78.1
1.480
1
x
22.3
7.1
3.141
2
x
14.7
6.3
2.333
21xx
–1.36
0.52
–2.615
S = 20.9 R-Sq = 55.4%.

ANALYSIS OF VARIANCE
Source of Variation
df
SS
MS
F
Regression
3
8661
2887.0
6.626
Error
16
6971
435.7
Total
19
15 632
Do these results allow us at the 5% significance level to conclude that the model is useful in predicting
the price of gold?
31. An economist is in the process of developing a model to predict the price of gold. She believes that the
two most important variables are the price of a barrel of oil
)( 1
x
and the interest rate
).( 2
x
She
proposes the first-order model with interaction:
++++= 31322110 xxxxy
.
A random sample of 20 daily observations was taken. The computer output is shown below.
THE REGRESSION EQUATION IS
=y
2121 36.17.143.226.115 xxxx −++
.
Predictor
Coef
StDev
T
Constant
115.6
78.1
1.480
1
x
22.3
7.1
3.141
2
x
14.7
6.3
2.333
21xx
–1.36
0.52
–2.615
S = 20.9 R-Sq = 55.4%.
ANALYSIS OF VARIANCE
Source of Variation
df
SS
MS
F
Regression
3
8661
2887.0
6.626
Error
16
6971
435.7
Total
19
15 632
Is there sufficient evidence at the 1% significance level to conclude that the price of a barrel of oil and
the price of gold are linearly related?