
Chapter 19—Nonparametric techniques: Comparing two or more populations
MULTIPLE CHOICE
1. The non-parametric counterpart of the parametric t-test of
D
for matched pairs is the:
A.
Friedman test.
B.
Kruskal–Wallis test.
C.
Wilcoxon signed rank sum test.
D.
Wilcoxon rank sum test.
2. In applications of the Kruskal–Wallis test, the alternative hypothesis to be tested is always stated as:
A.
the locations of all k populations are the same.
B.
the locations of all k populations differ.
C.
at least two population locations are the same.
D.
at least two population locations differ.
3. Which of the following distributions approximates the Kruskal–Wallis test statistic H when the
problem objective is to compare k distributions and the sample sizes are greater than or equal to 5?
A.
Normal.
B.
Chi-squared distribution with k – 1 degrees of freedom.
C.
Student t-distribution with k – 2 degrees of freedom.
D.
Either chi-squared distribution with k – 5 degrees of freedom or Student t-distribution with
k + 5 degrees of freedom.
4. In a normal approximation to the Wilcoxon signed rank sum test, the test statistic is calculated as z =
1.59. For a two-tail test, the p–value is:
A.
0.3882.
B.
0.0559.
C.
0.1118.
D.
0.4441.
5. The Wilcoxon signed rank sum test statistic is approximately normally distributed whenever the
sample sizes are larger than:
A.
10.
B.
20.
C.
30.
D.
100.

6. The Kruskal–Wallis test statistic can be approximated by a chi-squared distribution with k – 1 degrees
of freedom (where k is the number of populations) whenever the sample sizes are all greater than or
equal to:
A.
5.
B.
15.
C.
25.
D.
30.
7. In a Kruskal–Wallis test there are five samples and the value of the test statistic is calculated as
H = 11.15. The most accurate statement that can be made about the p-value is that:
A.
it is smaller than 0.01.
B.
it is greater than 0.025 but smaller than 0.05.
C.
it is greater than 0.01 but smaller than 0.025.
D.
it is greater than 0.05.
8. In a Wilcoxon signed rank sum test, the test statistic is calculated as T = 75. If there are n = 15
observations for which
0D
, and a two-tail test is performed at the 5% significance level, then:
A.
we reject the null hypothesis.
B.
we don’t reject the null hypothesis.
C.
the test results are inconclusive.
D.
we perform a parametric test.
9. In a Wilcoxon signed rank sum test, the test statistic is calculated as T = 45. The alternative hypothesis
is stated as: The location of population 1 is different from the location of population 2. If there are
n = 15 observations for which
0D
, and the 5% significance level is used, then:
A.
the null hypothesis will be rejected.
B.
the null hypothesis will not be rejected.
C.
the test results are inconclusive.
D.
the normal approximation must be used.
10. In a sign test, the following information is given: number of zero differences = 3, number of positive
differences = 20, and number of negative differences = 5. The value of the standardised test statistic z
is:
A.
5.
B.
4.
C.
3.
D.
2.
11. The significance level for a Wilcoxon signed rank sum test is 0.05. The alternative hypothesis is stated
as: The location of population 1 is to the left of the location of population 2. The appropriate critical
value for a sample of size 20 (that is, the number of nonzero differences) is:
A.
158.
B.
150.

C.
60.
D.
52.
12. Consider the following data set:
11
11
12
13
15
16
16
17
18
19
20
22
22
22
22
25
The rank assigned to the four observations of value 22 is:
A.
12.
B.
12.5.
C.
13.
D.
13.5.
13. Consider the following data set:
1.2
1.3
1.3
1.3
1.6
1.7
1.8
1.8
1.8
1.9
2.1
2.2
2.5
The rank assigned to the three observations of value 1.3 is:
A.
2.5.
B.
3.
C.
2.
D.
1.
14. Consider the following two samples:
A:
12
14
15
B:
11
13
16
16
17
19
20
The value of the test statistic for a right-tailed Wilcoxon rank sum test is:
A.
3.
B.
7.
C.
11.
D.
44.
15. Consider the following two samples:
A:
14
15
37
40
35
B:
25
29
32
35
38
The value of the test statistic for a left-tailed Wilcoxon rank sum test is:
A.
27.5.
B.
27.
C.
28.

D.
28.5.
16. A matched pairs experiment yielded the following paired differences:
3
–2
2
2
2
–2
0
1
0
3
0
–1
2
–1
3
2
1
2
The value of the standardised sign test statistic z is:
A.
1.807.
B.
11.0.
C.
3.873.
D.
–5.939.
17. The significance level for a Wilcoxon signed rank sum test is 0.05. The alternative hypothesis is stated
as: the location of population 1 is to the right of the location of population 2. The appropriate critical
value for a sample of size 20 (that is, the number of nonzero differences is 20) is:
A.
158.
B.
150.
C.
60.
D.
52.
18. The significance level for a Wilcoxon signed rank sum test is 0.05. The alternative hypothesis is stated
as: The location of population 1 is left to the location of population 2. The appropriate critical values
for a sample of size 20 (that is the number of nonzero differences is 20) are:
A.
60, 150.
B.
52, 150.
C.
60, 158.
D.
52, 158.
19. A Wilcoxon rank sum test for comparing two populations involves two independent samples of sizes 5
and 7. The alternative hypothesis is stated as: The location of population 1 is different from the
location of population 2. The appropriate critical values at the 5% significance level are:
A.
20, 45.
B.
22, 43.
C.
33, 58.
D.
35, 56.
20. In a Wilcoxon signed rank sum test for matched pairs with n = 35, the rank sums of the positive and
negative differences are 380 and 225, respectively. The value of the standardised test statistic z is:
A.
1.689.
B.
1.065.
C.
1.206.
D.
1.400.

21. In a Kruskal–Wallis test for comparing five populations, the test statistic is calculated as
H = 10.20. If the test is conducted at the 1% significance level, then:
A.
the null hypothesis will be rejected.
B.
the null hypothesis will not be rejected.
C.
the test results are inconclusive.
D.
the t-test for matched pairs must be used.
22. In a Friedman test for comparing four populations, provided that there are eight blocks, the test
statistic is calculated as F = 10.98. If the test is conducted at the 5% significance level, the conclusion
and p-value will be:
A.
reject the null hypothesis, and 0.01 < p–value < 0.025.
B.
reject the null hypothesis, and p-value > 0.025.
C.
do not reject the null hypothesis, and 0.025 < p-value < 0.05.
D.
do not reject the null hypothesis, and p-value > 0.05.
23. A Wilcoxon rank sum test for comparing two populations involves two independent samples of sizes
15 and 20. The unstandardised test statistic (that is the rank sum) is T = 210. The value of the
standardised test statistic z is:
A.
14.0.
B.
10.5.
C.
6.0.
D.
–2.0.
24. The appropriate measure of central location of ordinal data is the:
A.
mean.
B.
median.
C.
mode.
D.
All of the above are correct answers.
25. Statistical methods that require, among other assumptions, that the populations be normally distributed
are known as:
A.
distribution-free techniques.
B.
non-parametric techniques.
C.
parametric techniques.
D.
Both A and B are correct answers.
26. A non-parametric method to compare two populations, when the samples consist of matched pairs of
observations and the data are either ordinal or interval, and where the normality requirement necessary
to perform the parametric test is not satisfied, is the:
A.
Wilcoxon rank sum test.
B.
chi-squared test.
C.
Wilcoxon signed rank sum test.

D.
Kruskal-Wallis test.
27. A non-parametric method to compare two populations, when the samples are independent but the
assumptions behind the independent samples t-test are violated, is the:
A.
Wilcoxon rank sum test.
B.
sign test.
C.
matched pairs t–test.
D.
Wilcoxon signed rank sum test.
28. A non-parametric method to compare two populations, when the samples are matched pairs and the
data are ordinal, is the:
A.
Wilcoxon signed rank sum test.
B.
sign test.
C.
Wilcoxon rank sum test.
D.
matched pairs t–test.
29. Which of the following tests would be an example of a non-parametric method?
A.
Wilcoxon signed rank sum test.
B.
Kruskal–Wallis test.
C.
Friedman test.
D.
All of the above are correct answers.
30. A non-parametric method to compare two or more populations, when the samples are matched pairs
and the data are either ordinal or interval but not normal, is the:
A.
Wilcoxon signed rank sum test.
B.
sign test.
C.
Friedman test.
D.
Kruskal–Wallis test.
31. A non-parametric method to compare two or more populations, when the samples are independent and
the data are either ordinal or interval but not normal, is the:
A.
Kruskal–Wallis test.
B.
Friedman test.
C.
Wilcoxon rank sum test.
D.
Wilcoxon signed rank sum test.
32. Statistical methods that require few assumptions, if any, about the population distribution are known
as:
A.
parametric techniques.
B.
non-parametric techniques.
C.
free agent techniques.
D.
All of the above answers are correct.

33. The Wilcoxon rank sum test (like most of the non-parametric tests presented in your textbook) actually
tests to determine whether the population distributions have identical:
A.
locations.
B.
spreads (variances).
C.
shapes.
D.
All of the above are correct answers.
34. The non-parametric tests discussed in your textbook (Wilcoxon rank sum test, sign test, Wilcoxon
signed rank sum test, Kruskal–Wallis test and Friedman test) all require that the probability
distributions be:
A.
identical except with respect to location.
B.
identical except with respect to spread (variance).
C.
identical except with respect to shape (distribution).
D.
different with respect to location, spread, and shape.
35. The non-parametric counterpart of the randomised block model of the analysis of variance is the:
A.
Kruskal–Wallis test.
B.
Friedman test.
C.
Wilcoxon rank sum test.
D.
Wilcoxon signed rank sum test.
36. The non-parametric counterpart of the parametric one-way analysis of variance F-test is the:
A.
Kruskal–Wallis test.
B.
Friedman test.
C.
Wilcoxon rank sum test.
D.
Wilcoxon signed rank sum test.
37. The first step in a Wilcoxon rank sum test is to combine the data values in the two samples and assign
a rank of 1 to the:
A.
smallest observation.
B.
middle observation.
C.
largest observation.
D.
observation that occurs most frequently.
38. A non-parametric test for comparing two or more populations should be used instead of its parametric
counterpart if:
A.
the sample sizes are large.
B.
the data are ordinal (ranked) or numerical but non-normal.
C.
the populations are normally distributed.
D.
the data are numerical.

39. Compared to parametric tests, non-parametric tests use the information contained in the data:
A.
more effectively.
B.
less effectively.
C.
about the same.
D.
None of the above answers is correct.
40. The Kruskal–Wallis test and Friedman test are always:
A.
one-tailed.
B.
two-tailed.
C.
used with one sample.
D.
used when the populations are normally distributed.
41. Which of the following will never be a required condition of a non-parametric test?
A.
The data are ordinal.
B.
The data are interval.
C.
The samples are drawn from normally distributed populations
D.
The populations being compared are identical in spread and shape.
42. In a Wilcoxon rank sum test, the two sample sizes are 6 and 6, and the value of the Wilcoxon test
statistic is T = 20. If the test is two-tailed and the level of significance is
0.05
=
, then:
A.
the null hypothesis will be rejected.
B.
the null hypothesis will not be rejected.
C.
the alternative hypothesis will not be rejected.
D.
not enough information has been given to answer this question.
43. To apply the Wilcoxon rank sum test to determine whether the location of population 1 is different
from the location of population 2, the samples must be:
A.
drawn from normal populations.
B.
drawn from matched pairs experiment.
C.
independent.
D.
larger than 30.
44. To apply the Friedman test to determine whether the locations of two or more populations are the
same:
A.
the populations must be normally distributed.
B.
the data must be generated from a randomised block experiment.
C.
the sample sizes must be at least 30.
D.
the samples must be independent.

45. In a normal approximation to the Wilcoxon rank sum test, the standardised test statistic is calculated as
z = 1.80. For a two- tail test, the p-value is:
A.
0.0359.
B.
0.4641.
C.
0.2321.
D.
0.0718.
46. In the sign test applications, the normal approximation to the binomial distribution may be used
whenever the number of nonzero differences is greater than or equal to:
A.
5.
B.
10.
C.
15.
D.
20.
47. In a normal approximation to the sign test, the standardised test statistic is calculated as z = –1.58. To
test the alternative hypothesis that the location of population 1 is to left of the location of population 2,
the p-value is:
A.
0.1142.
B.
0.2215.
C.
0.0571.
D.
0.2284.
48. The Wilcoxon rank sum test statistic T is approximately normally distributed whenever the sample
sizes are larger than:
A.
10.
B.
15.
C.
20.
D.
30.
49. The F-test of the randomised block design of the analysis of variance requires that the random variable
of interest must be normally distributed and the population variances must be equal. When the random
variable is not normally distributed, we can use:
A.
one-way ANOVA.
B.
two-way ANOVA.
C.
the chi-squared test.
D.
the Friedman test.
TRUE/FALSE
1. A non-parametric test is one that makes no assumptions about the specific shape of the population
from which a sample is drawn.

2. A two-independent-sample t–test corresponds to a Wilcoxon signed rank sum test for paired samples.
3. The Friedman test is the non-parametric counterpart of the randomised block experimental design of
the analysis of variance.
4. The Wilcoxon rank sum test for independent samples is the non-parametric counterpart of the paired
two-sample t-test of
D
.
5. The z-test approximation to the Wilcoxon signed rank sum test is used whenever the number of
nonzero differences is at least 50.
6. The z-test approximation to the Wilcoxon rank sum test for two independent samples requires that at
least one of the two sample sizes exceed 10.
7. The critical value is taken from the F-distribution whenever the test is a Kruskal–Wallis test.
8. The Friedman test statistic is approximately chi-squared distributed with (k – 1) degrees of freedom,
provided that either the number of blocks b or the number of treatments k is greater than or equal to 5.
9. A one-sample t–test is the parametric counterpart of the Wilcoxon signed rank sum test for matched
pairs.
10. A one-sample t-test is the parametric counterpart of the Kruskal–Wallis test.
11. A one-sample t-test is the parametric counterpart of the Friedman test for randomised block
experimental design.
12. A Wilcoxon rank sum test for comparing two independent samples involves two samples of sizes 5
and 8. The alternative hypothesis is that the location of population 1 is different from the location of
population 2. Using the 0.10 significance level, the appropriate critical values are 21 and 49.

13. A Wilcoxon rank sum test for comparing two independent samples involves two samples of sizes 6
and 9. The alternative hypothesis is that the location of population 1 is to the left of the location of
population 2. Using the 0.05 significance level, the appropriate critical values are 31 and 65.
14. In a Wilcoxon rank sum test for independent samples, the two sample sizes are 4 and 6, and the value
of the Wilcoxon test statistic is T = 25. If the test is two-tailed and the level of significance is 0.05,
then the null hypothesis will be rejected.
15. The Kruskal–Wallis test is applied to compare two or more populations when the samples are
independent and the data are normal.
16. The Wilcoxon signed rank sum test is applied to compare two populations when the samples are
matched pairs and the data are interval but not normally distributed.
17. In a normal approximation to the Wilcoxon rank sum test, the standardised test statistic is calculated as
z = 1.96. For a two-tailed test, the p-value is 0.025.
18. A Wilcoxon rank sum test for comparing two populations involves two independent samples of sizes
15 and 20. The value of the unstandardised test statistic is T = 225. The value of the standardised test
statistic is z = –1.50.
19. In a normal approximation to the sign test, the standardised test statistic is calculated as z = 2.07. If the
alternative hypothesis states that the location of population 1 is to the right of the location of
population 2, then the p-value of the test is 0.0192.
20. The Kruskal–Wallis test can be used to determine whether a difference exists between two
populations. However, to determine whether one population location is larger than another, we must
apply the Wilcoxon rank sum test.
21. The statistical methods discussed in this chapter are used to test characteristics of populations without
referring to specific parameters. For this reason, these techniques are called non-parametric techniques.
22. We can use the Friedman test to determine whether a difference exists between two populations.
However, if we want to determine whether one population location is larger than another, we must use
the sign test.

23. The Wilcoxon rank sum test is used to compare two populations when the samples are independent
and the data are either ordinal or interval but not normally distributed.
24. The sign test is employed to compare two populations when the experimental design is matched pairs,
and the data are ordinal but not normally distributed.
25. One of the required conditions of the sign test is that the number of nonzero differences n must be
smaller than or equal to 10.
26. The Kruskal–Wallis test can be used to test for a difference between two populations. It will produce
the same outcome as the two-tailed Wilcoxon rank sum test.
27. The Friedman test is employed to compare two or more populations when the data are generated from
a matched pairs experiment, and are either ordinal or interval but not normally distributed.
28. We can use the Friedman test to determine whether two populations differ. The conclusion will be the
same as that produced by the sign test.
SHORT ANSWER
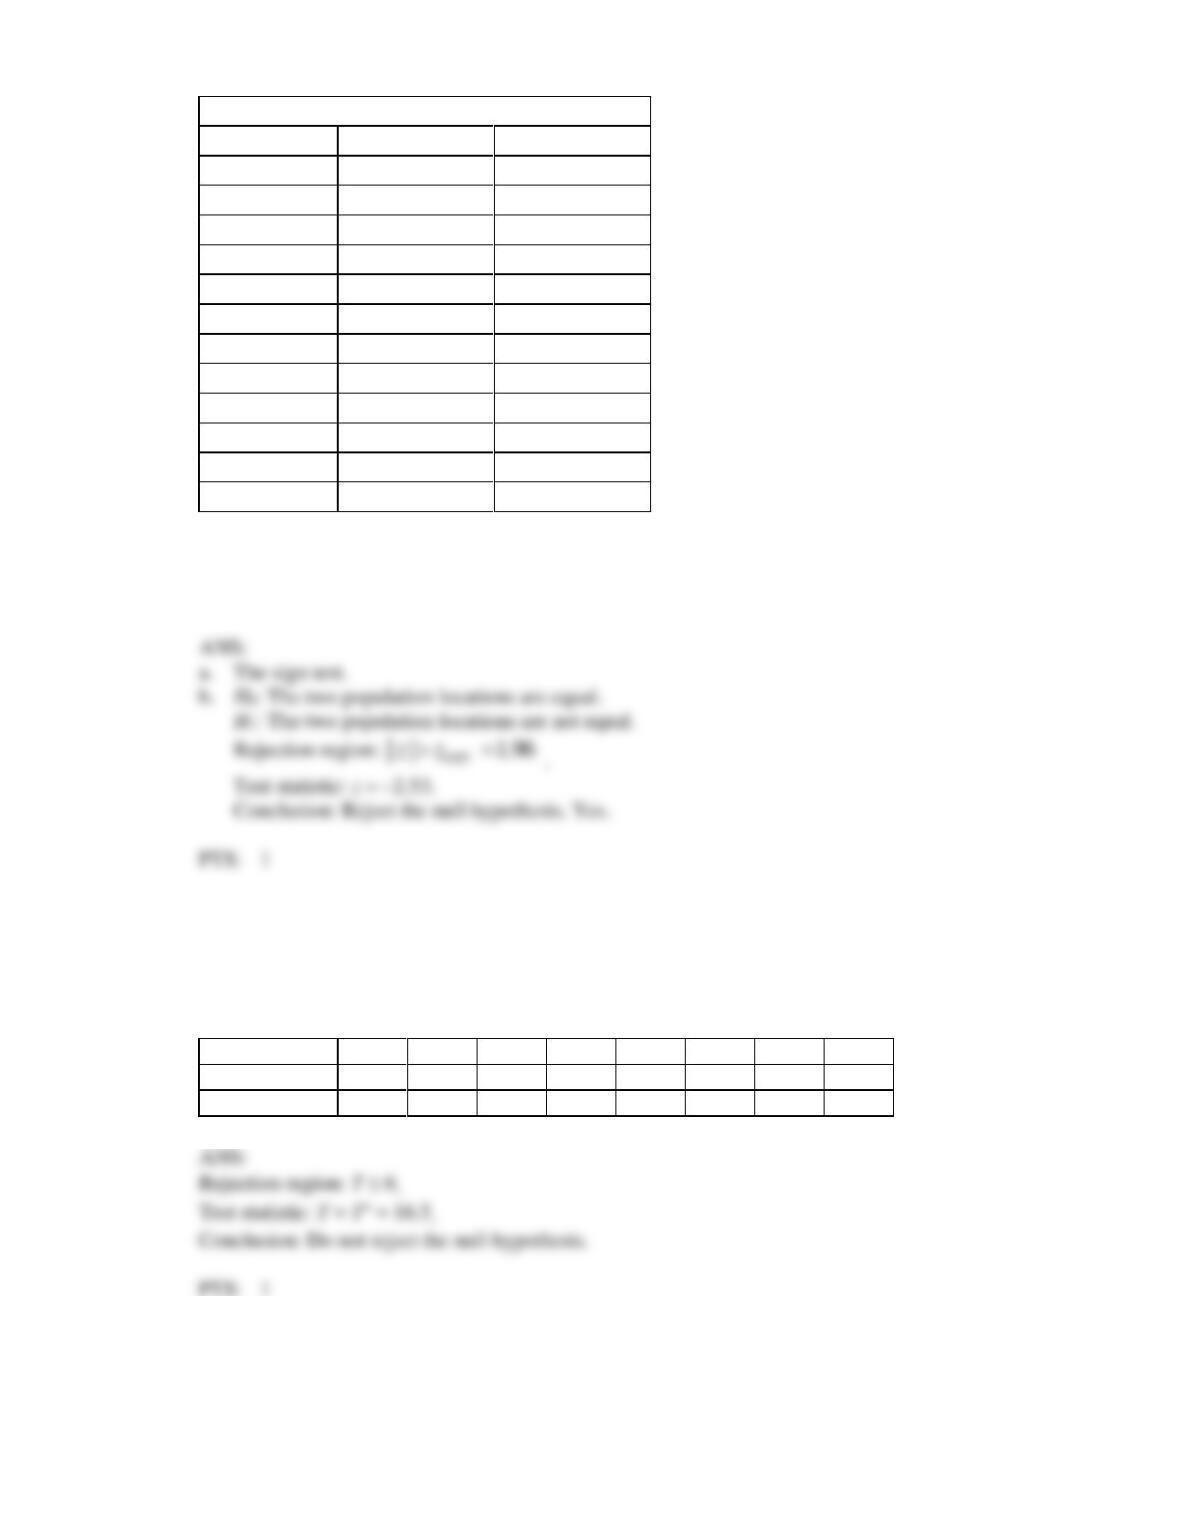
1. It is important to sponsors of television shows that viewers remember as much as possible about the
commercials. The advertising executive of a large company is trying to decide which of two
commercials to use on a weekly half-hour comedy. To help make a decision, she decides to have 12
individuals watch both commercials. After each viewing, each respondent is given a quiz consisting of
10 questions. The number of correct responses is recorded and listed below. Assume that the quiz
results are not normally distributed.
Quiz Scores
Respondent
Commercial 1
Commercial 2
1
7
9
2
8
9
3
6
6
4
10
10
5
5
4
6
7
9
7
5
7
8
4
5
9
6
8
10
7
9
11
5
6
12
8
10
a. Which test is appropriate for this situation?
b. Do these data provide enough evidence at the 5% significance level to conclude that the two
commercials differ?
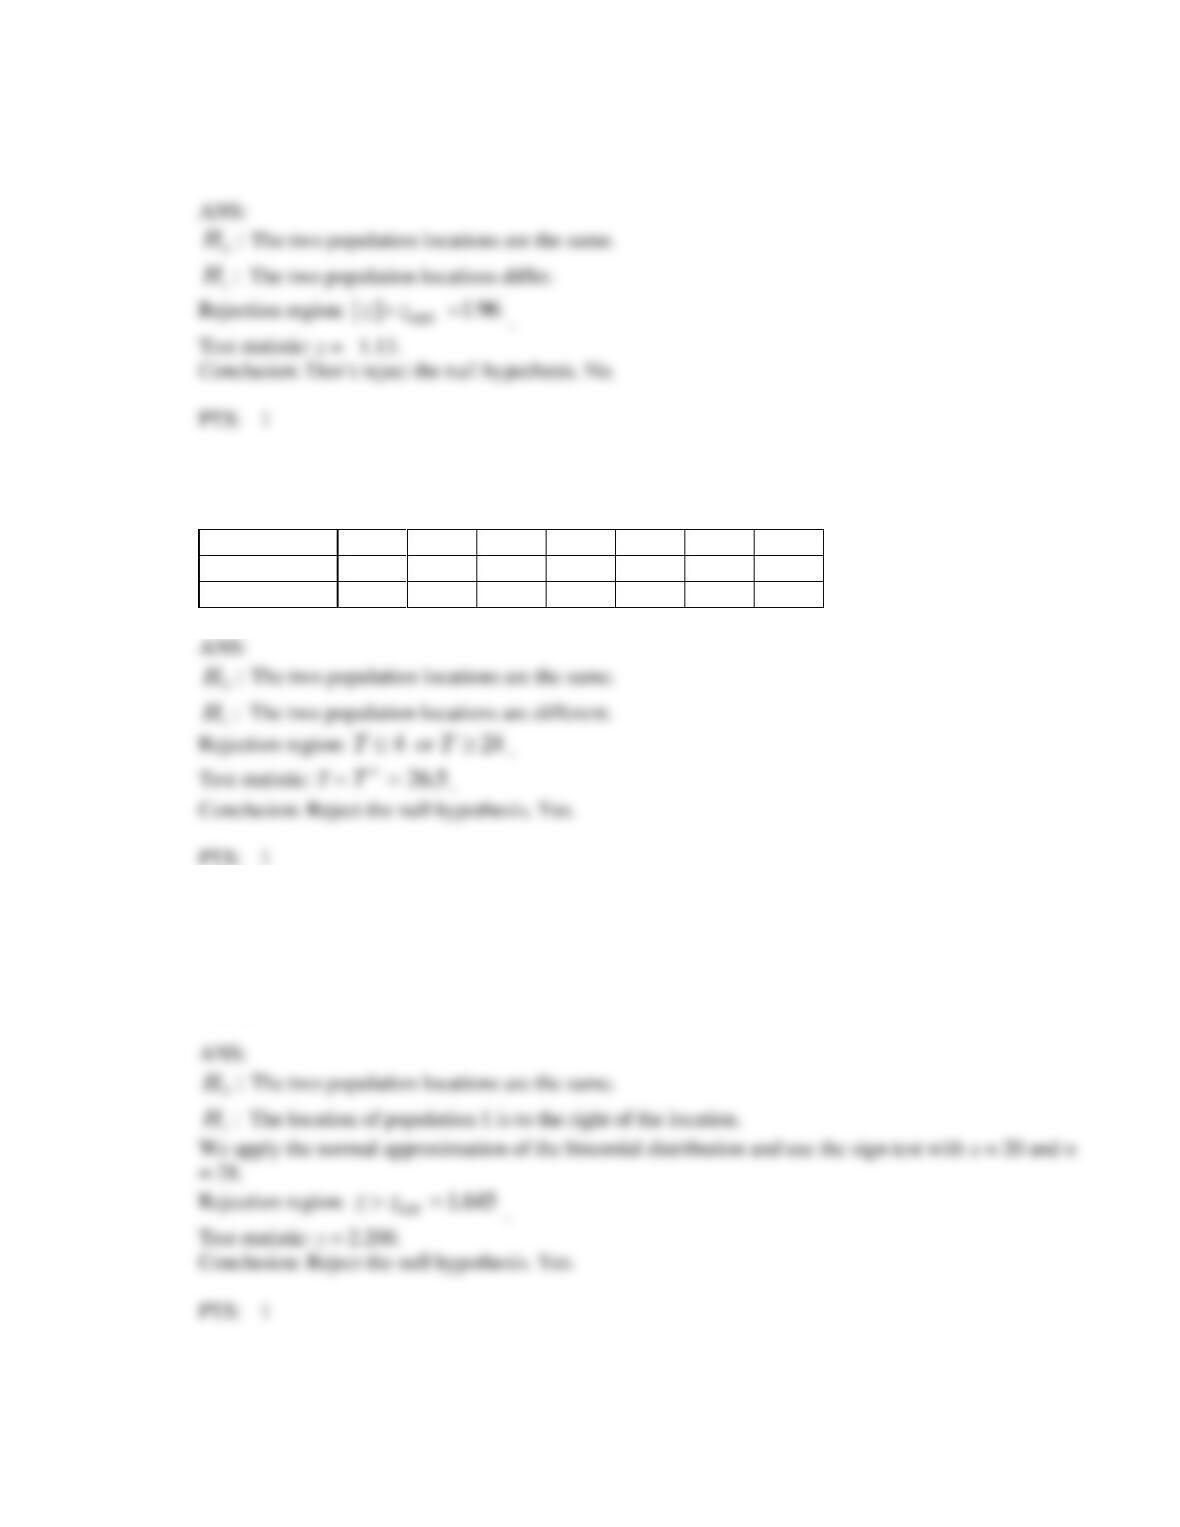
2. Use the 5% significance level to test the hypotheses.
:
0
H
The two population locations are the same
:
1
H
The location of population A is to the left of the location of population B,
given that the data below are drawn from a matched pairs experiment.
Matched Pair
1
2
3
4
5
6
7
8
A
8
10
11
7
6
7
13
10
B
6
9
12
10
12
10
5
8
3. Given the following statistics from a matched pairs experiment, perform the Wilcoxon signed rank
sum test to determine whether we can infer at the 5% significance level that the two population
locations differ.
520=
+
T
,
700=
−
T
, n = 50
4. Perform the Wilcoxon signed rank sum test for the following matched pairs to determine at the 10%
significance level whether the two population locations differ.
Matched Pair
1
2
3
4
5
6
7
A
13
9
11
10
12
8
14
B
11
10
10
6
10
4
12
5. A matched pairs experiment yielded the following results:
Number of positive differences = 18, number of negative differences = 7, number of zero differences =
3.
Can we infer at the 5% significance level that the location of population 1 is to the right of the location
of population 2?
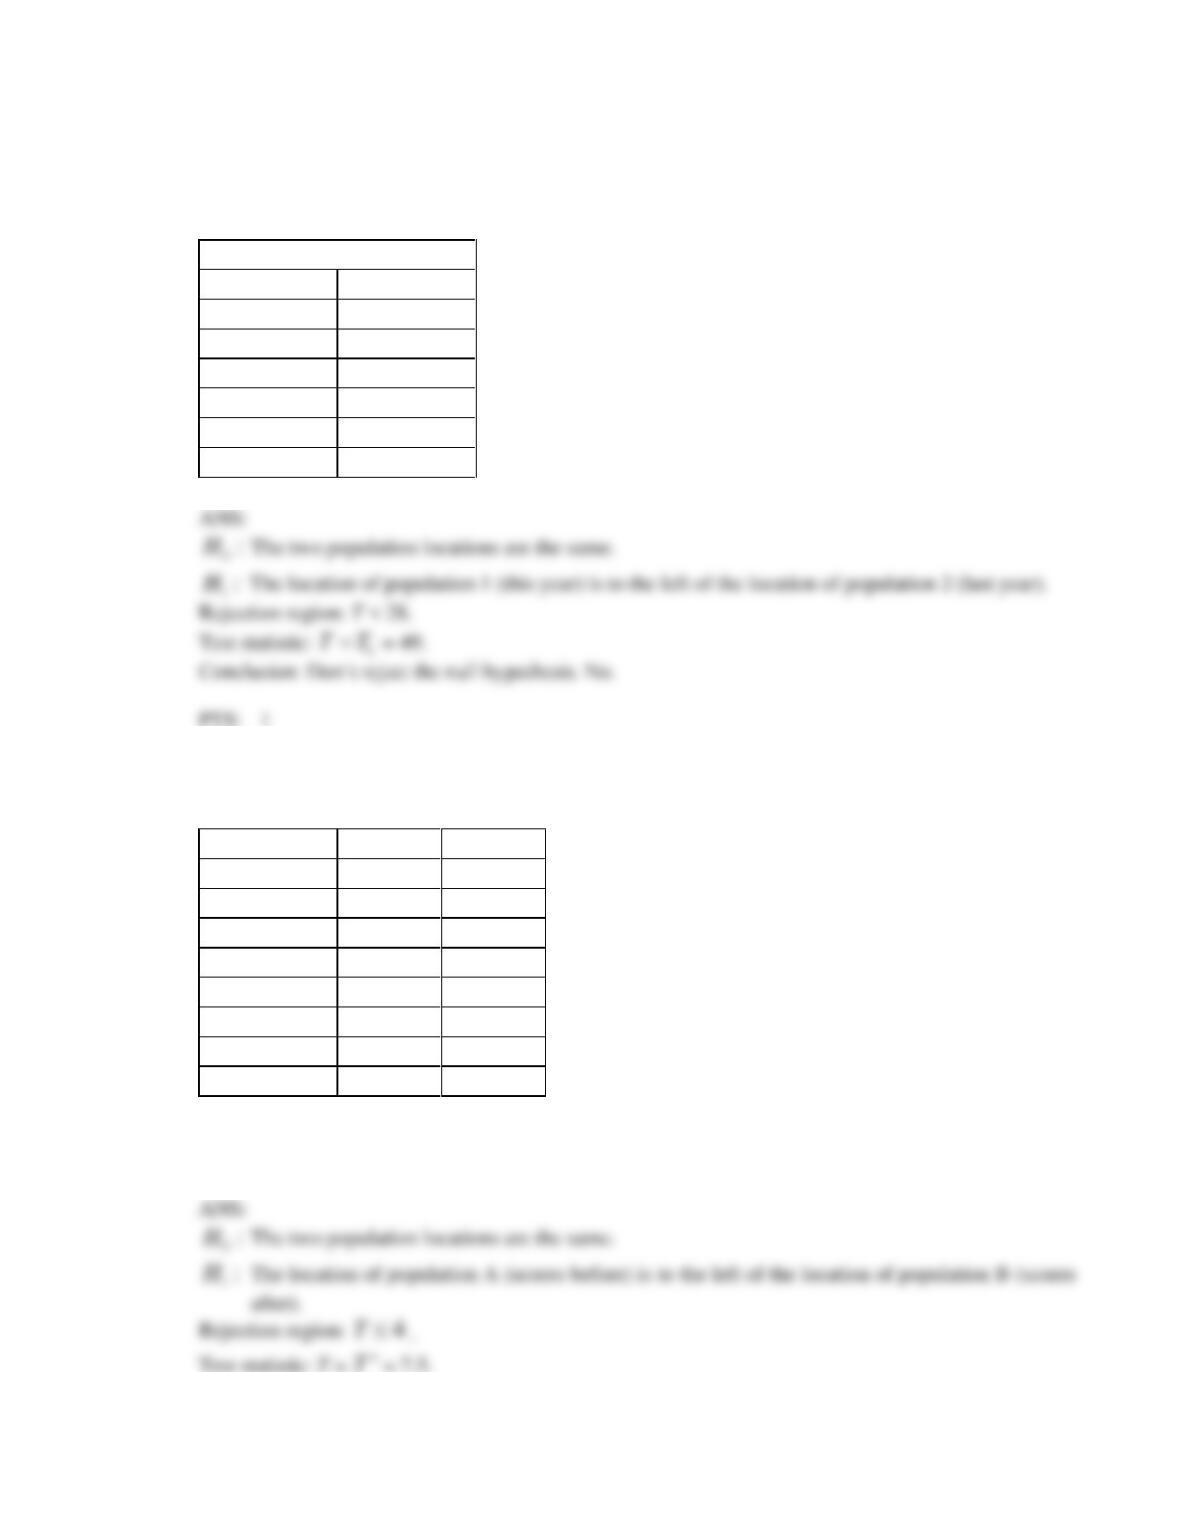
6. Each year the personnel department in a large corporation assesses the performance of all of its
employees. Each employee is rated for various aspects of his or her job on a 7-point scale where
1 = very unsatisfactory and 7 = satisfactory. The president of the company believes that the assessment
scores this year are lower than last year’s. To examine the validity of this belief, she draws a random
sample of six employees’ scores from last year and another six employees’ scores this year. Do the
data listed below allow the president to conclude at the 5% significance level that her belief is correct?
Employees Ratings Scores
This Year
Last Year
5
5
6
5
4
3
5
3
5
4
4
3
7. The following data represent the test scores of eight students on a statistics test before and after
attending extra help sessions for the test.
Student
Before
After
Abby
82
90
Brenda
75
86
Carmen
90
90
David
68
62
Edward
87
89
Frank
73
75
Gill
81
78
Heidi
92
98
Uses the Wilcoxon signed rank sum test to determine at the 5% significance level whether the extra
help sessions have been effective.
8. Use the 5% significance level to test the hypotheses.
:
0
H
The two population locations are the same
:
1
H
The two population locations are different,
given that the data below are drawn from a matched pair experiment.
Matched Pair
1
2
3
4
5
6
7
8
9
10
A
32
15
19
25
39
18
26
41
33
23
B
28
14
20
20
27
23
25
31
25
23
9. Use the Wilcoxon rank sum test on the data below to determine at the 5% significance level whether
the location of population A is to the left of the location of population B.
Sample A:
75
60
67
54
69
Sample B:
80
84
100
74
90
:
0
H
:
1
H
10. The following data were generated from a blocked experiment. Conduct a Friedman test at the 5%
significance level to determine if at least two population locations differ.
Treatment
Block
1
2
3
4
1
69
84
78
76
2
67
87
52
81
3
85
97
75
69
4
65
72
62
73
5
58
87
52
62
ANS:
11. Given the following statistics, use the Wilcoxon rank sum test to determine at the 5% significance
whether the location of population A is to the right of the location of population B.
42=
A
T
,
6=
A
n
,
36=
B
T
,
9=
B
n
.
:
0
H
:
1
H
12. In testing the hypotheses
H0: The two population locations are the same
H1: The location of population A is to the left of the location of population B,
with data drawn from two independent samples, the following statistics are calculated:
6=
A
n
,
32=
A
T
,
8=
B
n
,
73=
B
T
.
a. Which test is used for testing the hypotheses above?
b. What is the p-value of this test?
13. In testing the hypotheses:
:
0
H
The two population locations are the same
:
1
H
The two population locations are different,
with data drawn from two independent samples, the following statistics are calculated:
5=
A
n
,
22=
A
T
,
9=
B
n
,
83=
B
T
.
a. Which test is used for testing the hypotheses above?
b. What is the p-value of this test?
:
0
H
14. Use the Wilcoxon rank sum test on the data below to determine at the 10% significance level whether
the two population locations differ.
Sample 1:
15
14
15
16
16
17
13
15
16
14
Sample 2:
17
15
15
16
18
15
17
17
15
18
:
0
H
:
1
H
15. In testing the hypotheses:
:
0
H
The two population locations are the same
:
1
H
The two population locations are different,
with data drawn from a matched pairs experiment, the following statistics are calculated:
40=n
,
238=
+
T
,
582=
−
T
.
a. Which test is used for testing the hypotheses above?
b. What is the p-value of this test?
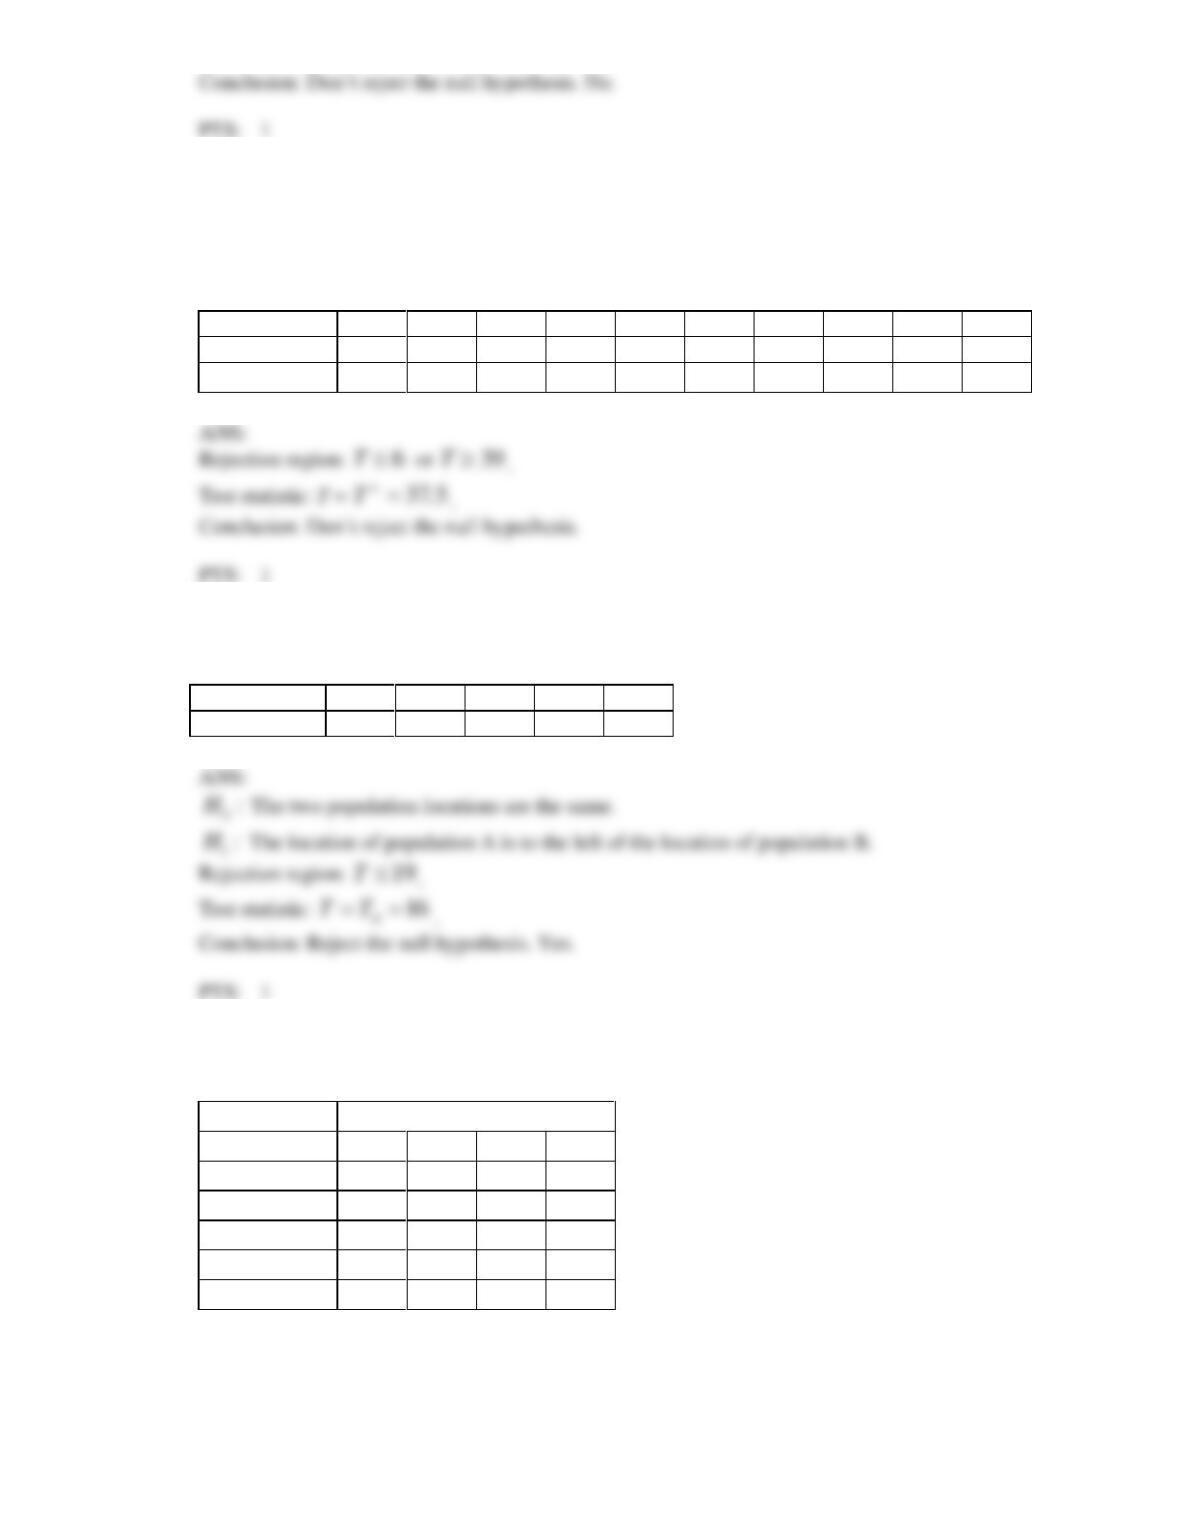
16. In recent years, airlines have been subjected to various forms of criticism. An executive of Airline X
has taken a quick poll of 16 regular airplane passengers. Each passenger is asked to rate the airline he
or she last flew on. The ratings are on a 7-point Likert scale, where 1 = poor and 7 = very good. Of the
16 respondents, six last flew on Airline X and the remainder flew on other airlines. The ratings are
shown below. Can the executive conclude from these data with 5% significance that Airline X is more
highly rated than the other airlines?
Ratings of Airlines
Airline X
Other Airlines
6
5
4
3
5
3
6
2
5
3
3
4
3
5
3
1
17. In testing the hypotheses:
:
0
H
The two population locations are the same
:
1
H
The location of population A is to the right of the location of population B,
with data drawn from a matched pairs experiment, the following statistics are calculated:
27=n
,
271=
+
T
,
107=
−
T
.
a. Which test is used in testing the hypotheses above?
b. What is the p-value of this test?
18. Because of the rising costs of industrial accidents many chemical, mining and manufacturing firms
have instituted safety courses. Employees are encouraged to take these courses, which are designed to
heighten safety awareness. A company is trying to decide which one of two courses to institute. To
help make a decision, eight employees take course 1 and another eight take course 2. Each employee
writes a test, which is marked out of a possible 25. The results are shown below. Do these data provide
sufficient evidence at the 5% level of significance to conclude that the marks from course 2 are higher
than those of course 1? Assume that the scores are not normally distributed.
Safety Test Scores
Course 1
Course 2
14
20
21
18
17
22
14
15
17
23
19
21
20
19
16
15
:
0
H