32. An economist is in the process of developing a model to predict the price of gold. She believes that the
two most important variables are the price of a barrel of oil
)( 1
x
and the interest rate
).( 2
x
She
proposes the first-order model with interaction:
++++= 31322110 xxxxy
.
A random sample of 20 daily observations was taken. The computer output is shown below.
THE REGRESSION EQUATION IS
=y
2121 36.17.143.226.115 xxxx −++
.
Predictor
Coef
StDev
T
Constant
115.6
78.1
1.480
1
x
22.3
7.1
3.141
2
x
14.7
6.3
2.333
21xx
–1.36
0.52
–2.615
S = 20.9 R-Sq = 55.4%.
ANALYSIS OF VARIANCE
Source of Variation
df
SS
MS
F
Regression
3
8661
2887.0
6.626
Error
16
6971
435.7
Total
19
15 632
Is there sufficient evidence at the 1% significance level to conclude that the interest rate and the price
of gold are linearly related?
33. An economist is in the process of developing a model to predict the price of gold. She believes that the
two most important variables are the price of a barrel of oil
)( 1
x
and the interest rate
).( 2
x
She
proposes the first-order model with interaction:
++++= 31322110 xxxxy
.
A random sample of 20 daily observations was taken. The computer output is shown below.
THE REGRESSION EQUATION IS
=y
2121 36.17.143.226.115 xxxx −++
.
Predictor
Coef
StDev
T
Constant
115.6
78.1
1.480
1
x
22.3
7.1
3.141
2
x
14.7
6.3
2.333
21xx
–1.36
0.52
–2.615
S = 20.9 R-Sq = 55.4%.
ANALYSIS OF VARIANCE
Source of Variation
df
SS
MS
F
Regression
3
8661
2887.0
6.626
Error
16
6971
435.7
Total
19
15 632
Is there sufficient evidence at the 1% significance level to conclude that the interaction term should be
retained?
34. An economist is in the process of developing a model to predict the price of gold. She believes that the
two most important variables are the price of a barrel of oil
)( 1
x
and the interest rate
).( 2
x
She
proposes the first-order model with interaction:
++++= 31322110 xxxxy
.
A random sample of 20 daily observations was taken. The computer output is shown below.

THE REGRESSION EQUATION IS
=y
2121 36.17.143.226.115 xxxx −++
.
Predictor
Coef
StDev
T
Constant
115.6
78.1
1.480
1
x
22.3
7.1
3.141
2
x
14.7
6.3
2.333
21xx
–1.36
0.52
–2.615
S = 20.9 R-Sq = 55.4%.
ANALYSIS OF VARIANCE
Source of Variation
df
SS
MS
F
Regression
3
8661
2887.0
6.626
Error
16
6971
435.7
Total
19
15 632
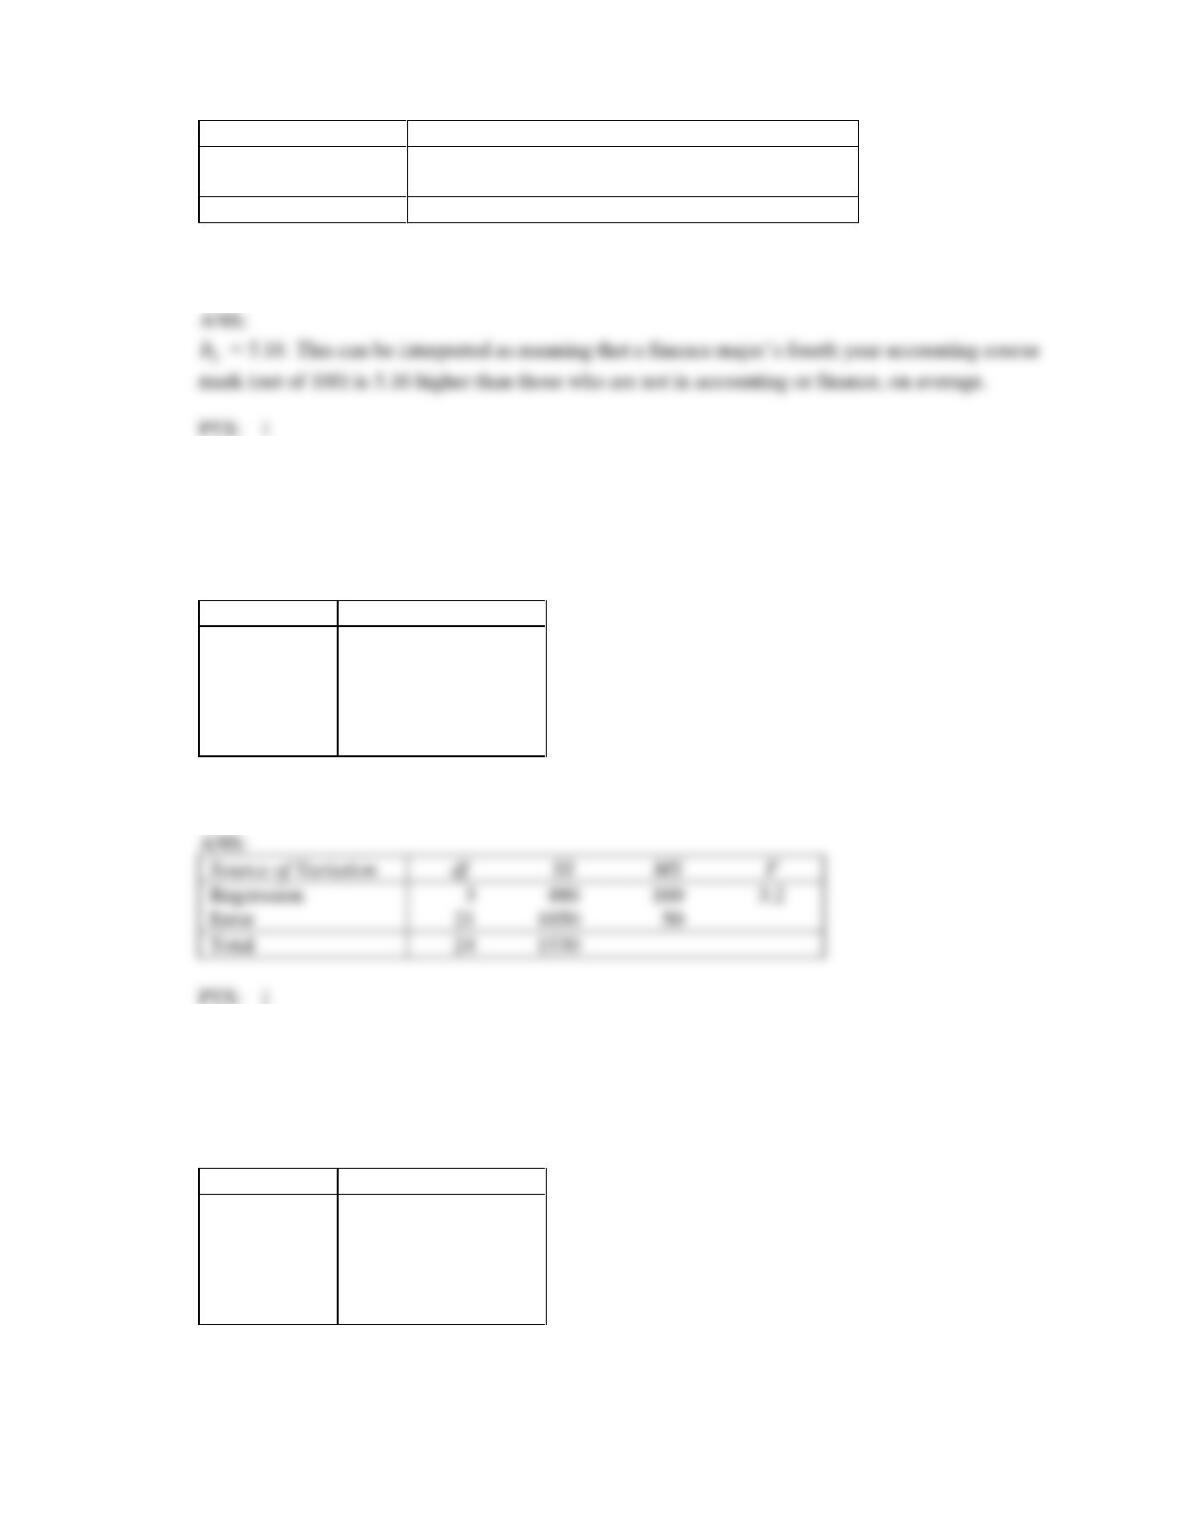
Interpret the coefficient
1
b
.
35. A professor of accounting wanted to develop a multiple regression model to predict the students’
grades in her fourth-year accounting course. She decides that the two most important factors are the
student’s grade point average (GPA) in the first three years and the student’s major. She proposes the
model:
++++= 3322110 xxxy
.
where
y
= fourth-year accounting course mark (out of 100).
1
x
= GPA in first three years (range 0 to 12).
2
x
= 1 if student’s major is accounting.
= 0 if not.
3
x
= 1 if student’s major is finance.
= 0 if not.
The computer output is shown below.
THE REGRESSION EQUATION IS
=y
321 16.542.1073.614.9 xxx +++
.
Predictor
Coef
StDev
T
Constant
9.14
7.10
1.287
1
x
6.73
1.91
3.524
2
x
10.42
4.16
2.505
3
x
5.16
3.93
1.313
1
b
S = 15.0 R-Sq = 44.2%.
ANALYSIS OF VARIANCE
Source of Variation
df
SS
MS
F
Regression
3
17 098
5699.333
25.386
Error
96
21 553
224.510
Total
99
38 651
Do these results allow us to conclude at the 1% significance level that the model is useful in predicting
the fourth-year accounting course mark?
36. A professor of accounting wanted to develop a multiple regression model to predict the students’
grades in her fourth-year accounting course. She decides that the two most important factors are the
student’s grade point average (GPA) in the first three years and the student’s major. She proposes the
model:
++++= 3322110 xxxy
.
where
y
= fourth-year accounting course mark (out of 100).
1
x
= GPA in first three years (range 0 to 12).
2
x
= 1 if student’s major is accounting.
= 0 if not.
3
x
= 1 if student’s major is finance.
= 0 if not.
The computer output is shown below.
THE REGRESSION EQUATION IS
=y
321 16.542.1073.614.9 xxx +++
.
Predictor
Coef
StDev
T
Constant
9.14
7.10
1.287
1
x
6.73
1.91
3.524
2
x
10.42
4.16
2.505
3
x
5.16
3.93
1.313
S = 15.0 R-Sq = 44.2%.
ANALYSIS OF VARIANCE
Source of Variation
df
SS
MS
F
Regression
3
17 098
5699.333
25.386
Error
96
21 553
224.510
Total
99
38 651
Do these results allow us to conclude at the 1% significance level that on average accounting majors
outperform those whose majors are not accounting or finance?
37. A professor of accounting wanted to develop a multiple regression model to predict the students’
grades in her fourth-year accounting course. She decides that the two most important factors are the
student’s grade point average (GPA) in the first three years and the student’s major. She proposes the
model:
++++= 3322110 xxxy
.
where
y
= fourth-year accounting course mark (out of 100).
1
x
= GPA in first three years (range 0 to 12).
2
x
= 1 if student’s major is accounting.
= 0 if not.
3
x
= 1 if student’s major is finance.
= 0 if not.
The computer output is shown below.
THE REGRESSION EQUATION IS
=y
321 16.542.1073.614.9 xxx +++
.
Predictor
Coef
StDev
T
Constant
9.14
7.10
1.287
1
x
6.73
1.91
3.524
2
x
10.42
4.16
2.505
3
x
5.16
3.93
1.313
S = 15.0 R-Sq = 44.2%.
ANALYSIS OF VARIANCE
Source of Variation
df
SS
MS
F
Regression
3
17 098
5699.333
25.386
Error
96
21 553
224.510
Total
99
38 651
Do these results allow us to conclude at the 1% significance level that on average finance majors
outperform those whose majors are not accounting or finance?
38. A professor of accounting wanted to develop a multiple regression model to predict the students’
grades in her fourth-year accounting course. She decides that the two most important factors are the
student’s grade point average (GPA) in the first three years and the student’s major. She proposes the
model:
++++= 3322110 xxxy
.
where
y
= fourth-year accounting course mark (out of 100).
1
x
= GPA in first three years (range 0 to 12).
2
x
= 1 if student’s major is accounting.
= 0 if not.
3
x
= 1 if student’s major is finance.
= 0 if not.
The computer output is shown below.
THE REGRESSION EQUATION IS
=y
321 16.542.1073.614.9 xxx +++
.
Predictor
Coef
StDev
T
Constant
9.14
7.10
1.287
1
x
6.73
1.91
3.524
2
x
10.42
4.16
2.505
3
x
5.16
3.93
1.313
S = 15.0 R-Sq = 44.2%.
ANALYSIS OF VARIANCE
Source of Variation
df
SS
MS
F
Regression
3
17 098
5699.333
25.386
Error
96
21 553
224.510
Total
99
38 651
Do these results allow us to conclude at the 1% significance level that grade point average in the first
three years is linearly related to fourth-year accounting course mark?
39. A professor of accounting wanted to develop a multiple regression model to predict the students’
grades in her fourth-year accounting course. She decides that the two most important factors are the
student’s grade point average (GPA) in the first three years and the student’s major. She proposes the
model:
++++= 3322110 xxxy
.
where
y
= fourth-year accounting course mark (out of 100).
1
x
= GPA in first three years (range 0 to 12).
2
x
= 1 if student’s major is accounting.
= 0 if not.
3
x
= 1 if student’s major is finance.
= 0 if not.
The computer output is shown below.
THE REGRESSION EQUATION IS
=y
321 16.542.1073.614.9 xxx +++
.
Predictor
Coef
StDev
T
Constant
9.14
7.10
1.287
1
x
6.73
1.91
3.524
2
x
10.42
4.16
2.505
3
x
5.16
3.93
1.313
S = 15.0 R-Sq = 44.2%.
ANALYSIS OF VARIANCE
Source of Variation
df
SS
MS
F
Regression
3
17 098
5699.333
25.386
Error
96
21 553
224.510
Total
99
38 651
Interpret the coefficient
3
b
.
40. A first-order model was used in a regression analysis involving 25 observations to study the
relationship between a dependent variable y and three independent variables,
1
x
,
2
x
and
3
x
. The
analysis showed that the mean squares for regression is 160 and the sum of squares for error is 1050.
In addition, the following is a partial computer printout.
Predictor
Coef
StDev
Constant
25
4
1
x
18
6
2
x
–12
4.8
3
x
6
5
Develop the ANOVA table.
Source of Variation
df
SS
F
Regression
Error
21
50
Total
41. A first-order model was used in a regression analysis involving 25 observations to study the
relationship between a dependent variable y and three independent variables,
1
x
,
2
x
and
3
x
. The
analysis showed that the mean squares for regression is 160 and the sum of squares for error is 1050.
In addition, the following is a partial computer printout.
Predictor
Coef
StDev
Constant
25
4
1
x
18
6
2
x
–12
4.8
3
x
6
5
Is there enough evidence at the 5% significance level to conclude that the model is useful in predicting
the value of y?
42. A first-order model was used in a regression analysis involving 25 observations to study the
relationship between a dependent variable y and three independent variables,
1
x
,
2
x
and
3
x
. The
analysis showed that the mean squares for regression is 160 and the sum of squares for error is 1050.
In addition, the following is a partial computer printout.
Predictor
Coef
StDev
Constant
25
4
1
x
18
6
2
x
–12
4.8
3
x
6
5
Test at the 5% significance level to determine whether
1
x
is linearly related to y.
43. A first-order model was used in a regression analysis involving 25 observations to study the
relationship between a dependent variable y and three independent variables,
1
x
,
2
x
and
3
x
. The
analysis showed that the mean squares for regression is 160 and the sum of squares for error is 1050.
In addition, the following is a partial computer printout.
Predictor
Coef
StDev
Constant
25
4
1
x
18
6
2
x
–12
4.8
3
x
6
5
Is there sufficient evidence at the 5% significance level to indicate that
2
x
is negatively linearly
related to y?
44. A first-order model was used in a regression analysis involving 25 observations to study the
relationship between a dependent variable y and three independent variables,
1
x
,
2
x
and
3
x
. The
analysis showed that the mean squares for regression is 160 and the sum of squares for error is 1050.
In addition, the following is a partial computer printout.
Predictor
Coef
StDev
Constant
25
4
1
x
18
6
2
x
–12
4.8
3
x
6
5
Is there sufficient evidence at the 5% significance level to indicate that
3
x
is positively linearly related
to y?