Chapter 17—Statistical inference : A review of Chapters 11–16
MULTIPLE CHOICE
1. In testing the difference between two population means for which the population variances are
unknown and assumed to be equal, two independent samples are drawn from the populations. Which
of the following tests is appropriate?
A.
z-test.
B.
Equal-variances t-test.
C.
F-test.
D.
Matched pairs t–test.
2. When the necessary conditions are met, a two-tail test is being conducted to test the difference
between two population proportions. If the value of the test statistic z is 2.22, then the p-value is:
A.
0.0132.
B.
0.4868.
C.
0.9736.
D.
0.0264.
3. A random sample of 20 observations taken from a normally distributed population revealed a sample
mean of 65 and a sample variance of 16. The lower limit of a 90% confidence interval for the
population mean would equal:
A.
66.546.
B.
63.454.
C.
63.812.
D.
66.188.
4. In testing for the equality of two population variances, when the populations are normally distributed,
the 5% level of significance has been used. To determine the rejection region, it will be necessary to
refer to the F table corresponding to an upper-tail area of:
A.
0.950.
B.
0.050.
C.
0.025.
D.
0.100.
5. When the necessary conditions are met, a two-tail test is being conducted to test the difference
between two population proportions. The two sample proportions are
1
ˆ
p
= 0.21 and
2
ˆ
p
= 0.15, and the
standard error of the sampling distribution of are
1
ˆ
p
−
2
ˆ
p
is 0.018. The calculated value of the test
statistic will be:
A.
t = –3.33.
B.
z = 3.33.
C.
t = 3.33.
D.
None of the is correct.
6. A random sample of size 15 taken from a normally distributed population resulted in a sample
variance of 25. The upper limit of a 99% confidence interval for the population variance would be:
A.
12.868.
B.
92.032.
C.
85.896.
D.
75.100.
7. In testing the null hypothesis
0: 210 =− ppH
, if
0
H
is true, the test could lead to:
A.
a Type I error.
B.
a Type II error.
C.
either a Type I or a Type II error.
D.
none of the above.
8. A sample of size 200 from population 1 has 50 successes. A sample of size 200 from population 2 has
40 successes. The value of the test statistic for testing the null hypothesis that the proportion of
successes in population 1 exceeds the proportion of successes in population 2 by 0.025 is:
A.
1.96.
B.
1.25.
C.
0.5998.
D.
1.20.
9. A sample of size 300 had 96 successes. The lower limit of the 99% confidence interval for the
population proportion is:
A.
0.3728.
B.
0.2672.
C.
0.2506.
D.
0.3894.
10. Assuming that all necessary conditions are met, what needs to be changed in the formula
)()( 21
11
2
2/21 nn
p
szxx +−
so that we can use it to construct a confidence interval estimate for the
difference of two population means when the population variances are assumed to be equal?
A.
The
21 xx −
should be replaced by
21
−
.
B.
The z
2/
should be replaced by
z
.
C.
The z
2/
should be replaced by
2/
t
.
D.
The
2
p
s
should be replaced by
2
2
2
1ss +
.

11. In testing the difference between two population means using two independent samples, the population
standard deviations are assumed to be known and the calculated test statistic equals 1.05. If the test is
upper-tail and the 10% level of significance has been specified, the conclusion should be to:
A.
reject the null hypothesis.
B.
not to reject the null hypothesis.
C.
choose two other independent samples.
D.
None of the above is correct.
12. In a hypothesis test for the population variance, the hypotheses are:
25: 2
0=
H
.
25: 2
1
H
.
If the sample size is 15 and the test is being carried out at the 5% level of significance, the null
hypothesis will be rejected if:
A.
5706.6
2
.
B.
9958.24
2
.
C.
2609.7
2
.
D.
6848.23
2
.
13. Two independent samples of sizes 50 and 50 are randomly selected from two populations to test the
difference between the population means,
21
−
. The sampling distribution of the sample mean
difference
21 xx −
is:
A.
normally distributed.
B.
approximately normal.
C.
t-distributed with 98 degrees of freedom.
D.
chi-squared distributed with 99 degrees of freedom.
14. Two independent samples of sizes 20 and 25 are randomly selected from two normal populations with
equal variances. In order to test the difference between the population means, the test statistic is:
A.
a standard normal random variable.
B.
approximately standard normal random variable.
C.
Student t distributed with 45 degrees of freedom.
D.
Student t distributed with 43 degrees of freedom.
15. Based on sample data, the 95% confidence interval limits for the population mean are
LCL = 124.6 and UCL = 148.2. If the 5% level of significance were used in testing the hypotheses:
H0 :
= 150
H1 :
150,
the null hypothesis:
A.
would not be rejected.
B.
would be rejected.
C.
would have to be revised.
D.
There is insufficient information to decide whether to maintain or reject the null
hypothesis.
16. After calculating the sample size needed to estimate a population proportion to within 0.05, you have
been told that the maximum allowable error must be reduced to just 0.025. If the original calculation
led to a sample size of 1000, the sample size will now have to be:
A.
2000.
B.
4000.
C.
1000.
D.
8000.
17. In testing the hypotheses:
5.76:
0=
H
5.76:
1
H
,
suppose that we rejected the null hypothesis at
= 0.05. For which of the following
values do we
also reject the null hypothesis?
A.
0.025.
B.
0.010.
C.
0.100.
D.
All other
values that are smaller than 0.05.
18. When the necessary conditions are met, a two-tail test is being conducted to test the hypothesis that
two population proportions are equal. The two sample proportions are
1
ˆ
p
= 0.25 and
2
ˆ
p
= 0.20, and
the sample sizes are
=
1
n
140 and
=
2
n
200. The pooled estimate of the population proportion is:
A.
0.221.
B.
0.536.
C.
0.375.
D.
0.229.
19. For a sample of size 25 observations taken from a normally distributed population with standard
deviation of 6, a 95% confidence interval estimate for the population mean would require the use of:
A.
t = 2.064.
B.
t = 1.711.
C.
2
= 39.3641.
D.
z = 1.96.
20. When the necessary conditions are met, a two-tail test is being conducted to test the difference
between two population proportions, but your statistical software provides only a one-tail area of 0.042
as part of its output. The p-value for this test will be:
A.
0.958.
B.
0.021.

C.
0.042.
D.
0.084.
21. Which of the following statements is correct regarding the percentile points of the F-distribution?
A.
0.10,10,15 0.90,15,10
1/F F=
.
B.
0.10,10,15 0.90,10,15
1/F F=
.
C.
0.90,10,15 0.10,10,15
1/F F=
.
D.
0.90,10,15 0.90,15,10
1/F F=
.
22. In constructing a 95% interval estimate for the ratio of two population variances,
2
1
/
2
2
, two
independent samples of sizes 30 and 40 are drawn from the populations. If the sample variances are
425 and 675, then the upper confidence limit is about:
A.
1.2215.
B.
0.3132.
C.
1.2656.
D.
0.3246.
23. In constructing a 90% confidence interval estimate for the difference between the means of two
normally distributed populations, where the unknown population variances are assumed not to be
equal, summary statistics computed from two independent samples are as follows:
40
1=n
,
95
1=x
,
5.12
1=s
.
30
2=n
,
75
2=x
,
5.35
2=
s
.
The lower confidence limit is:
A.
30.086.
B.
8.542.
C.
0.914.
D.
31.458.
24. Which of the following is a required condition for using the normal approximation to the binomial in
constructing interval estimate for the difference between two population proportions?
A.
30
11 pn
and
30
22 pn
.
B.
5
11
pn
and
5
22 pn
.
C.
,5
ö
11 pn
,5
ö
11 qn
,5
ö22 pn
and
5
ö
22 qn
.
D.
,5
11 pn
,5
11 qn
,5
22 pn
and
5
22 qn
.
25. Suppose that a one-tail t-test is being applied to find out if the population mean is at least 75. The level
of significance is 0.05 and 20 observations were sampled. The rejection region is:
A.
t > 1.729.

B.
t < 2.086.
C.
t > 2.093.
D.
t < 1.725.
26. In testing the hypotheses:
150:
0=
H
150:
1
H
,
the sample mean is found to be 125. The null hypothesis:
A.
should be rejected.
B.
should not be rejected.
C.
should be rejected only if n > 30.
D.
None of the above answers is correct.
27. A sample of size 125 selected from one population has 55 successes, and a sample of size 140 selected
from a second population has 70 successes. The test statistic for testing the equality of the population
proportions is equal to:
A.
–0.060.
B.
–0.977.
C.
–0.940.
D.
–0.472.
28. In a hypothesis test for the population variance, the hypotheses are:
175: 2
0=
H
175: 2
1
H
,
If the sample size is 25 and the test is being carried out at the 5% level of significance, the rejection
region will be:
A.
2
< 15.6587 or
2
> 33.1963.
B.
2
<12.4011 or
2
>39.3641.
C.
2
< 16.4734 or
2
>34.3816.
D.
2
< 13.1197 or
2
<37.6525.
29. A random sample of 30 observations is selected from a normally distributed population. The sample
variance is 12. In the 90% confidence interval for the population variance, the upper limit will be:
A.
15.176.
B.
8.177.
C.
19.652.
D.
16.941.

30. From a sample of 500 items, 30 were found to be defective. The point estimate of the population
proportion defective will be:
A.
0.06.
B.
30.0.
C.
16.667.
D.
None of the above answers is correct.
31. Two samples of sizes 22 and 18 are independently drawn from two normal populations, where the
unknown population variances are assumed to be equal. The number of degrees of freedom of the
equal-variances t-test statistic is:
A.
39.
B.
40.
C.
38.
D.
41.
32. In testing the hypotheses:
0: 0.50H p =
1: 0.50H p
,
at the 10% significance level, if the sample proportion is 0.56, and the standard error of the sample
proportion is 0.025, the appropriate conclusion is:
A.
to reject
0
H
.
B.
not to reject
0
H
.
C.
to reject
1
H
.
D.
to reject both
0
H
and
1
H
.
33. Two independent samples of sizes 35 and 40 are randomly selected from two normally distributed
populations. Assume that the population variances are unknown but equal. In order to test the
difference between the population means,
21
−
, the sampling distribution of the sample mean
difference,
21 xx −
, is:
A.
normally distributed.
B.
t-distributed with 75 degrees of freedom.
C.
t-distributed with 73 degrees of freedom.
D.
F-distributed with 34 and 39 degrees of freedom.
34. In testing whether the means of two normal populations are equal, summary statistics computed for
two independent samples are as follows:
20
1=n
,
8.10
1=
x
,
10.90s=
.
18
2=n
,
6.9
2=
x
,
10.1
2=s
.
Assume that the population variances are unequal. The standard error of the sampling distribution of
the sample mean difference
21 xx −
is equal to:
A.
0.3247.
B.
0.3282.
C.
0.1054.
D.
0.1125.
35. The number of degrees of freedom associated with the t-test, when the data are gathered from a
matched pairs experiment with 15 pairs, is:
A.
30.
B.
15.
C.
28.
D.
14.
36. For a sample of 25 observations taken from a normally distributed population with standard deviation
of 6, a 95% confidence interval estimate for the population mean would require the use of:
A.
t = 2.064.
B.
t = 1.711.
C.
X2 = 39.3641.
D.
z = 1.96.
37. When the necessary conditions are met, a one-tail test is being conducted to test the difference between
two population proportions, but your statistical software provides only a two-tail area of 0.058 as part
of its output. The p-value for this test will be:
A.
0.029.
B.
0.971.
C.
0.029 or 0.972, depending on whether the test is a left-tail or a right-tail test.
D.
0.058.
38. In testing the hypotheses:
H0 : μ = 140
H1 : μ 140,
suppose that we rejected the null hypothesis at α = .05. Then for which of the following α values do we
also reject the null hypothesis?
A.
.025.
B.
.010.
C.
.100.
D.
all other α values that are smaller than .05.
TRUE/FALSE
1. When comparing two population variances, we test H0: = 0.
2. The pooled-variance estimator, , requires that the two population variances be equal.
3. If we reject a null hypothesis at the 0.05 level of significance, then we must also reject it at the 0.04
level.
4. A two-tail test of the population proportion produces a test statistic z = –2.12. The p-value of the test is
0.034.
5. When the necessary conditions are met, a two-tail test is being conducted to test the difference
between two population proportions. The two sample proportions are = 0.32 and = 0.38, and
the standard error of the sampling distribution of is 0.046. The calculated value of the test
statistic will be 1.3043.
6. Two samples of size 30 each are independently drawn from two normal populations, where the
unknown population variances are assumed to be equal. The number of degrees of freedom of the
equal-variances t-test statistic is 59.
7. In a one-tail test, the p-value is found to be equal to 0.0456. If the test had been two-tailed, the p-value
would have been 0.0228.
8. If a sample has 20 observations and a 95% confidence estimate for is needed, the appropriate t-score
is 1.729.
9. The number of degrees of freedom associated with the t-test, when the data are gathered from a
matched pairs experiment with 8 pairs, is 14.
10. If a sample has 25 observations and a 99% confidence estimate for is needed, the appropriate t-score
is 2.797.
11. When the necessary conditions are met, a two-tail test is being conducted to test the difference
between two population proportions. If the value of the test statistic z is 1.53, then the p-value is 0.126.
12. Both the equal-variances and unequal-variances t-test statistics of require that the two
populations be Student t-distributed.
13. If a sample has 300 observations and a 97.5% confidence estimate for p is needed, the appropriate z–
score is 2.24.
14. If a null hypothesis about the population proportion p is rejected at the 0.05 level of significance, it
must be rejected at the 0.10 level.
15. When the necessary conditions are met, a two-tail test is being conducted at = 0.025 to test
H0: = 1. The two sample variances are = 375 and = 625, and the sample sizes are
n1 = 36 and n2 = 36. The calculated value of the test statistic will be F = 0.60.
16. If a sample of size 28 is selected, the value of A for the probability P(–A
tdf=n-1 t
A) = 0.99 is
2.771.
17. If a sample of size 300 is selected, the value of A for the probability P(–A
tdf=n-1
A) = 0.90 is 1.96.
18. We use the F-test to determine whether two population variances are equal.
19. When the necessary conditions are met, a two-tail test is being conducted to test the difference
between two population means, but your statistical software provides only a one-tail area of 0.0327 as
part of its output. The p–value for this test will be 0.0654.
20. The upper limit of the 89.9% confidence interval for the population proportion p, given that n = 80 and
= 0.40, is 0.4898.
21. The lower limit of the 87.4% confidence interval for the population proportion p, given that n = 250 and
= 0.15, is 0.1492.
22. When the necessary conditions are met, a two-tail test is being conducted at = 0.10 to test H0:
= 1. The two sample variances are = 736 and = 1024, and the sample sizes are n1 =
16 and n2 = 25. The rejection region is F > 2.11 or F < 0.4367.
23. If a sample of size 25 is selected, the value of A for the probability P(tdf=n-1
A) = 0.05 is 1.708.
24. If a sample has 12 observations and a 90% confidence estimate for is needed, the appropriate t-score
is 1.363.
25. The equal-variances test statistic of is Student t-distributed with n1 + n2 – 2 degrees of
freedom, provided that the two sample sizes are equal.
SHORT ANSWER
1. One of the important features of a photocopying machine is the clarity of copies. In order to decide
which of two photocopying machines, say Model A and Model B, has better average clarity, a
technician copied a random sample of 25 documents on 25 randomly selected A copiers and another
random sample of 25 documents on 25 randomly selected B copiers (one document was copied by
each copier). The clarity of each copy was measured on a scale of 0 to 100 and the measurements were
recorded in the table below. Suppose that the clarity measurements are normally distributed. A
statistician has determined that the number of openings and closings is normally distributed.
A
B
85
86
96
83
91
87
83
81
92
74
100
94
98
82
90
91
96
96
94
65
82
89
76
86
85
93
80
87
95
80
88
88
92
93
85
77
83
87
97
88
71
75
92
87
85
89
83
94
98
91
Determine whether these data are sufficient to infer at the 5% significance level that the two
population variances differ.
2. One of the important features of a photocopying machine is the clarity of copies. In order to decide
which of two photocopying machines, say Model A and Model B, has better average clarity, a
technician copied a random sample of 25 documents on 25 randomly selected A copiers and another
random sample of 25 documents on 25 randomly selected B copiers (one document was copied by
each copier). The clarity of each copy was measured on a scale of 0 to 100 and the measurements were
recorded in the table below. Suppose that the clarity measurements are normally distributed. A
statistician has determined that the number of openings and closings is normally distributed.
A
B
85
86
96
83
91
87
83
81
92
74
100
94
98
82
90
91
96
96
94
65
82
89
76
86
85
93
80
87
95
80
88
88
92
93
85
77
83
87
97
88

71
75
92
87
85
89
83
94
98
91
Estimate with 95% confidence the ratio of the population variances of clarity between the copies made
by A and B copiers.
3. One of the important features of a photocopying machine is the clarity of copies. In order to decide
which of two photocopying machines, say Model A and Model B, has better average clarity, a
technician copied a random sample of 25 documents on 25 randomly selected A copiers and another
random sample of 25 documents on 25 randomly selected B copiers (one document was copied by
each copier). The clarity of each copy was measured on a scale of 0 to 100 and the measurements were
recorded in the table below. Suppose that the clarity measurements are normally distributed. A
statistician has determined that the number of openings and closings is normally distributed.
A
B
85
86
96
83
91
87
83
81
92
74
100
94
98
82
90
91
96
96
94
65
82
89
76
86
85
93
80
87
95
80
88
88
92
93
85
77
83
87
97
88
71
75
92
87
85
89
83
94
98
91
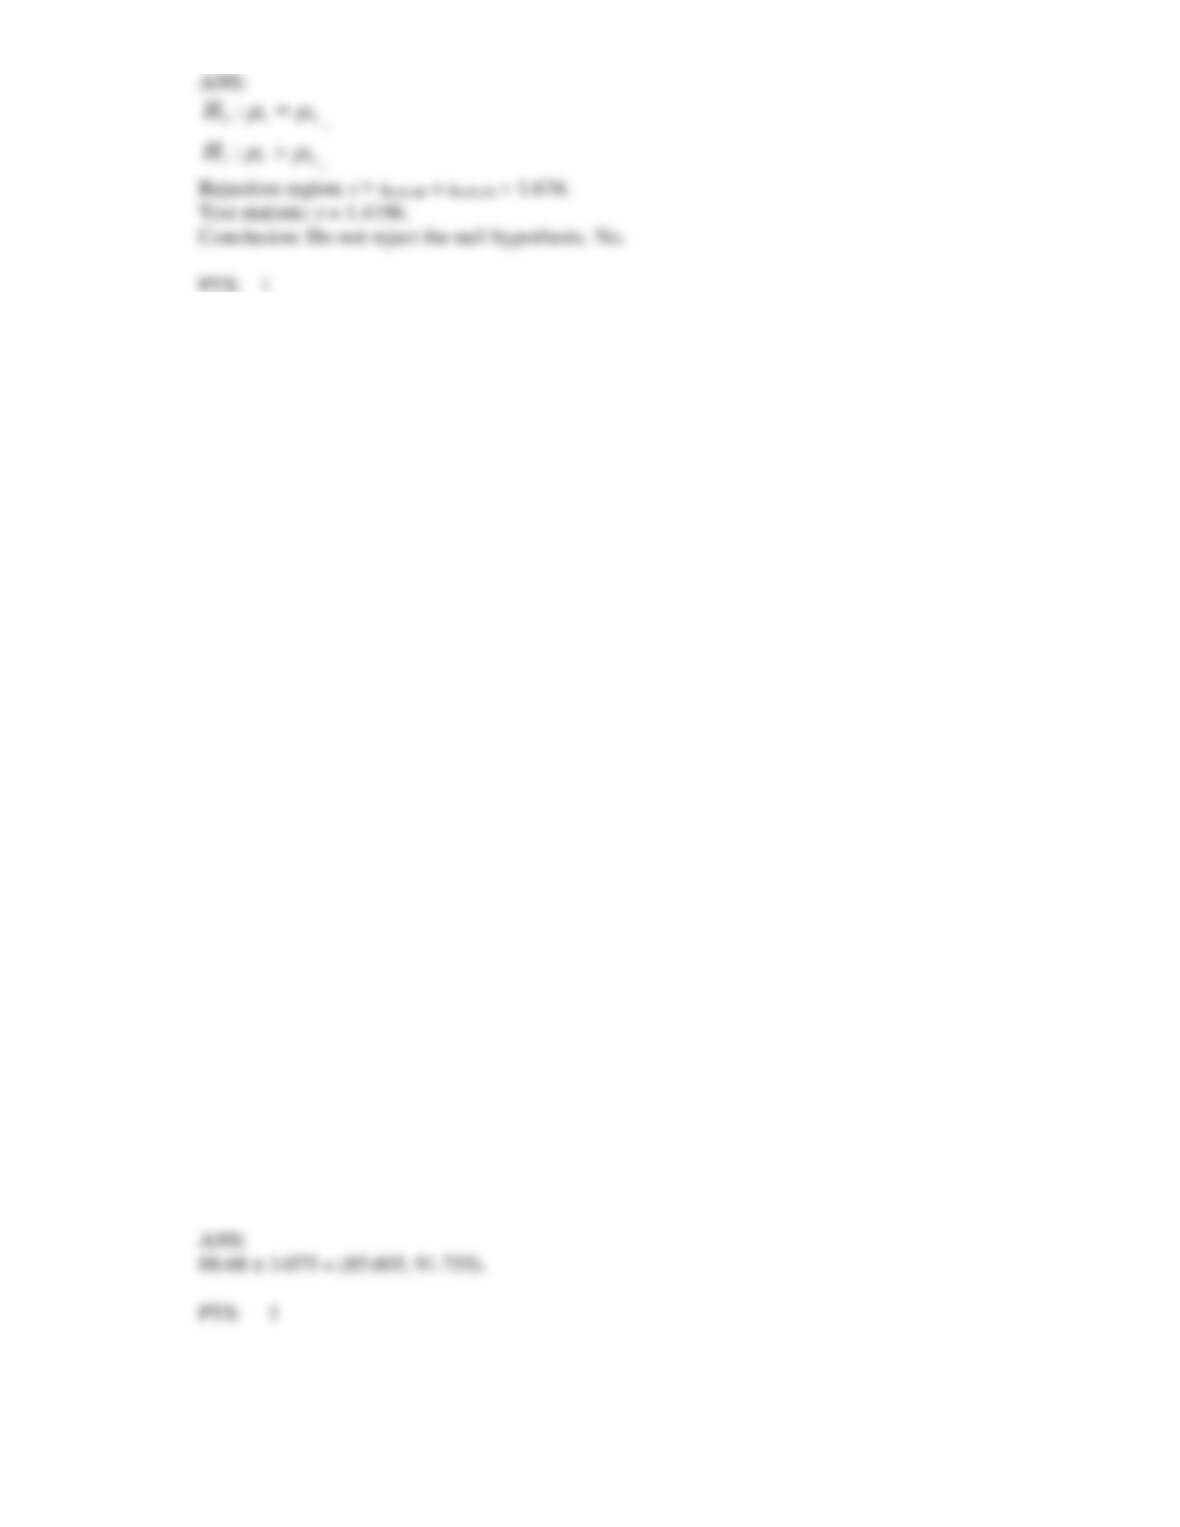
Can we conclude at the 5% significance level that A copiers produce higher clarity copies than B
copiers?
4. One of the important features of a photocopying machine is the clarity of copies. In order to decide
which of two photocopying machines, say Model A and Model B, has better average clarity, a
technician copied a random sample of 25 documents on 25 randomly selected A copiers and another
random sample of 25 documents on 25 randomly selected B copiers (one document was copied by
each copier). The clarity of each copy was measured on a scale of 0 to 100 and the measurements were
recorded in the table below. Suppose that the clarity measurements are normally distributed. A
statistician has determined that the number of openings and closings is normally distributed.
A
B
85
86
96
83
91
87
83
81
92
74
100
94
98
82
90
91
96
96
94
65
82
89
76
86
85
93
80
87
95
80
88
88
92
93
85
77
83
87
97
88
71
75
92
87
85
89
83
94
98
91
Estimate with 95% confidence the mean clarity of copies produced by A copiers.

5. One of the important features of a photocopying machine is the clarity of copies. In order to decide
which of two photocopying machines, say Model A and Model B, has better average clarity, a
technician copied a random sample of 25 documents on 25 randomly selected A copiers and another
random sample of 25 documents on 25 randomly selected B copiers (one document was copied by
each copier). The clarity of each copy was measured on a scale of 0 to 100 and the measurements were
recorded in the table below. Suppose that the clarity measurements are normally distributed. A
statistician has determined that the number of openings and closings is normally distributed.
A
B
85
86
96
83
91
87
83
81
92
74
100
94
98
82
90
91
96
96
94
65
82
89
76
86
85
93
80
87
95
80
88
88
92
93
85
77
83
87
97
88
71
75
92
87
85
89
83
94
98
91
Estimate with 95% confidence the difference in the clarity of the copies produced by A and B copiers.
6. One of the important features of a photocopying machine is the clarity of copies. In order to decide
which of two photocopying machines, say Model A and Model B, has better average clarity, a
technician copied a random sample of 25 documents on 25 randomly selected A copiers and another
random sample of 25 documents on 25 randomly selected B copiers (one document was copied by
each copier). The clarity of each copy was measured on a scale of 0 to 100 and the measurements were
recorded in the table below. Suppose that the clarity measurements are normally distributed. A
statistician has determined that the number of openings and closings is normally distributed.
A
B
85
86
96
83
91
87
83
81
92
74
100
94
98
82
90
91
96
96
94
65
82
89
76
86
85
93
80
87
95
80
88
88
92
93
85
77
83
87
97
88
71
75
92
87
85
89
83
94
98
91
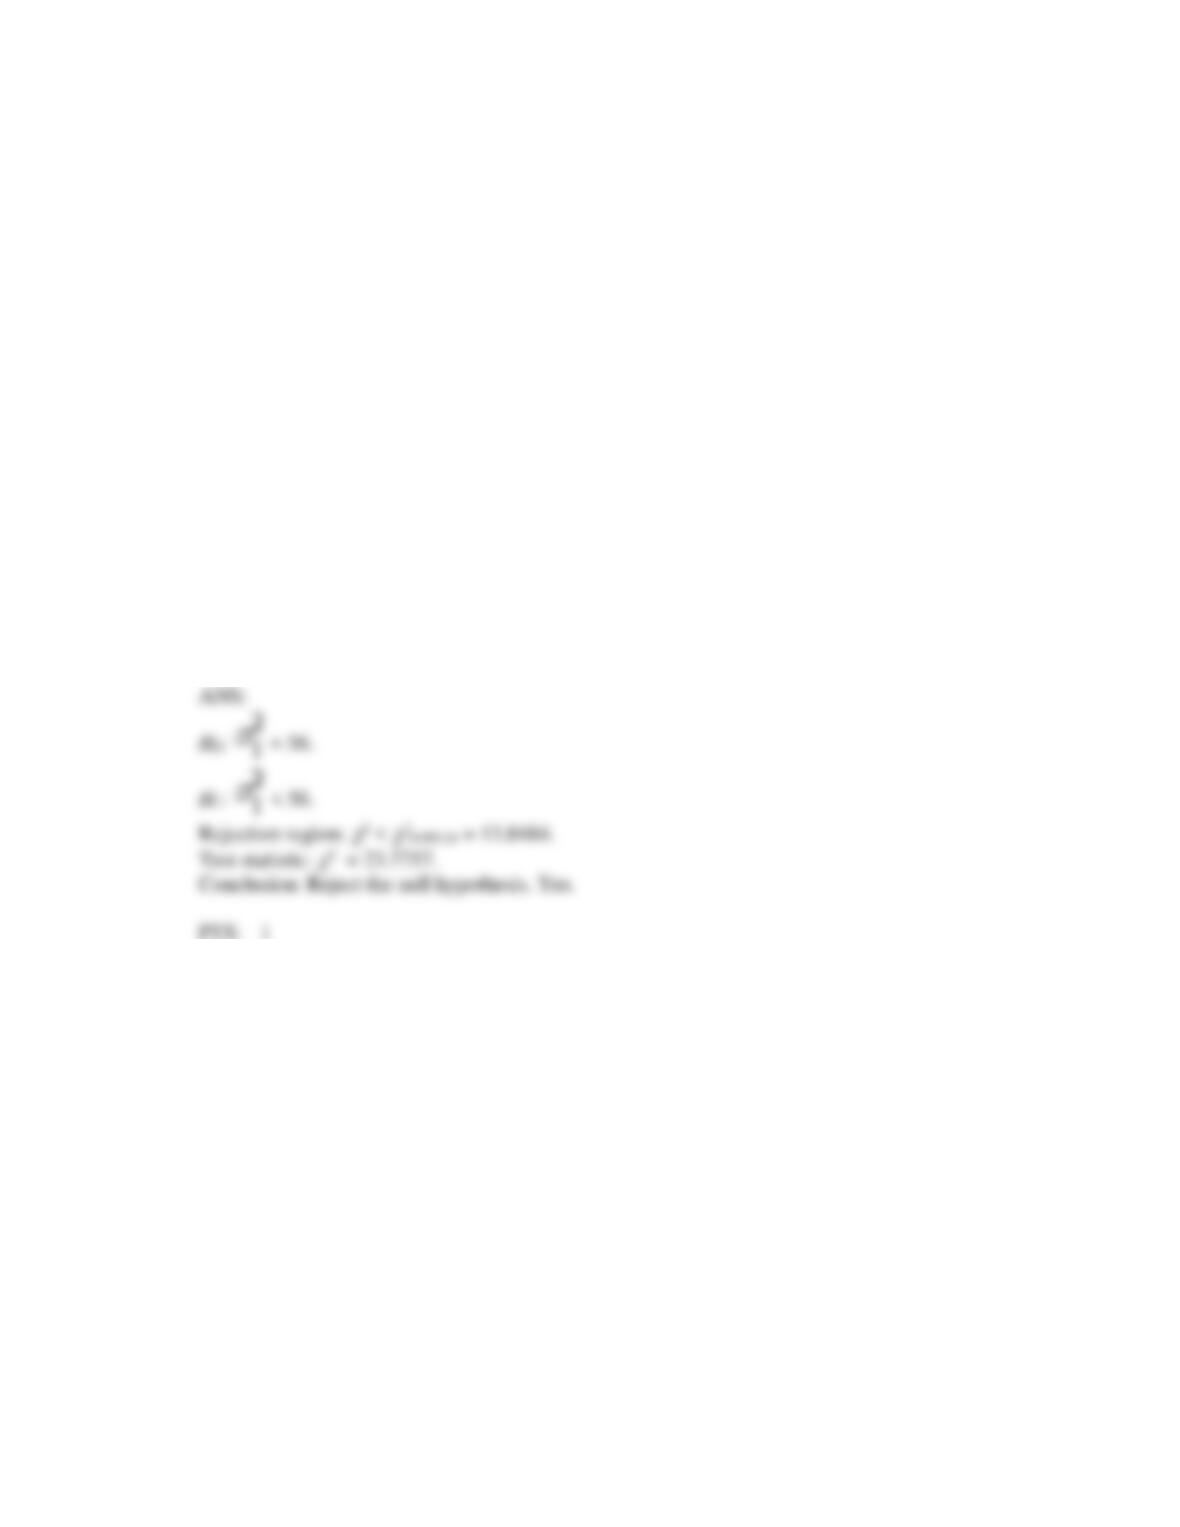
Can we conclude at the 5% significance level that the variance of the clarity of copies produced by A
copiers is less than 56?
7. One of the important features of a photocopying machine is the clarity of copies. In order to decide
which of two photocopying machines, say Model A and Model B, has better average clarity, a
technician copied a random sample of 25 documents on 25 randomly selected A copiers and another
random sample of 25 documents on 25 randomly selected B copiers (one document was copied by
each copier). The clarity of each copy was measured on a scale of 0 to 100 and the measurements were
recorded in the table below. Suppose that the clarity measurements are normally distributed. A
statistician has determined that the number of openings and closings is normally distributed.
A
B
85
86
96
83
91
87
83
81
92
74
100
94
98
82
90
91
96
96
94
65
82
89
76
86
85
93
80
87
95
80
88
88
92
93
85
77
83
87
97
88
71
75
92
87
85
89
83
94
98
91
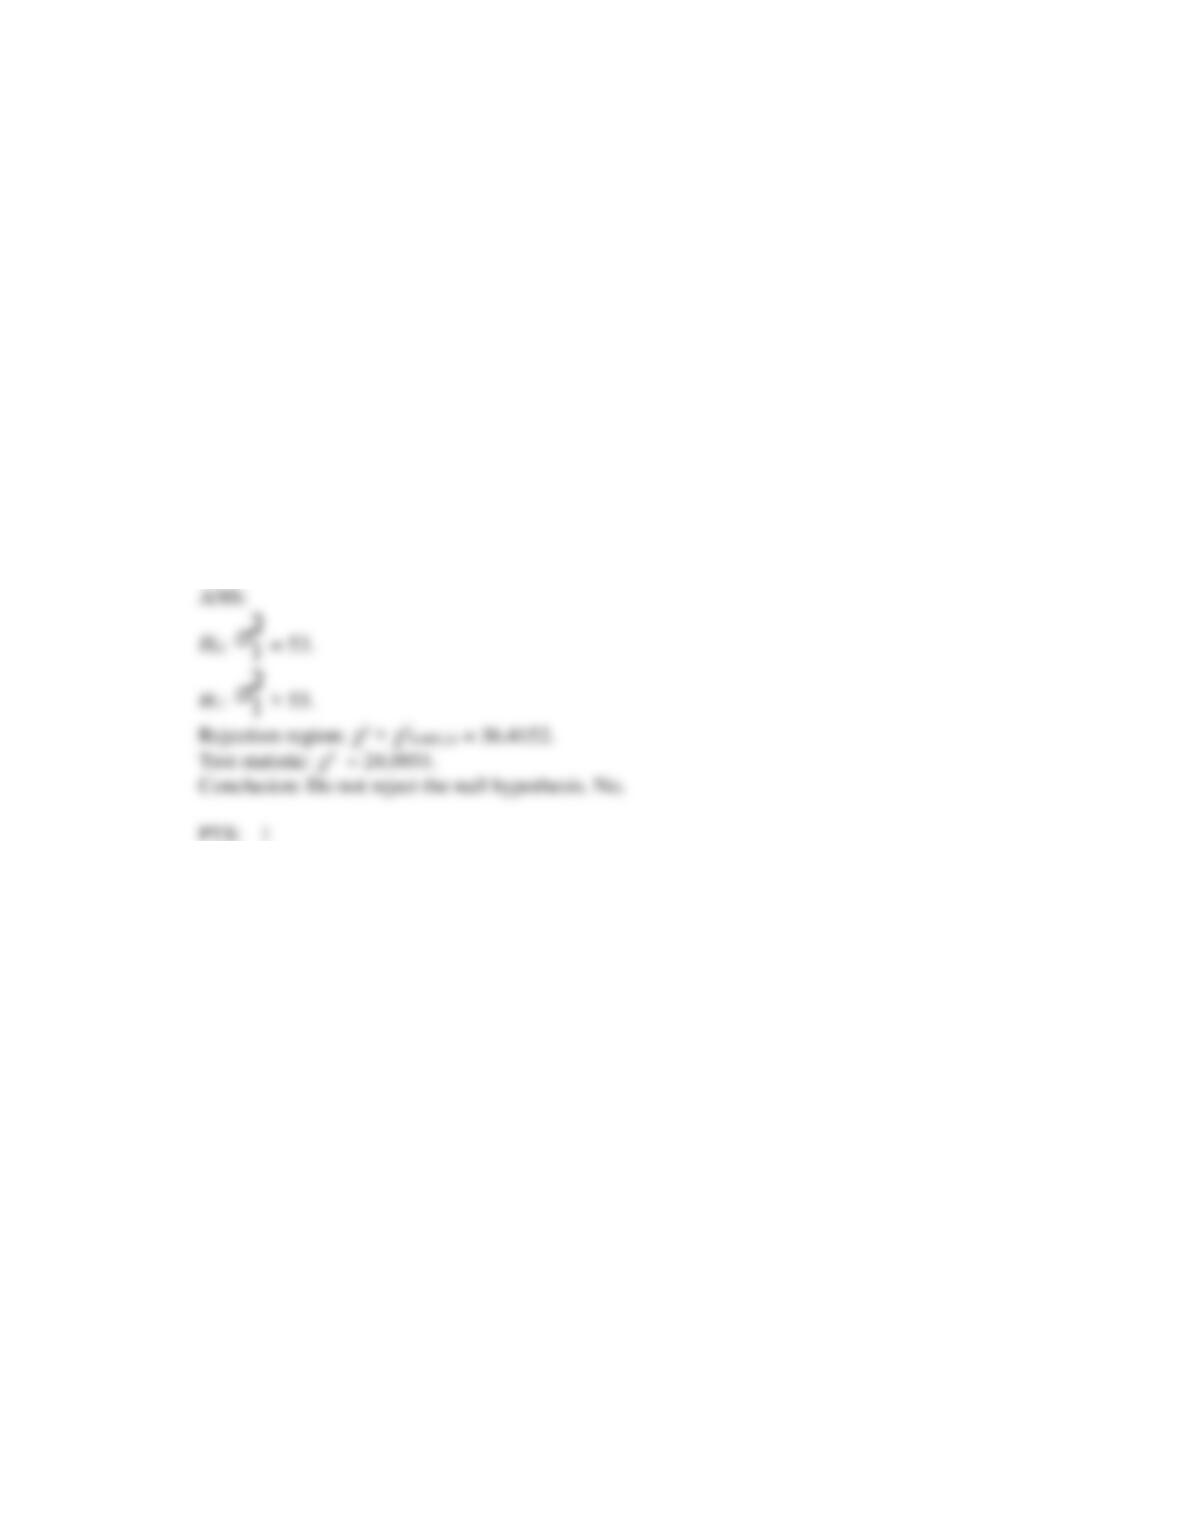
Can we conclude at the 5% significance level that the variance of the clarity of copies produced by B
copiers is more than 53?
8. One of the important features of a photocopying machine is the clarity of copies. In order to decide
which of two photocopying machines, say Model A and Model B, has better average clarity, a
technician copied a random sample of 25 documents on 25 randomly selected A copiers and another
random sample of 25 documents on 25 randomly selected B copiers (one document was copied by
each copier). The clarity of each copy was measured on a scale of 0 to 100 and the measurements were
recorded in the table below. Suppose that the clarity measurements are normally distributed. A
statistician has determined that the number of openings and closings is normally distributed.
A
B
85
86
96
83
91
87
83
81
92
74
100
94
98
82
90
91
96
96
94
65
82
89
76
86

85
93
80
87
95
80
88
88
92
93
85
77
83
87
97
88
71
75
92
87
85
89
83
94
98
91
Estimate with 95% confidence the variance of the clarity of copies produced by B copiers.
9. One of the important features of a photocopying machine is the clarity of copies. In order to decide
which of two photocopying machines, say Model A and Model B, has better average clarity, a
technician copied a random sample of 25 documents on 25 randomly selected A copiers and another
random sample of 25 documents on 25 randomly selected B copiers (one document was copied by
each copier). The clarity of each copy was measured on a scale of 0 to 100 and the measurements were
recorded in the table below. Suppose that the clarity measurements are normally distributed. A
statistician has determined that the number of openings and closings is normally distributed.
A
B
85
86
96
83
91
87
83
81
92
74
100
94
98
82
90
91
96
96
94
65
82
89
76
86
85
93
80
87
95
80
88
88
92
93
85
77
83
87
97
88
71
75
92
87
85
89
83
94
98
91
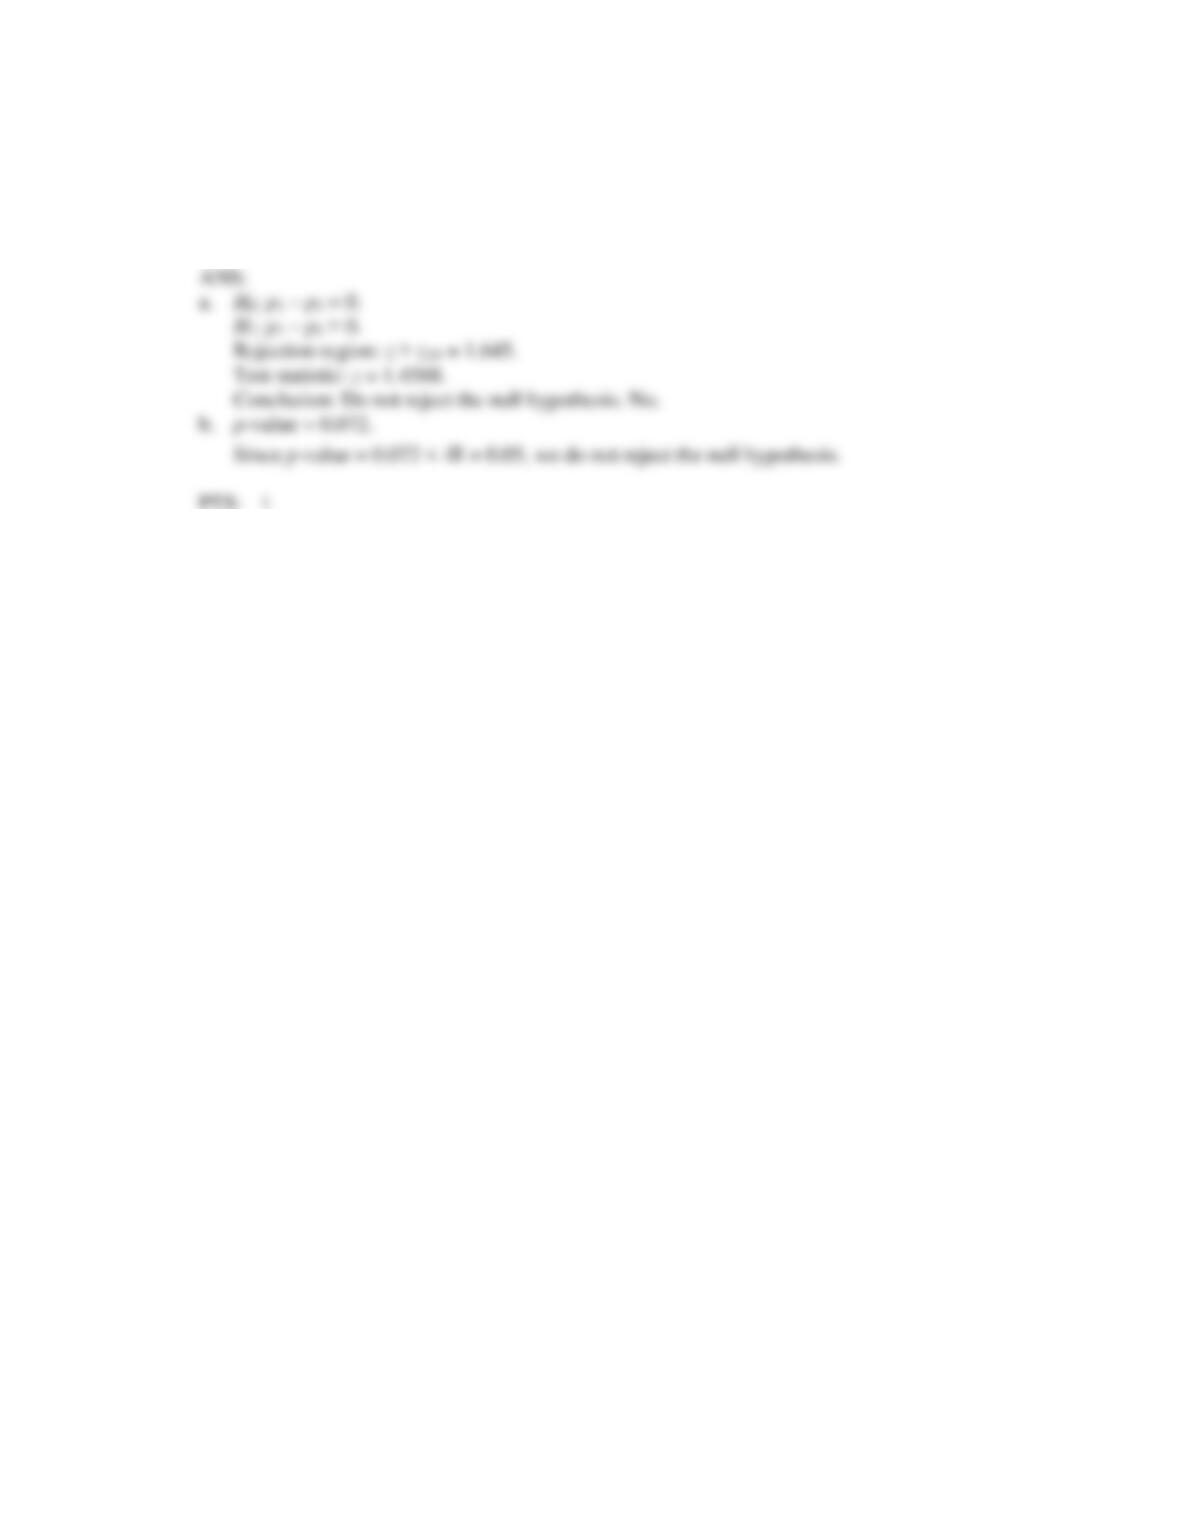
a. Can we conclude at the 5% significance level that, compared to B copiers, A copiers produce a
greater proportion of copies whose clarity is above than 90?
b. Find the p-value of the test, and explain how to use it to test the hypotheses.
10. One of the important features of a photocopying machine is the clarity of copies. In order to decide
which of two photocopying machines, say Model A and Model B, has better average clarity, a
technician copied a random sample of 25 documents on 25 randomly selected A copiers and another
random sample of 25 documents on 25 randomly selected B copiers (one document was copied by
each copier). The clarity of each copy was measured on a scale of 0 to 100 and the measurements were
recorded in the table below. Suppose that the clarity measurements are normally distributed. A
statistician has determined that the number of openings and closings is normally distributed.
A
B
85
86
96
83
91
87
83
81
92
74
100
94
98
82
90
91
96
96
94
65
82
89
76
86
85
93
80
87
95
80
88
88
92
93
85
77
83
87
97
88
71
75
92
87
85
89
83
94
98
91