Year
t
y
1996
130
1997
125
1998
135
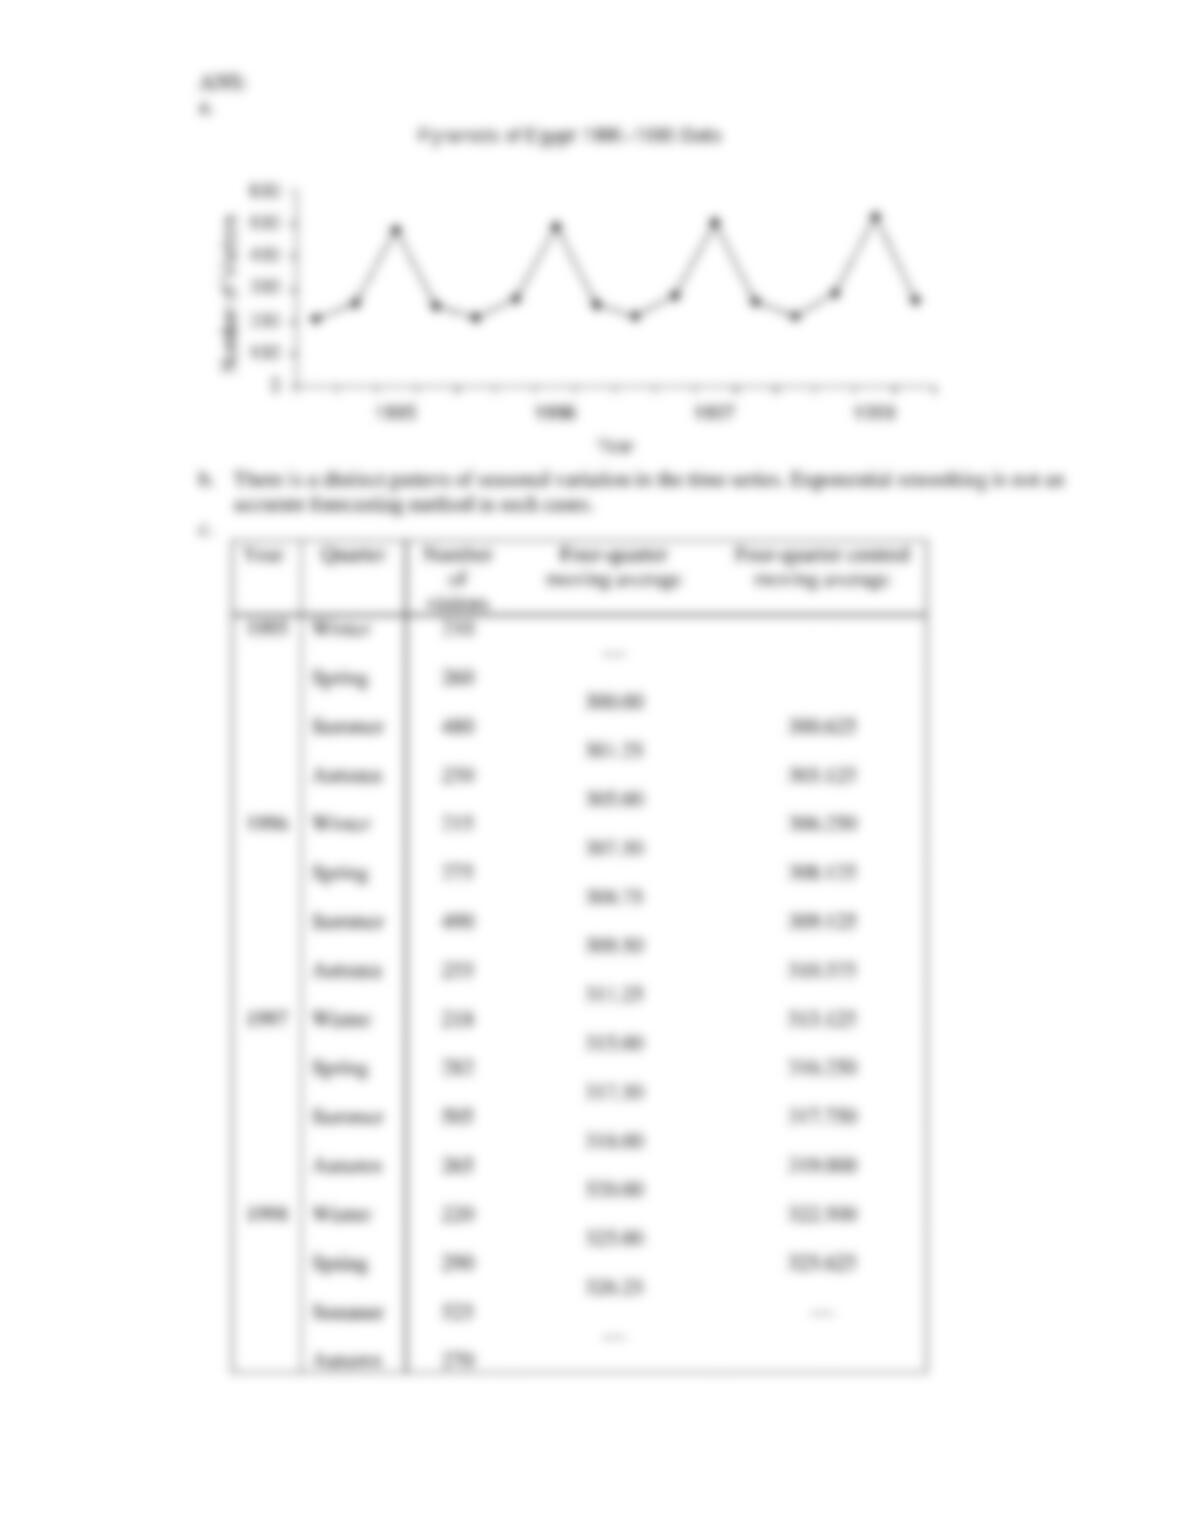
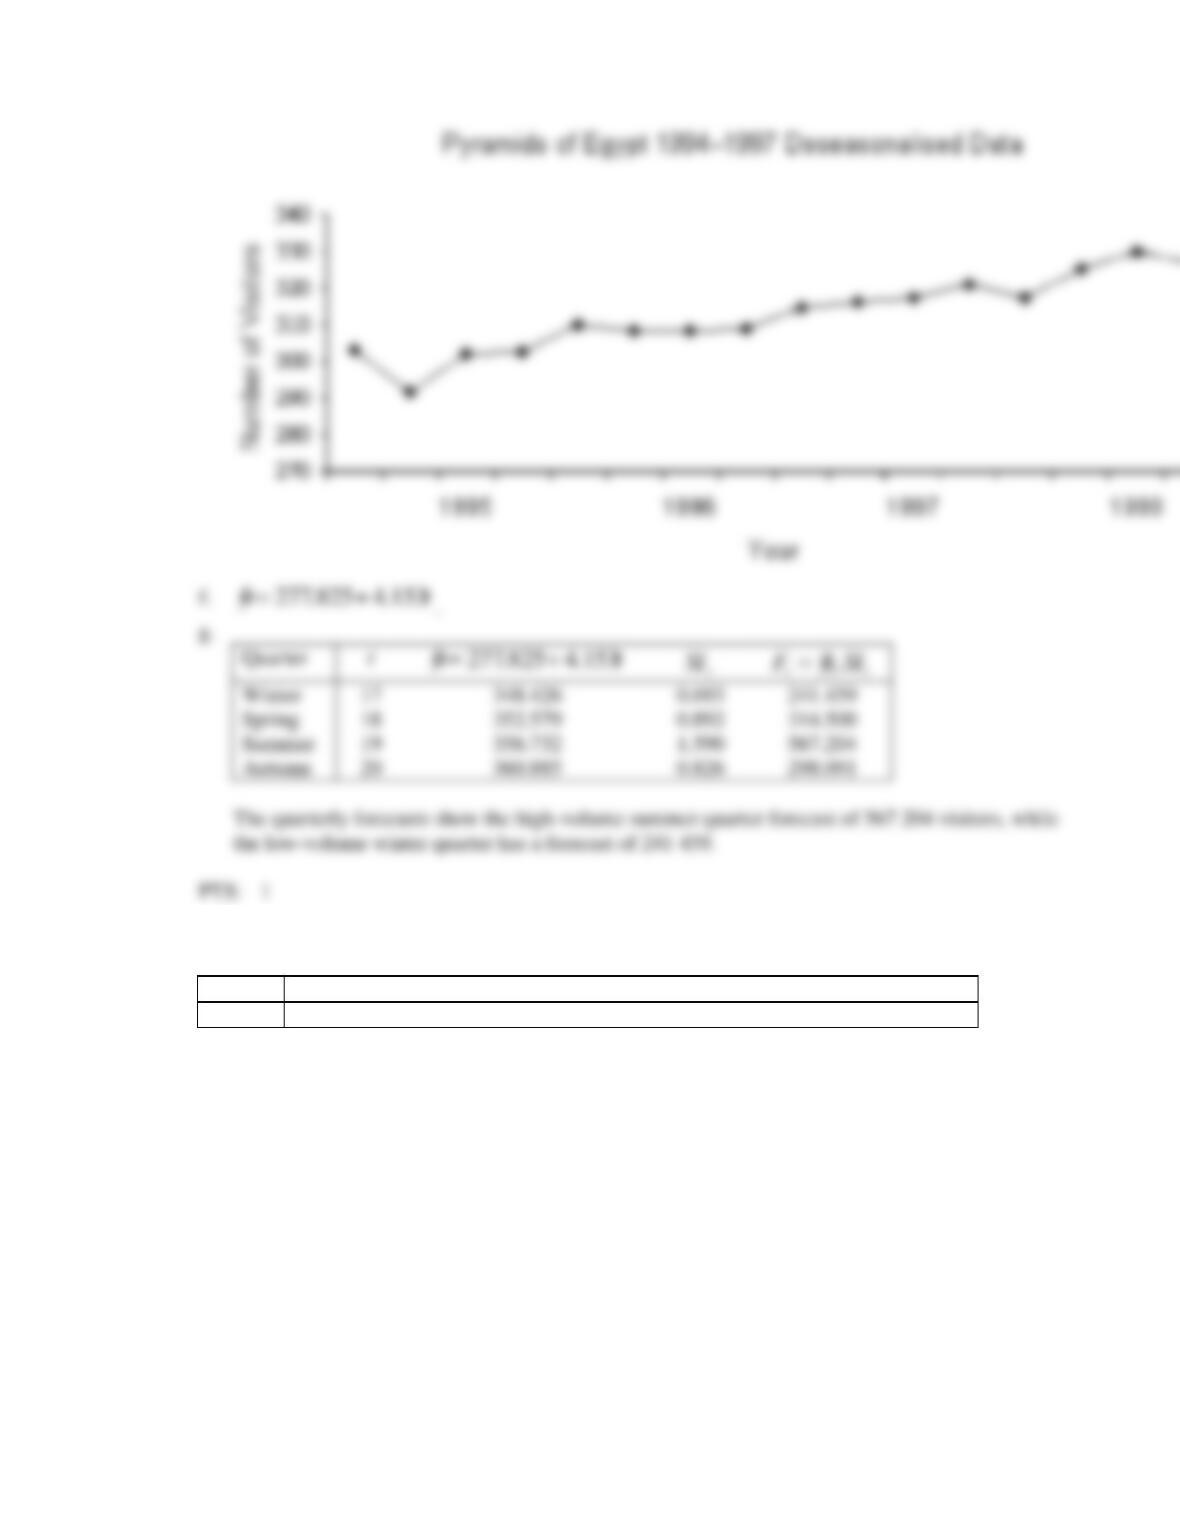
28. The Pyramids of Giza are one of the most visited monuments in Egypt. The number of visitors per
quarter has been recorded (in thousands) as shown in the accompanying table:
Year
Quarter
1995
1996
1997
1998
Winter
210
215
218
220
Spring
260
275
282
290
Summer
480
490
505
525
Autumn
250
255
265
270
a. Plot the time series.
b. Discuss why exponential smoothing is not recommended as a forecasting method in this case.
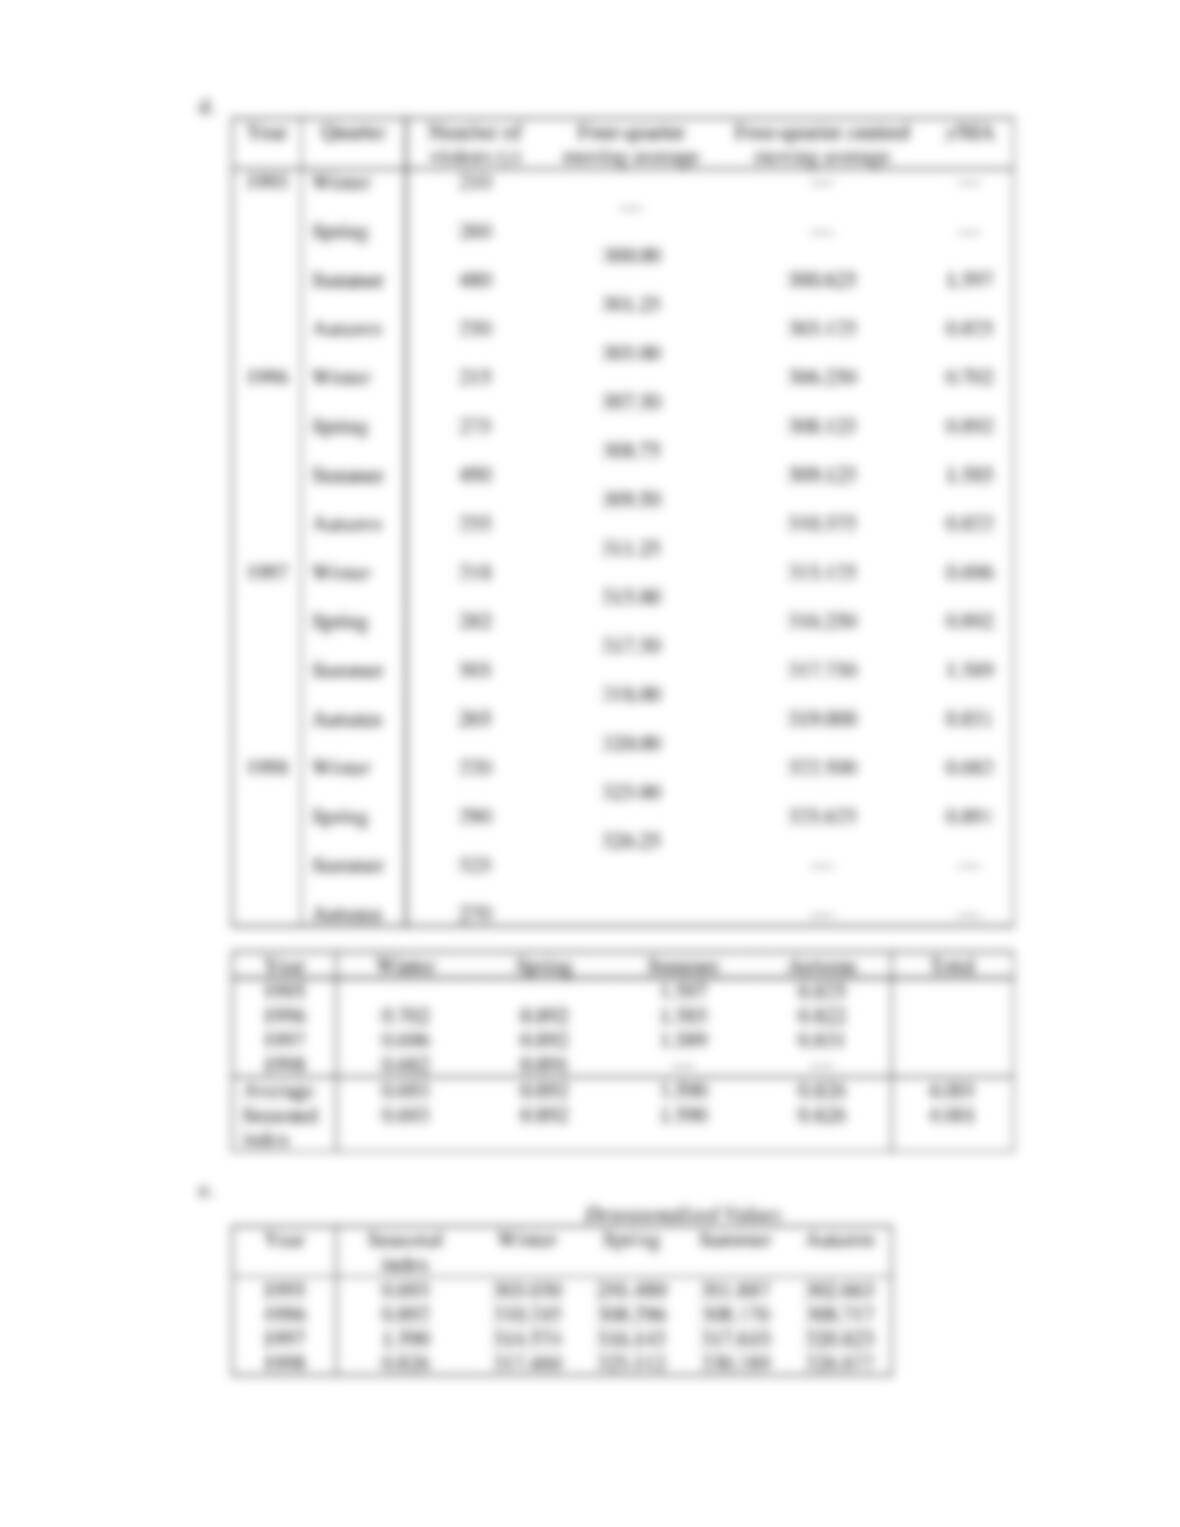
c. Calculate the four-quarter centred moving averages.
d. Use the moving averages computed in (c) to calculate the seasonal (quarterly) indexes.
e. Use the seasonal indexes computed in (d) to deseasonalise the original time-series data, and plot
the deseasonalised time series.
f. Use regression analysis to develop the trend line.
g. Use the seasonal indexes calculated in (d) and the linear trend calculated in (f) to forecast the
number of visitors in the next four quarters and describe the seasonal fluctuations in the number of
visitors.
t
y
1990
125
1991
115
1992
120
1993
126
1994
140
1995
122
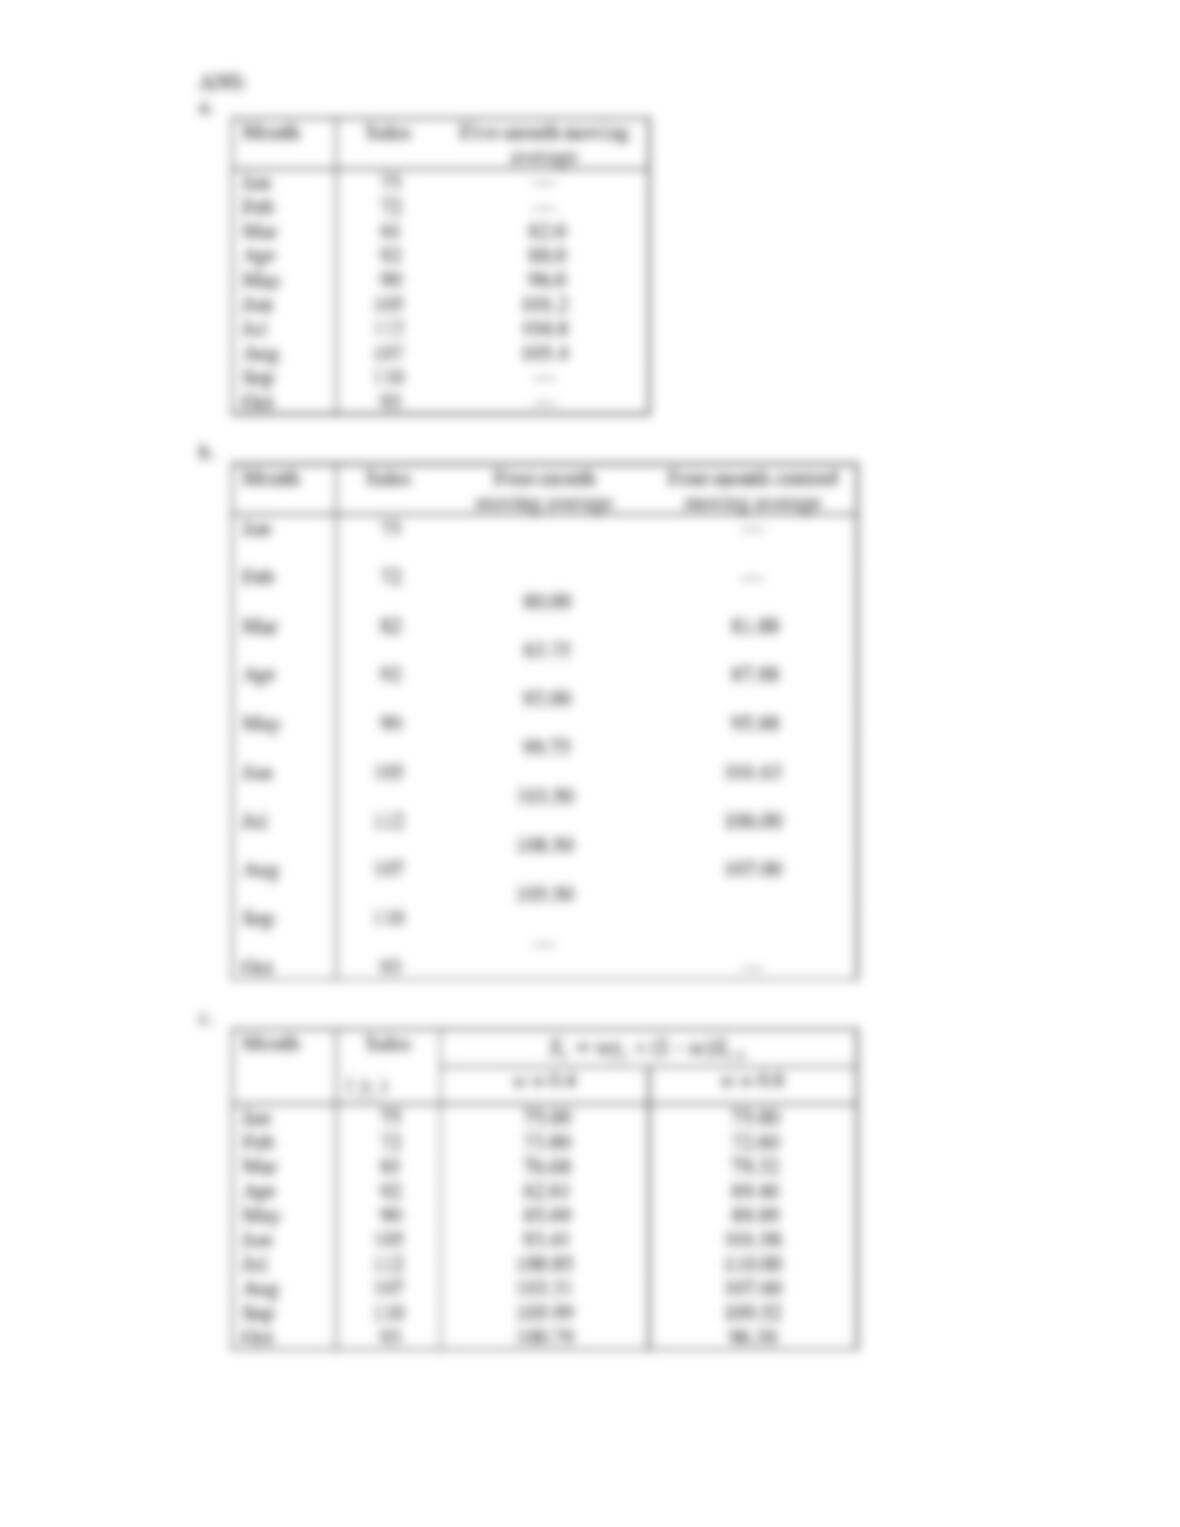
29. Petrol sales in Newcastle have been recorded over the past 10 months as shown below.
Month
Jan
Feb
Mar
Apr
May
Jun
Jul
Aug
Sep
Oct
Sales
75
72
81
92
90
105
112
107
110
93
a. Compute the five-month moving average.
b. Calculate the four-month moving average, and four-month centred moving average.
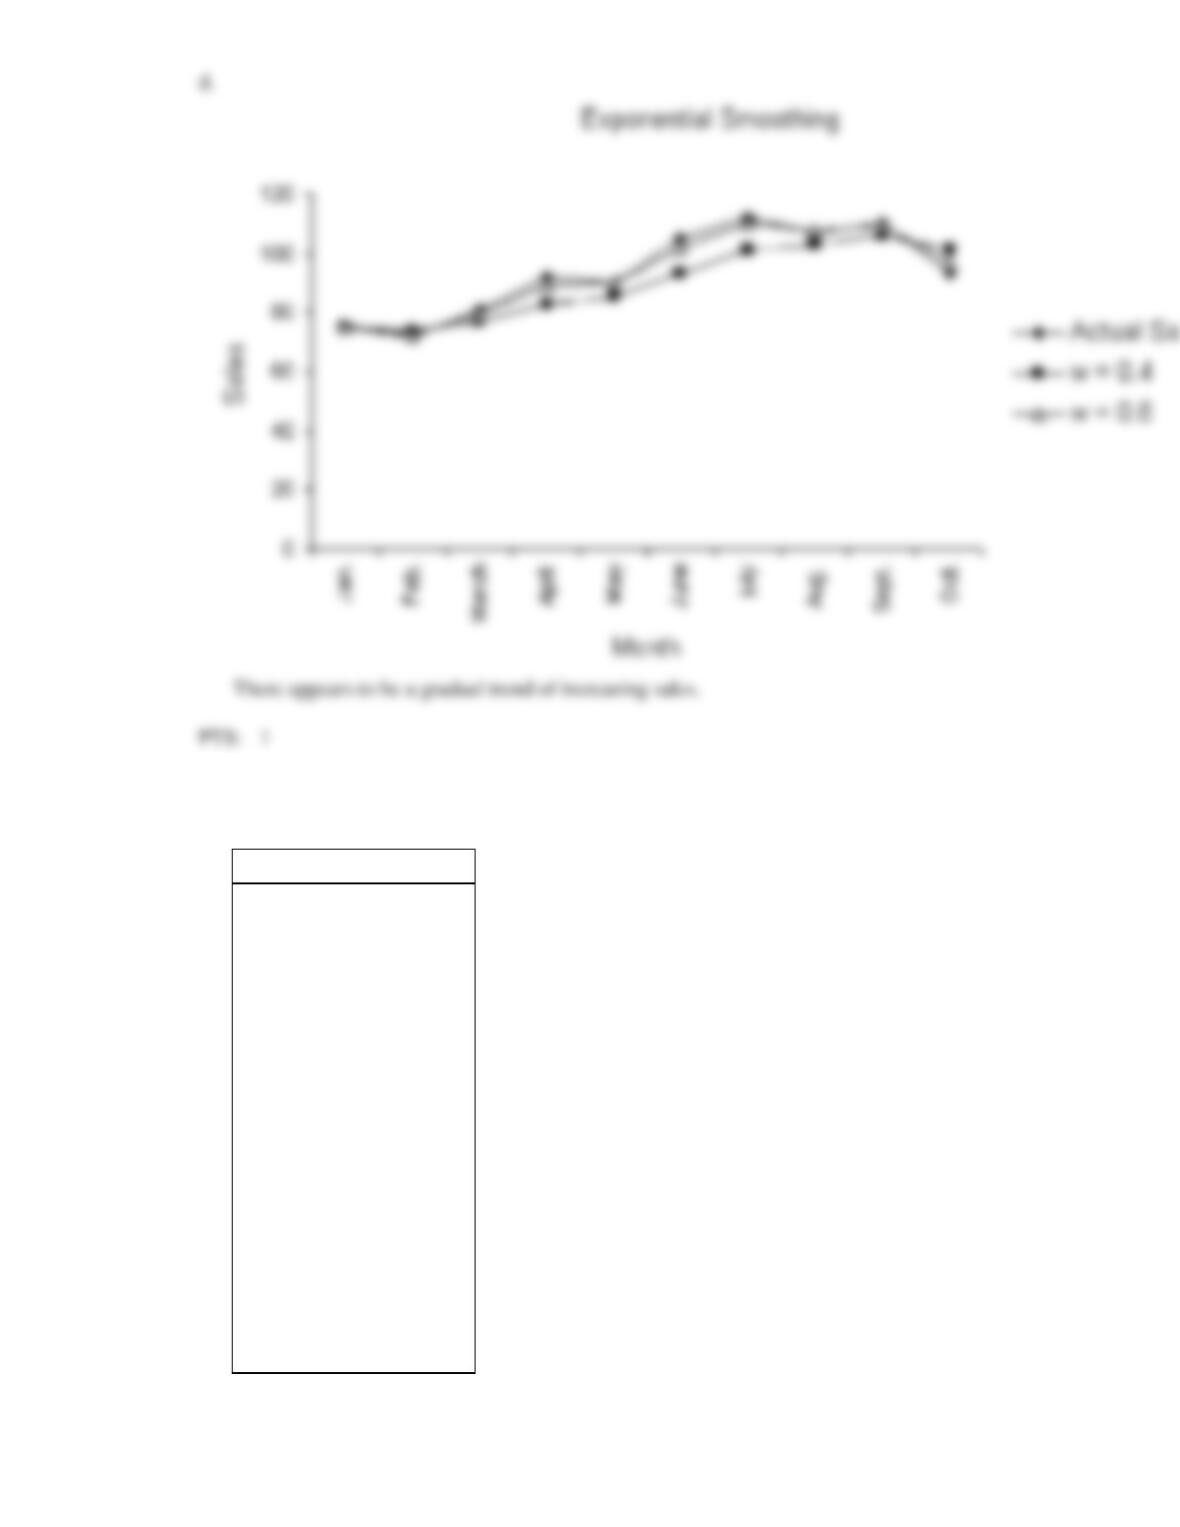
c. Compute the exponentially smoothed sales with w = 0.4 and w = 0.8.
d. Draw the time series and the two sets of exponentially smoothed values. Does there appear to be a
trend component in the time series?
Winter
17
Spring
Summer
19
Autumn
30. a. The seasonally adjusted US quarterly Industrial Production Index from the first quarter of 2001 to
the fourth quarter of 2005 (yt, 2002 = 100) is shown in the table below. Would the linear or
quadratic model fit better?
Time period
yt
Mar-01
136.7
Jun-01
124.1
Sep-01
120.5
Dec-01
117.4
Mar-02
101.1
Jun-02
102.5
Sep-02
98.5
Dec-02
97.9
Mar-03
94.0
Jun-03
86.7
Sep-03
89.8
Dec-03
92.3
Mar-04
95.9
Jun-04
89.6
Sep-04
86.3
Dec-04
84.5
Mar-05
88.7
Jun-05
109.9
Sep-05
100.9
Dec-05
108.4
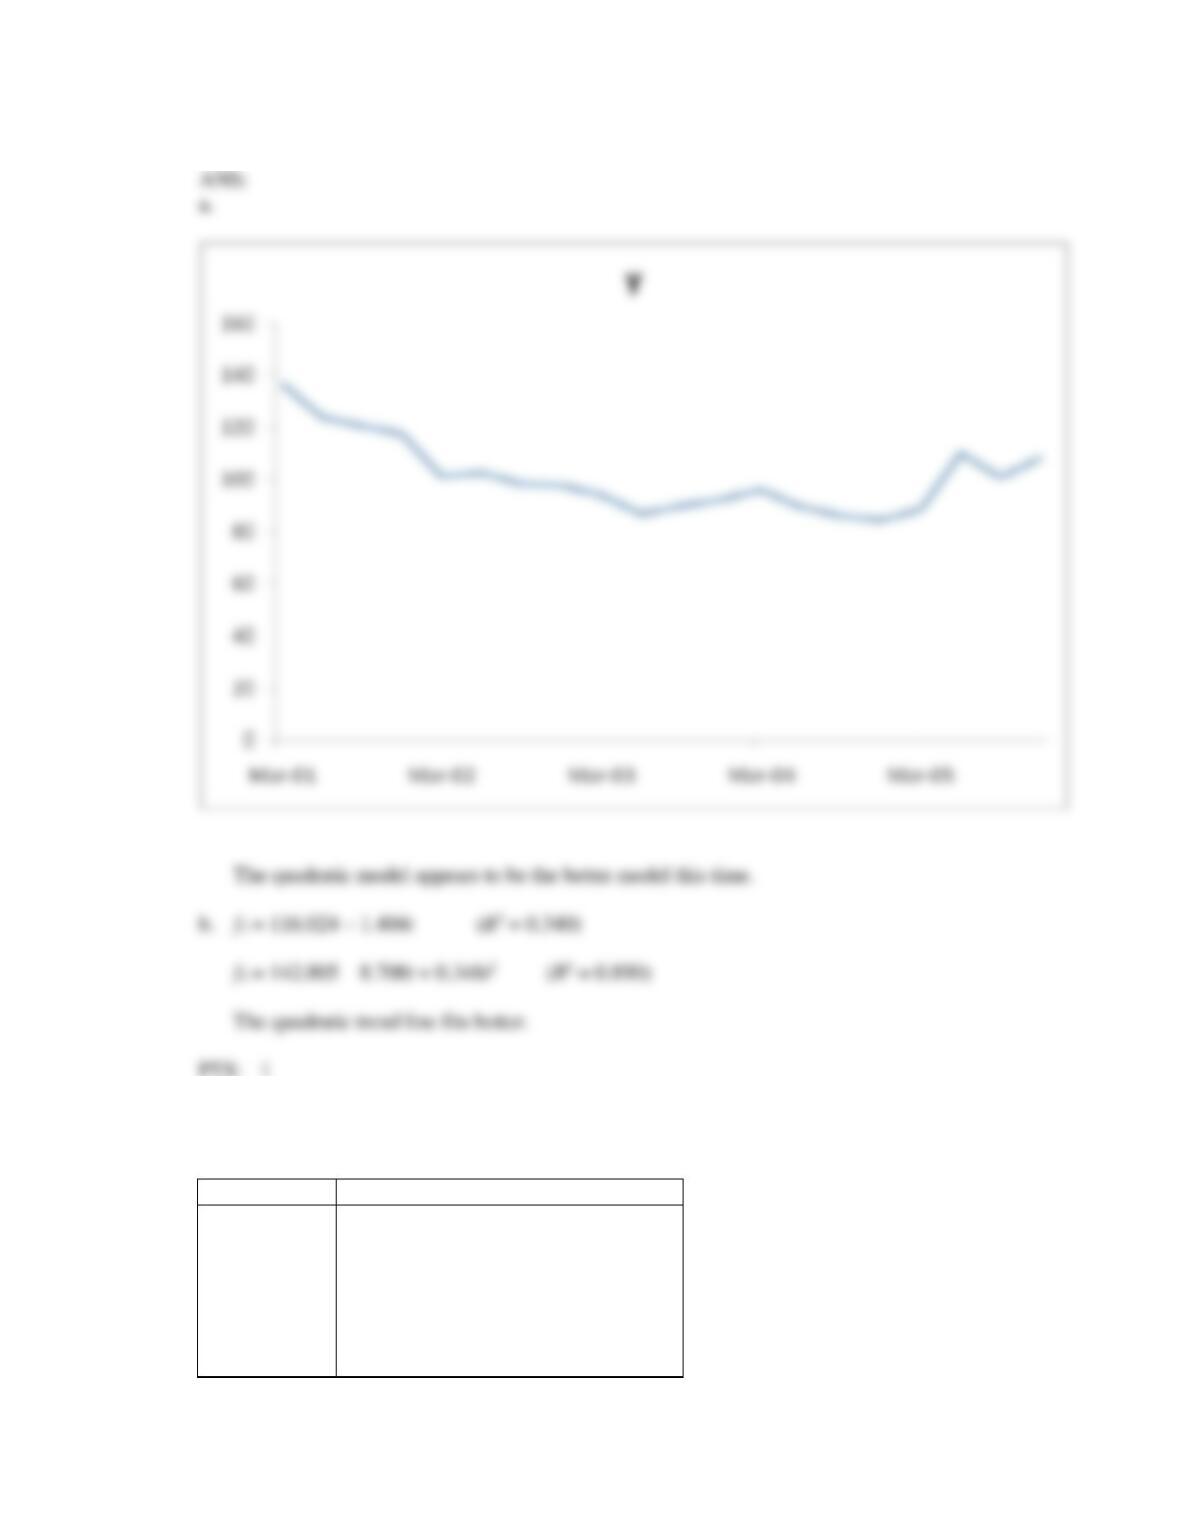
b. Use Excel and the regression technique to calculate the linear trend line and the quadratic trend
line. Which model fits better?
31. The table below shows the number of pizzas sold daily during a four-week period at King Pizza in
Melbourne.
Week
Day
1
2
3
4
Sunday
253
234
248
232
Monday
98
93
99
104
Tuesday
106
88
87
115
Wednesday
119
134
113
102
Thursday
138
123
130
118
Friday
201
215
218
205
Saturday
327
399
415
390
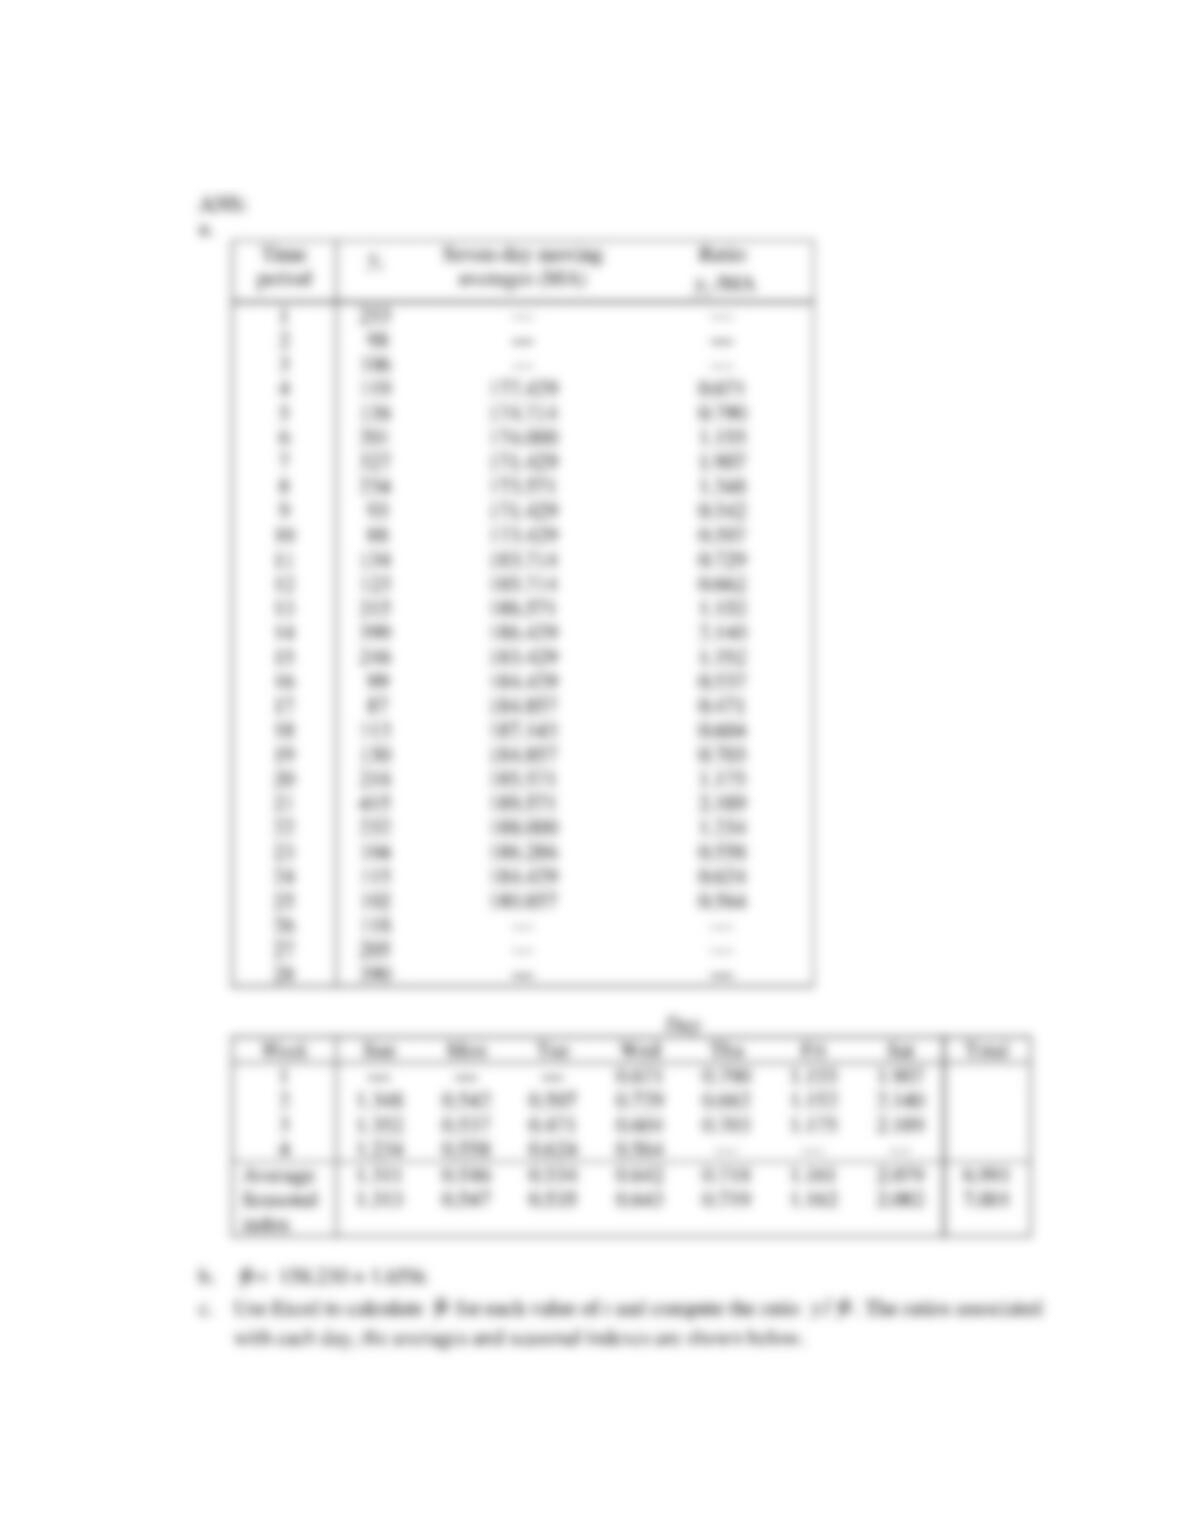
a. Calculate the seasonal (daily) indexes, using a seven-day moving average.
b. Use regression analysis to find the linear trend line.
c. Calculate the seasonal (daily) indexes, using the trend line developed in (b).
32. A time series is shown in the table below:
Period t
1
40
2
45
3
44
4
47
5
48
6
50
7
52
8
51
9
48
10
47
a. Apply exponential smoothing with w = 0.1 and w = 0.8 to help detect the components of the time
series.
b. Draw the time series and the two sets of exponentially smoothed values. Does there appear to be a
trend component in the time series?
1
40
2
3
44
4
5
48
6
50
7
8
51
9
10
47
1
2
3
4
33. A time series is shown in the table below:
Time period
t
y
1
48
2
50
3
46
4
42
5
40
6
32
7
34
8
26
9
21
10
13
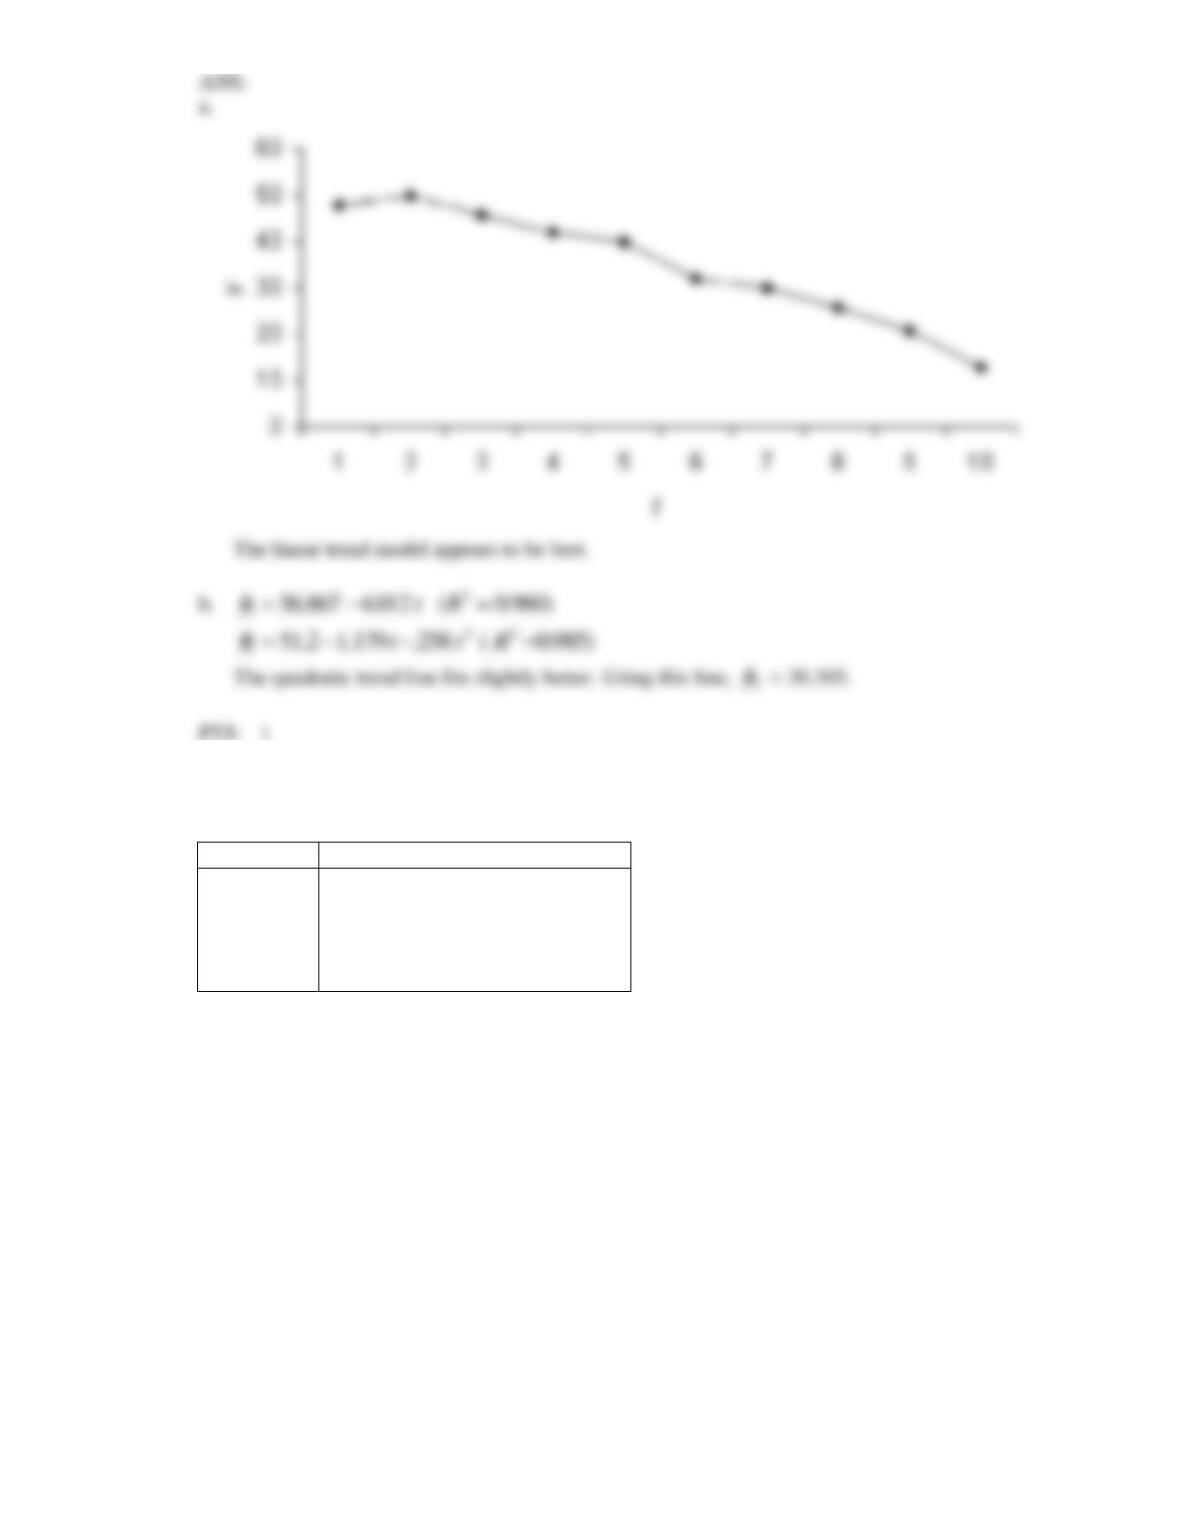
a. Plot the time series to determine which of the trend models appears to fit better.
b. Use the regression technique to calculate the linear trend line and the quadratic trend line. Which
line fits better? Use the best model to forecast the value of y for time period 7.
34. A time series is shown in the table below:
Week
Day
1
2
3
4
Monday
16
15
18
21
Tuesday
22
21
20
25
Wednesday
20
23
20
24
Thursday
29
28
32
28
Friday
35
31
29
36
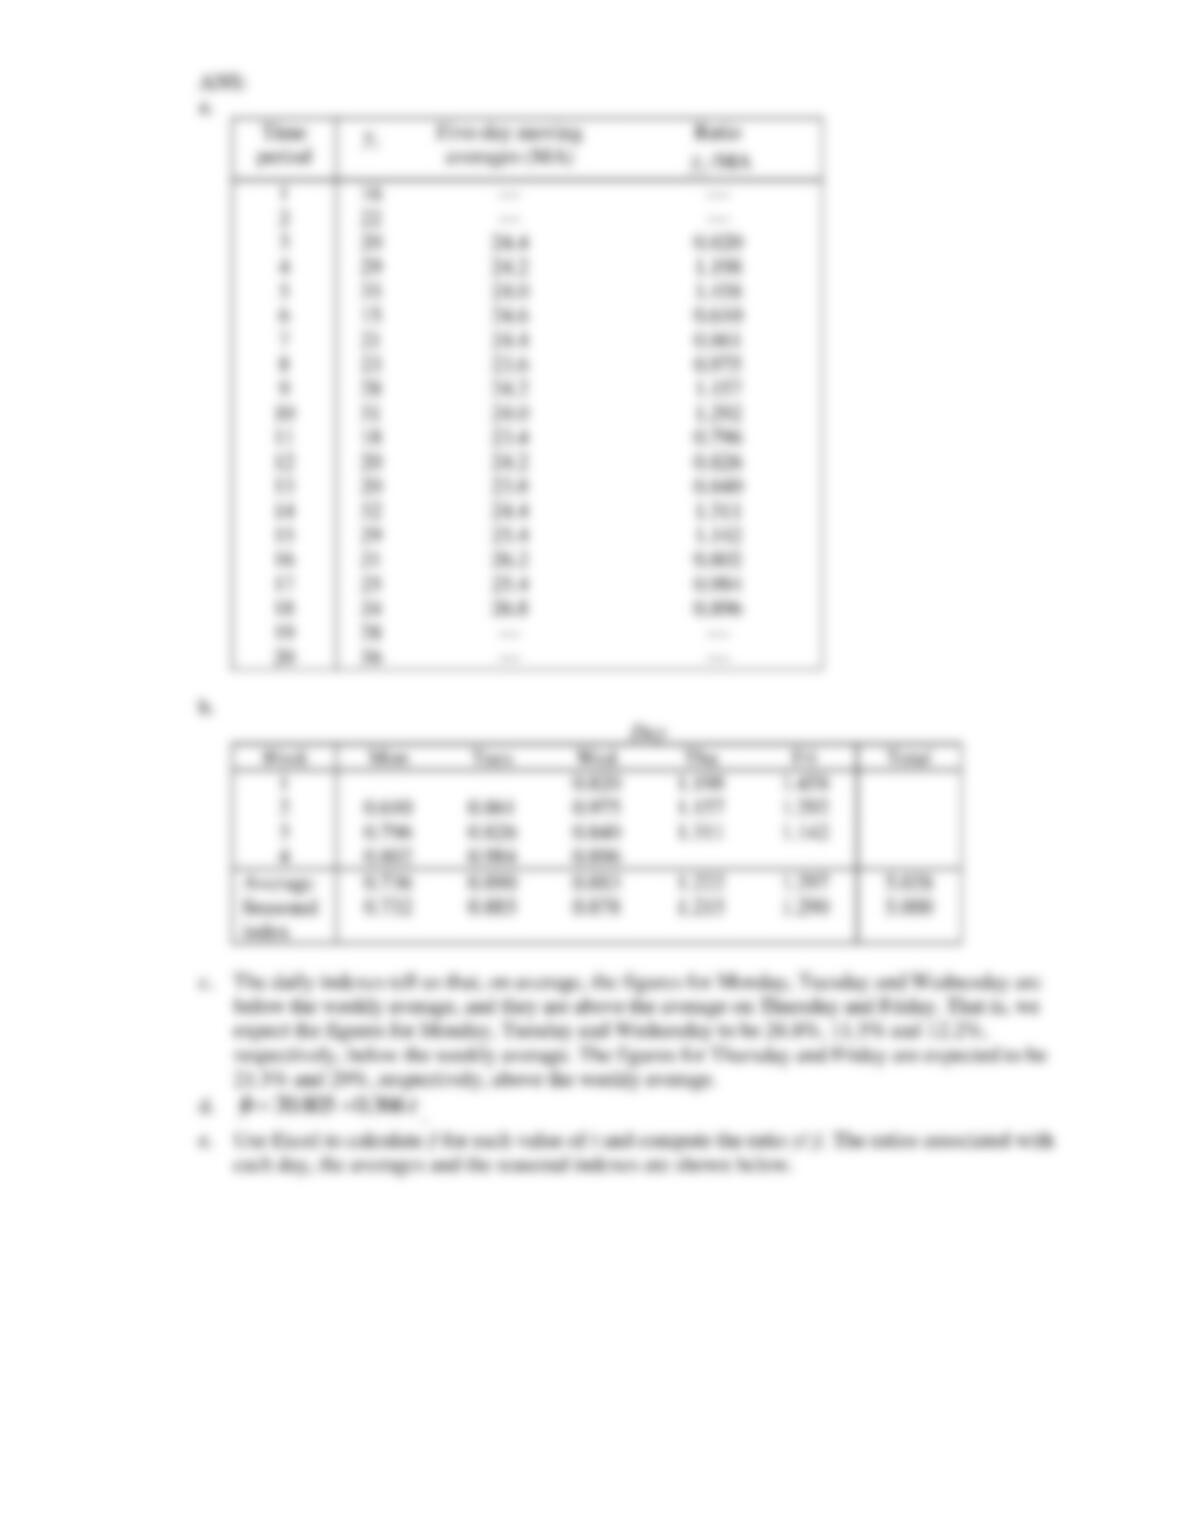
a. Compute the five-day moving averages to remove the seasonal and random variation.
b. Calculate the seasonal (daily) indexes.
c. What do the daily indexes tell us?
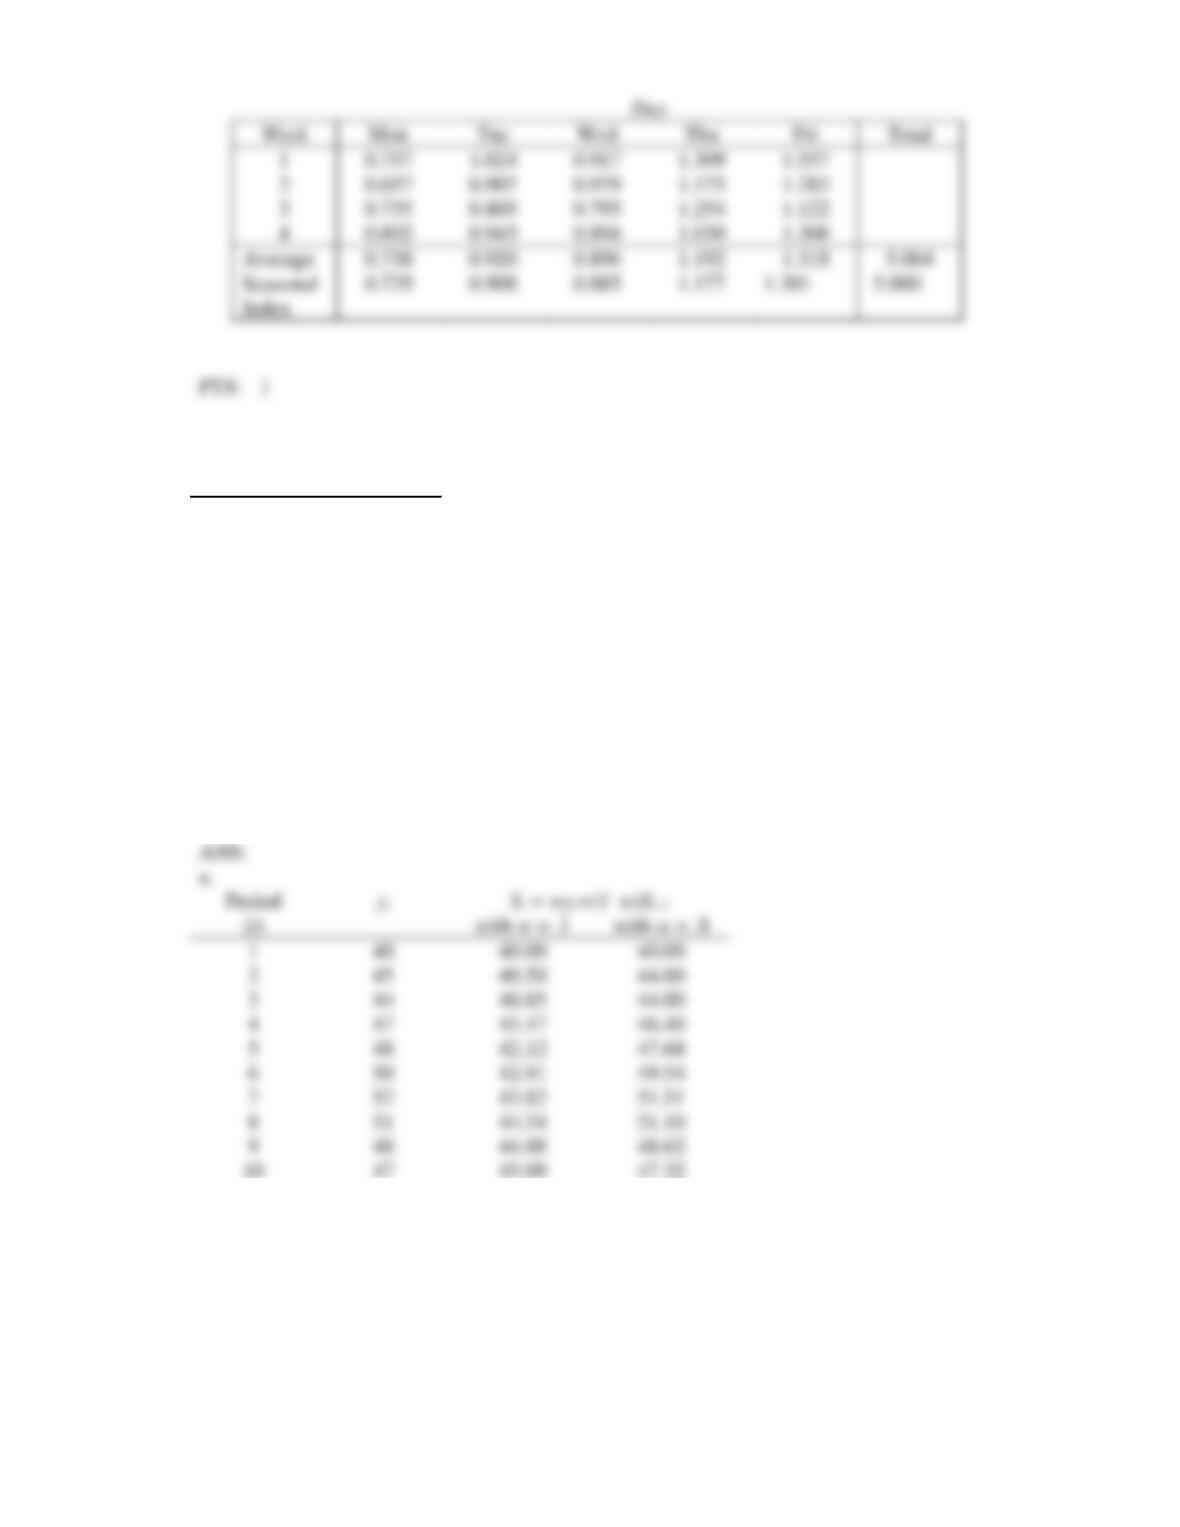
d. Find the regression trend line.
e. Calculate the seasonal indexes, based on the regression trend line developed in (d).
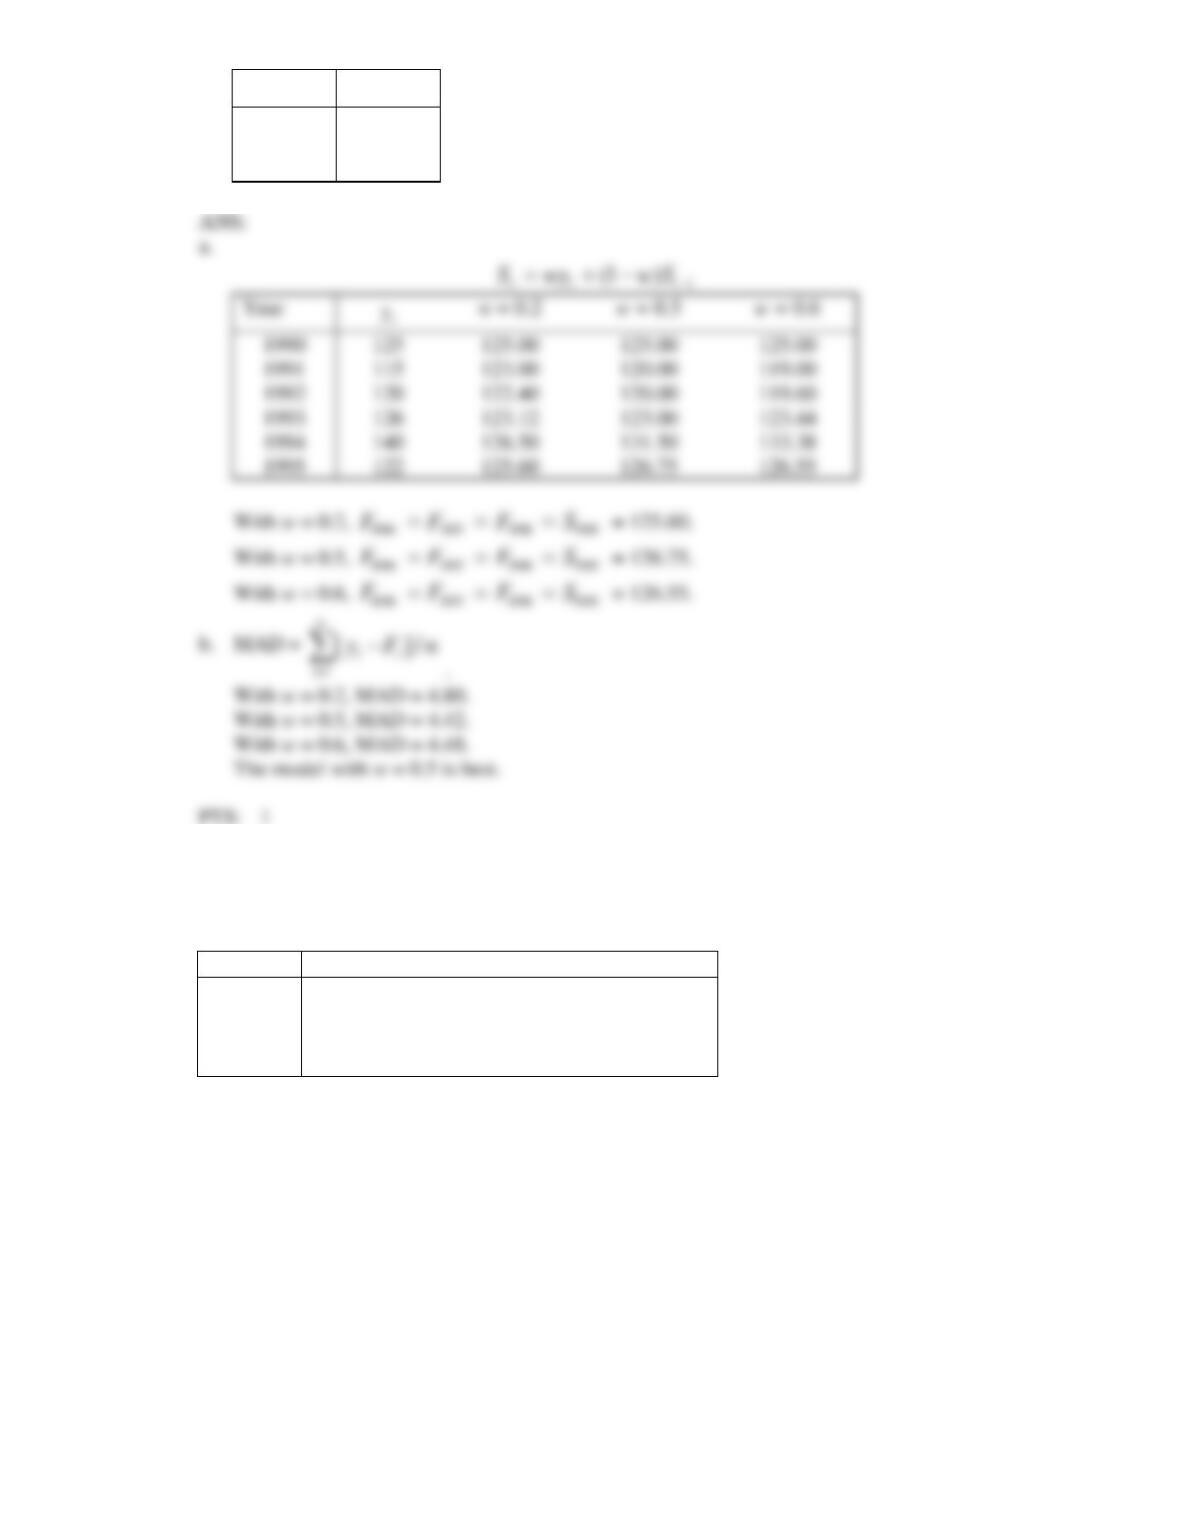
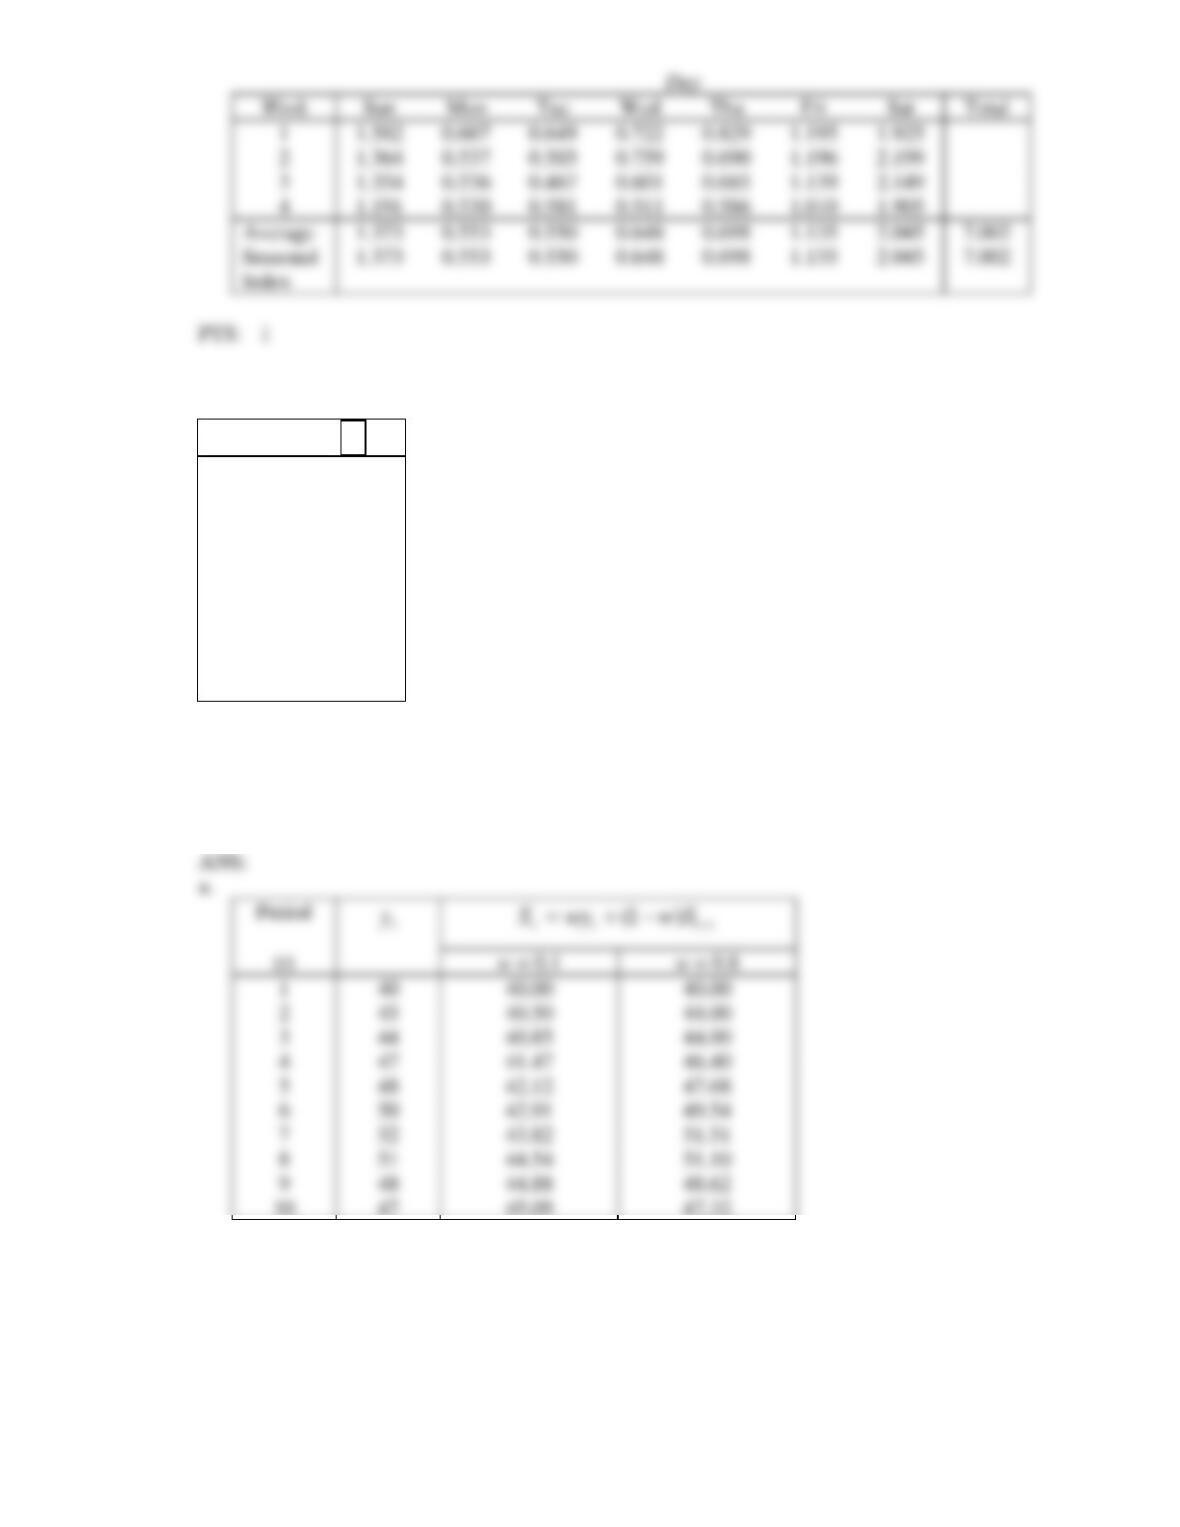
35. a. Apply exponential smoothing with w = 0.1 and w = 0.8 to help detect the components of the
following time series.
Period t
yt
1
40
2
45
3
44
4
47
5
48
6
50
7
52
8
51
9
48
10
47
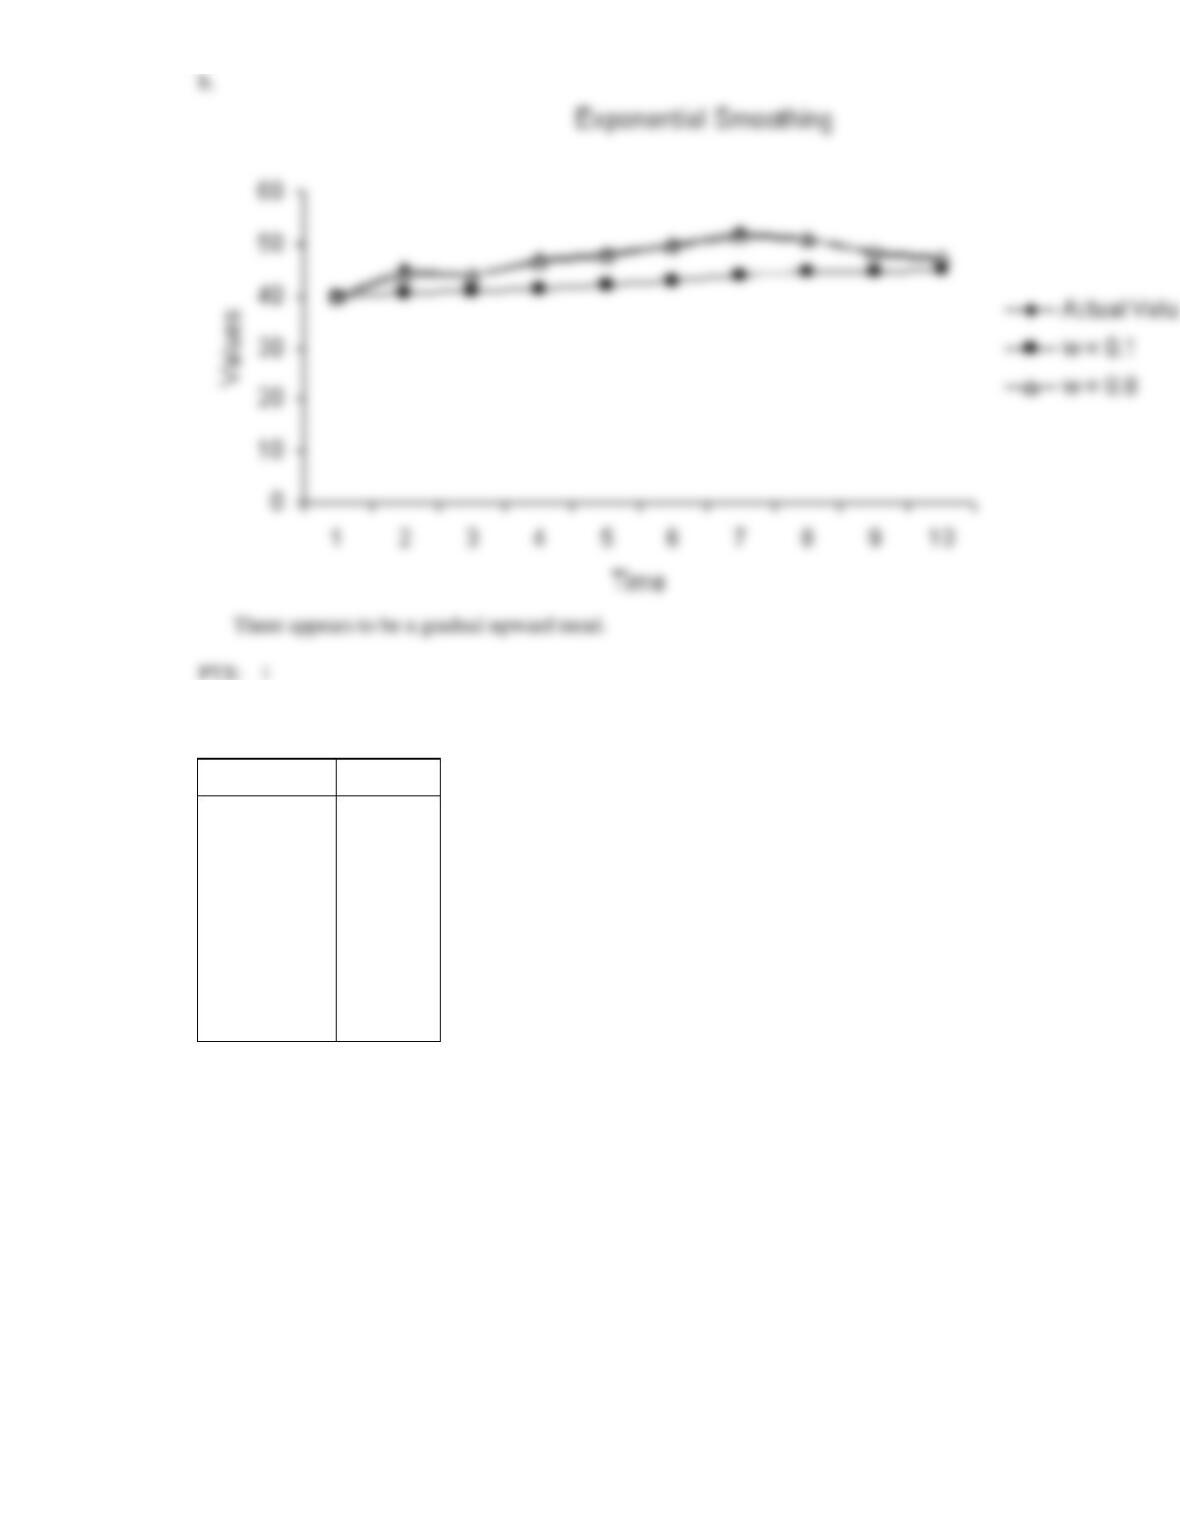
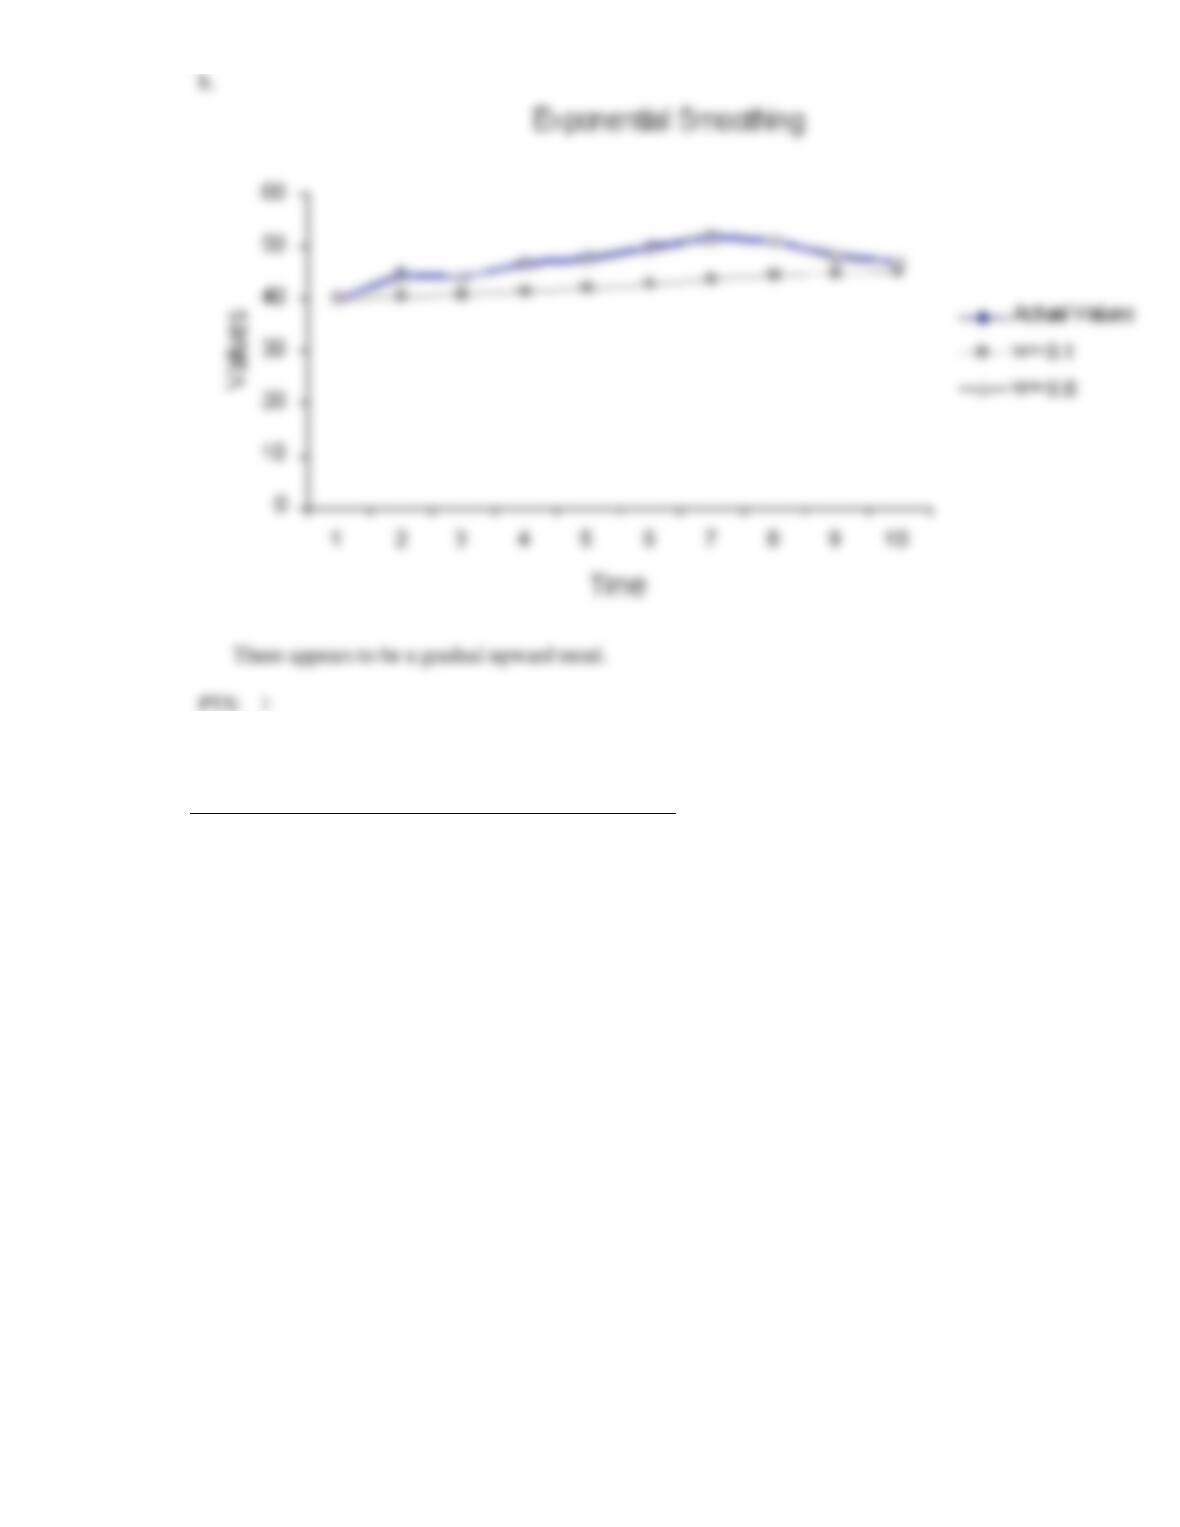
b. Draw the time series and the two sets of exponentially smoothed values. Does there appear to be a
trend component in the time series?
40
45
44
47
48
50
52
48
47
0.657
0.802
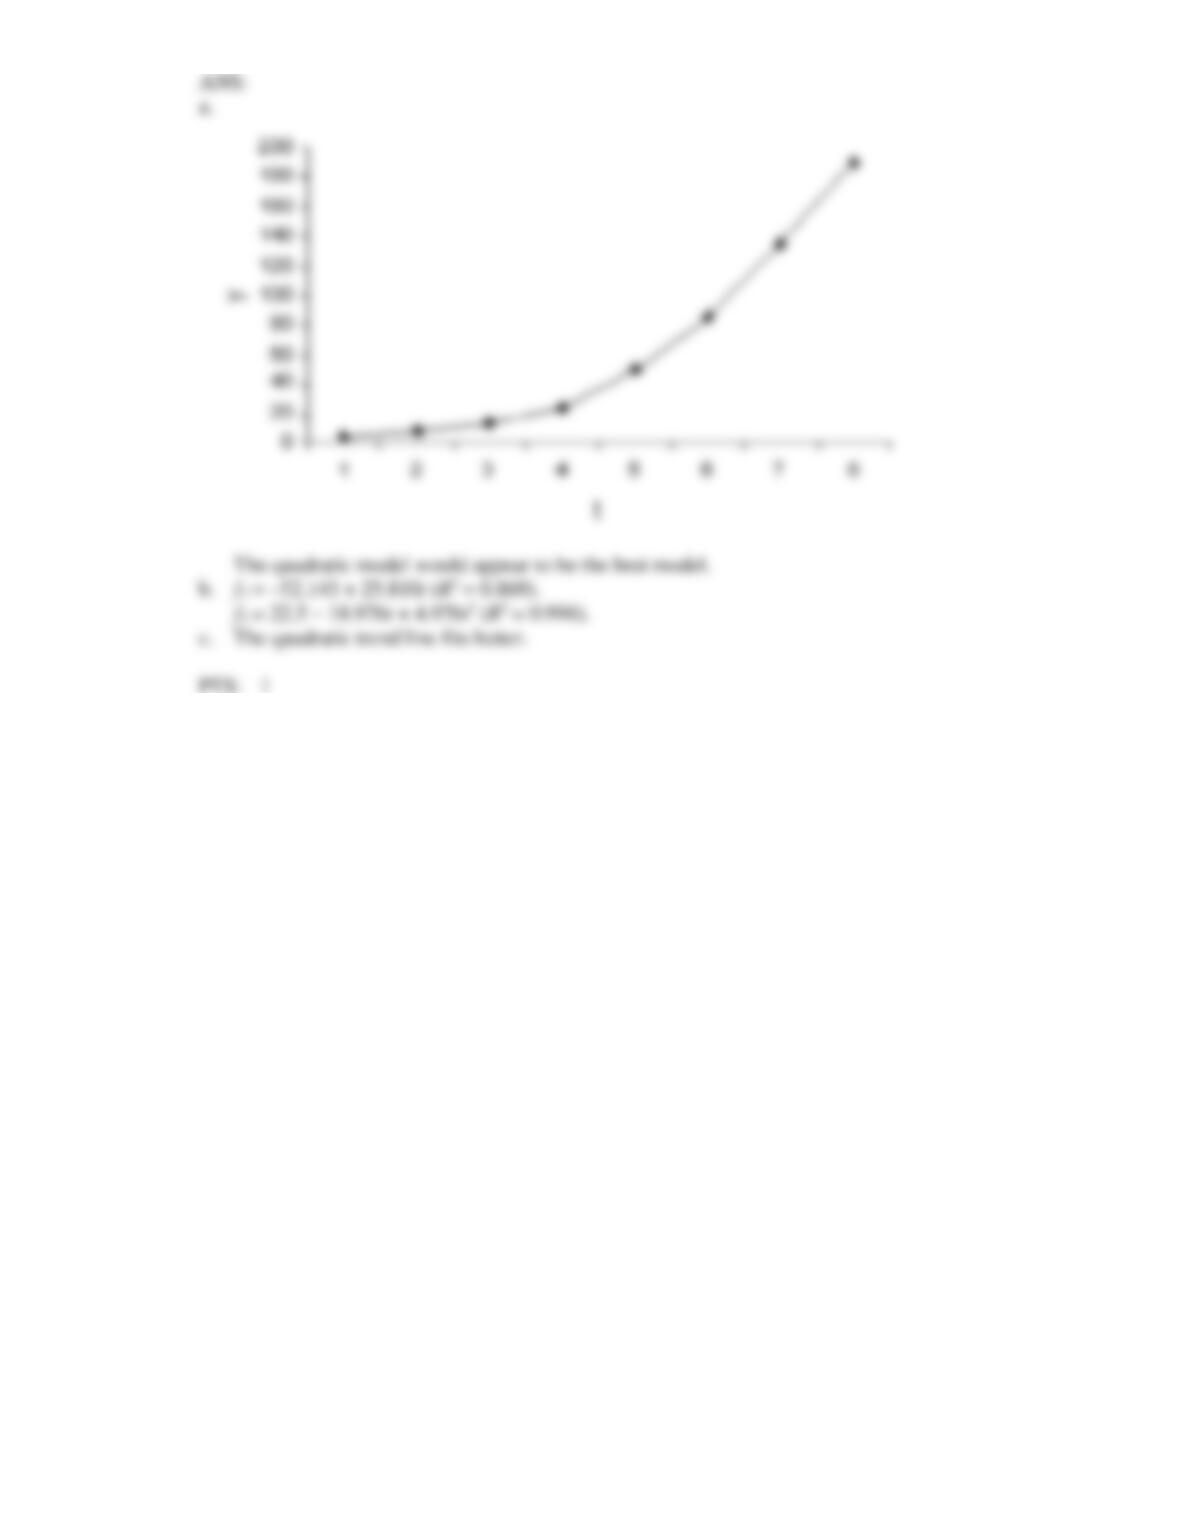
36. a. Plot the following time series. Would the linear or quadratic model fit better?
Time period
yt
Time period
yt
1
5
5
50
2
8
6
85
3
14
7
135
4
25
8
190
b. Use the regression technique to calculate the linear trend line and the quadratic trend line.
c. Which line fits better?