
a. Can we conclude at the 5% significance level that more than half of the copies produced by A
have a clarity score above 90?
b. Find the p-value of the test and briefly explain how to use it to test the hypotheses.
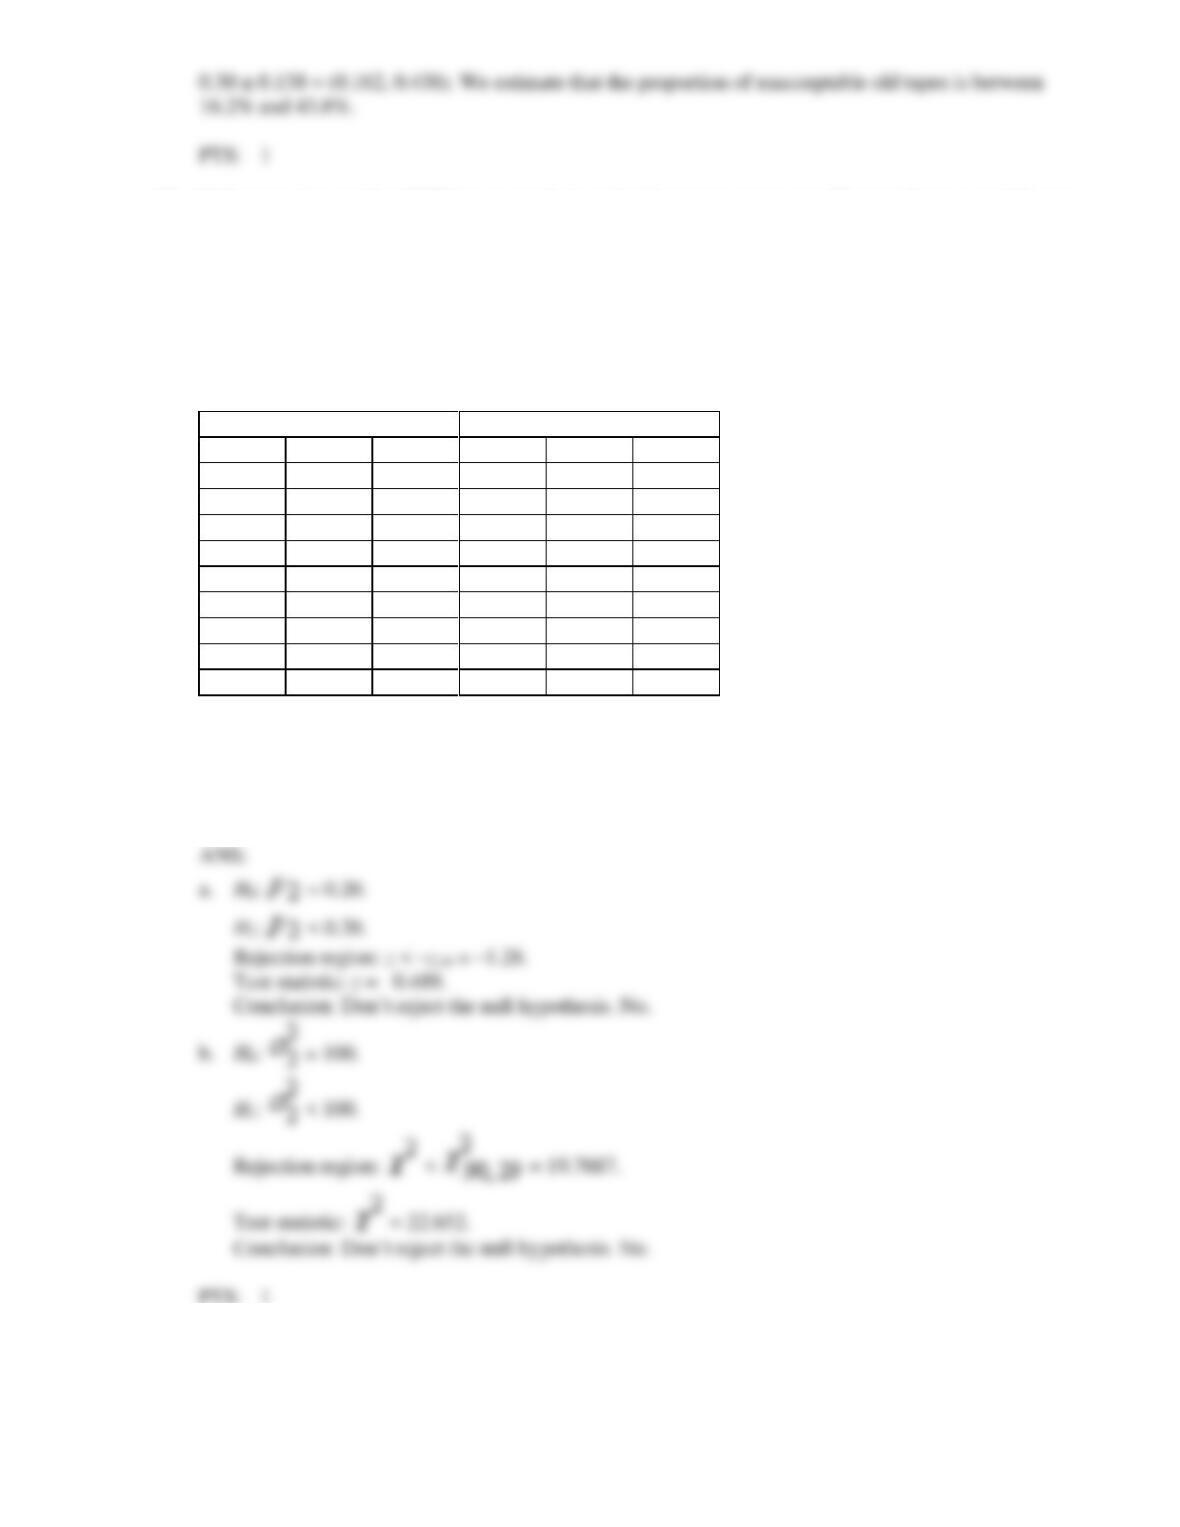
11. One of the important features of a photocopying machine is the clarity of copies. In order to decide
which of two photocopying machines, say Model A and Model B, has better average clarity, a
technician copied a random sample of 25 documents on 25 randomly selected A copiers and another
random sample of 25 documents on 25 randomly selected B copiers (one document was copied by
each copier). The clarity of each copy was measured on a scale of 0 to 100 and the measurements were
recorded in the table below. Suppose that the clarity measurements are normally distributed. A
statistician has determined that the number of openings and closings is normally distributed.
A
B
85
86
96
83
91
87
83
81
92
74
100
94
98
82
90
91
96
96
94
65
82
89
76
86
85
93
80
87
95
80
88
88
92
93
85
77
83
87
97
88
71
75
92
87
85
89
83
94
98
91
Estimate with 95% confidence the proportion of copies produced by B copiers whose clarity is above
90.

12. One of the important features of a photocopying machine is the clarity of copies. In order to decide
which of two photocopying machines, say Model A and Model B, has better average clarity, a
technician copied a random sample of 25 documents on 25 randomly selected A copiers and another
random sample of 25 documents on 25 randomly selected B copiers (one document was copied by
each copier). The clarity of each copy was measured on a scale of 0 to 100 and the measurements were
recorded in the table below. Suppose that the clarity measurements are normally distributed. A
statistician has determined that the number of openings and closings is normally distributed.
A
B
85
86
96
83
91
87
83
81
92
74
100
94
98
82
90
91
96
96
94
65
82
89
76
86
85
93
80
87
95
80
88
88
92
93
85
77
83
87
97
88
71
75
92
87
85
89
83
94
98
91
Estimate with 95% confidence the difference in the proportions of copies produced by A and B
copiers, respectively, whose clarity is 95 or better.
13. The irradiation of food to destroy bacteria is an increasingly common practice. In order to determine
which one of two methods of irradiation is best, a scientist took a random sample of 100 one-kilogram
packages of minced meat and subjected 50 of them to irradiation method 1 and the remaining 50 to
irradiation method 2. The bacteria counts were measured and the following statistics were computed.
The scientist noted that the data were normally distributed.
Method 1
Method 2
= 86
= 98
= 324
= 841
Determine whether these data are sufficient to infer at the 5% significance level that the two
population variances differ.
14. The irradiation of food to destroy bacteria is an increasingly common practice. In order to determine
which one of two methods of irradiation is best, a scientist took a random sample of 100 one-
kilogram packages of minced meat and subjected 50 of them to irradiation method 1 and the
remaining 50 to irradiation method 2. The bacteria counts were measured and the following
statistics were computed. The scientist noted that the data were normally distributed.
Method 1
Method 2
= 86
= 98
= 324
= 841
a. Estimate with 95% confidence the ratio of the variances of the bacteria counts under the two
methods, and briefly describe what the interval estimate tells you.
b. Do these results allow us to infer at the 5% significance level that there is a difference in bacteria
count between methods 1 and 2?
c. Do these results allow us to infer at the 5% significance level that the mean bacteria count with
method 1 is less than 95?
15. The irradiation of food to destroy bacteria is an increasingly common practice. In order to determine
which one of two methods of irradiation is best, a scientist took a random sample of 100 one-kilogram
packages of minced meat and subjected 50 of them to irradiation method 1 and the remaining 50 to
irradiation method 2. The bacteria counts were measured and the following statistics were computed.
The scientist noted that the data were normally distributed.
Method 1
Method 2
= 86
= 98
= 324
= 841
Estimate with 95% confidence the difference in the mean bacteria counts between method 1 and
method 2.
16. The irradiation of food to destroy bacteria is an increasingly common practice. In order to determine
which one of two methods of irradiation is best, a scientist took a random sample of 100 one-kilogram
packages of minced meat and subjected 50 of them to irradiation method 1 and the remaining 50 to
irradiation method 2. The bacteria counts were measured and the following statistics were computed.
The scientist noted that the data were normally distributed.
Method 1
Method 2
= 86
= 98
= 324
= 841
Estimate with 95% confidence the mean bacteria count with method 2.
17. The irradiation of food to destroy bacteria is an increasingly common practice. In order to determine
which one of two methods of irradiation is best, a scientist took a random sample of 100 one-kilogram
packages of minced meat and subjected 50 of them to irradiation method 1 and the remaining 50 to
irradiation method 2. The bacteria counts were measured and the following statistics were computed.
The scientist noted that the data were normally distributed.
Method 1
Method 2
= 86
= 98
= 324
= 841
An important factor in determining which method to choose is consistency. That is, all other things
being equal, we would prefer to have a method that leaves all irradiated food with approximately the
same bacteria count. Can we infer at the 5% significance level that method 1 is superior to method 2 in
this respect?
18. The irradiation of food to destroy bacteria is an increasingly common practice. In order to determine
which one of two methods of irradiation is best, a scientist took a random sample of 100 one-kilogram
packages of minced meat and subjected 50 of them to irradiation method 1 and the remaining 50 to
irradiation method 2. The bacteria counts were measured and the following statistics were computed.
The scientist noted that the data were normally distributed.
Method 1
Method 2
= 86
= 98
= 324
= 841
Estimate with 95% confidence the ratio of the two variances.
19. The irradiation of food to destroy bacteria is an increasingly common practice. In order to determine
which one of two methods of irradiation is best, a scientist took a random sample of 100 one-kilogram
packages of minced meat and subjected 50 of them to irradiation method 1 and the remaining 50 to
irradiation method 2. The bacteria counts were measured and the following statistics were computed.
The scientist noted that the data were normally distributed.
Method 1
Method 2
= 86
= 98
= 324
= 841
Can we conclude at the 5% significance level that the variance of the bacteria count with method 2 is
less than 1500?
20. The irradiation of food to destroy bacteria is an increasingly common practice. In order to determine
which one of two methods of irradiation is best, a scientist took a random sample of 100 one-kilogram
packages of minced meat and subjected 50 of them to irradiation method 1 and the remaining 50 to
irradiation method 2. The bacteria counts were measured and the following statistics were computed.
The scientist noted that the data were normally distributed.
Method 1
Method 2
= 86
= 98
= 324
= 841
Estimate with 95% confidence the variance of the bacteria count with method 1, and briefly describe
what this interval estimate tells you.
503.123.
21. There are different approaches to fitness training. To judge which one of two approaches is better, 200
25-year-old men were randomly selected to participate in an experiment. For four weeks, 100 men
were trained according to approach 1 while the other 100 men were trained according to approach 2.
The percentage improvement in fitness was measured for each man and the statistics shown below
were computed. The percentage figures are known to be normally distributed.
Approach 1
Approach 2
= 27.3
= 33.6
= 47.614
= 28.09
Determine whether these data are sufficient to infer at the 5% significance level that the two
population variances differ.
22. There are different approaches to fitness training. To judge which one of two approaches is better, 200
25-year-old men were randomly selected to participate in an experiment. For four weeks, 100 men
were trained according to approach 1 while the other 100 men were trained according to approach 2.
The percentage improvement in fitness was measured for each man and the statistics shown below
were computed. The percentage figures are known to be normally distributed.
Approach 1
Approach 2
= 27.3
= 33.6
= 47.614
= 28.09
a. Estimate with 95% confidence the ratio of the variances of the percentage improvement in fitness,
and briefly describe what the interval estimate tells you.
b. Do these results allow us to conclude at the 5% significance level that approach 2 is superior?
23. There are different approaches to fitness training. To judge which one of two approaches is better, 200
25-year-old men were randomly selected to participate in an experiment. For four weeks, 100 men
were trained according to approach 1 while the other 100 men were trained according to approach 2.
The percentage improvement in fitness was measured for each man and the statistics shown below
were computed. The percentage figures are known to be normally distributed.
Approach 1
Approach 2
= 27.3
= 33.6
= 47.614
= 28.09
Estimate with 95% confidence the difference in the mean percentage improvement between
approaches 1 and 2, and briefly describe what this interval estimate tells you.
24. There are different approaches to fitness training. To judge which one of two approaches is better, 200
25-year-old men were randomly selected to participate in an experiment. For four weeks, 100 men
were trained according to approach 1 while the other 100 men were trained according to approach 2.
The percentage improvement in fitness was measured for each man and the statistics shown below
were computed. The percentage figures are known to be normally distributed.
Approach 1
Approach 2
= 27.3
= 33.6
= 47.614
= 28.09
a. Estimate with 95% confidence the mean percentage improvement with approach 2.
b. Do these results allow us to conclude at the 5% significance level that the mean percentage
improvement with approach 1 is at least 25%?
25. There are different approaches to fitness training. To judge which one of two approaches is better, 200
25-year-old men were randomly selected to participate in an experiment. For four weeks, 100 men
were trained according to approach 1 while the other 100 men were trained according to approach 2.
The percentage improvement in fitness was measured for each man and the statistics shown below
were computed. The percentage figures are known to be normally distributed.
Approach 1
Approach 2
= 27.3
= 33.6
= 47.614
= 28.09
Scientists are interested in determining which of the two approaches more consistently improves
fitness. Do these results allow us to conclude at the 10% significance level that approach 2 results in a
more consistent improvement in fitness than approach 1?
26. There are different approaches to fitness training. To judge which one of two approaches is better, 200
25-year-old men were randomly selected to participate in an experiment. For four weeks, 100 men
were trained according to approach 1 while the other 100 men were trained according to approach 2.
The percentage improvement in fitness was measured for each man and the statistics shown below
were computed. The percentage figures are known to be normally distributed.
Approach 1
Approach 2
= 27.3
= 33.6
= 47.614
= 28.09
Do these results allow us to conclude at the 5% significance level that the variance of the percentage
improvement with approach 2 is less than 40?

27. There are different approaches to fitness training. To judge which one of two approaches is better, 200
25-year-old men were randomly selected to participate in an experiment. For four weeks, 100 men
were trained according to approach 1 while the other 100 men were trained according to approach 2.
The percentage improvement in fitness was measured for each man and the statistics shown below
were computed. The percentage figures are known to be normally distributed.
Approach 1
Approach 2
= 27.3
= 33.6
= 47.614
= 28.09
Estimate with 95% confidence the variance of the percentage improvement with approach 1.
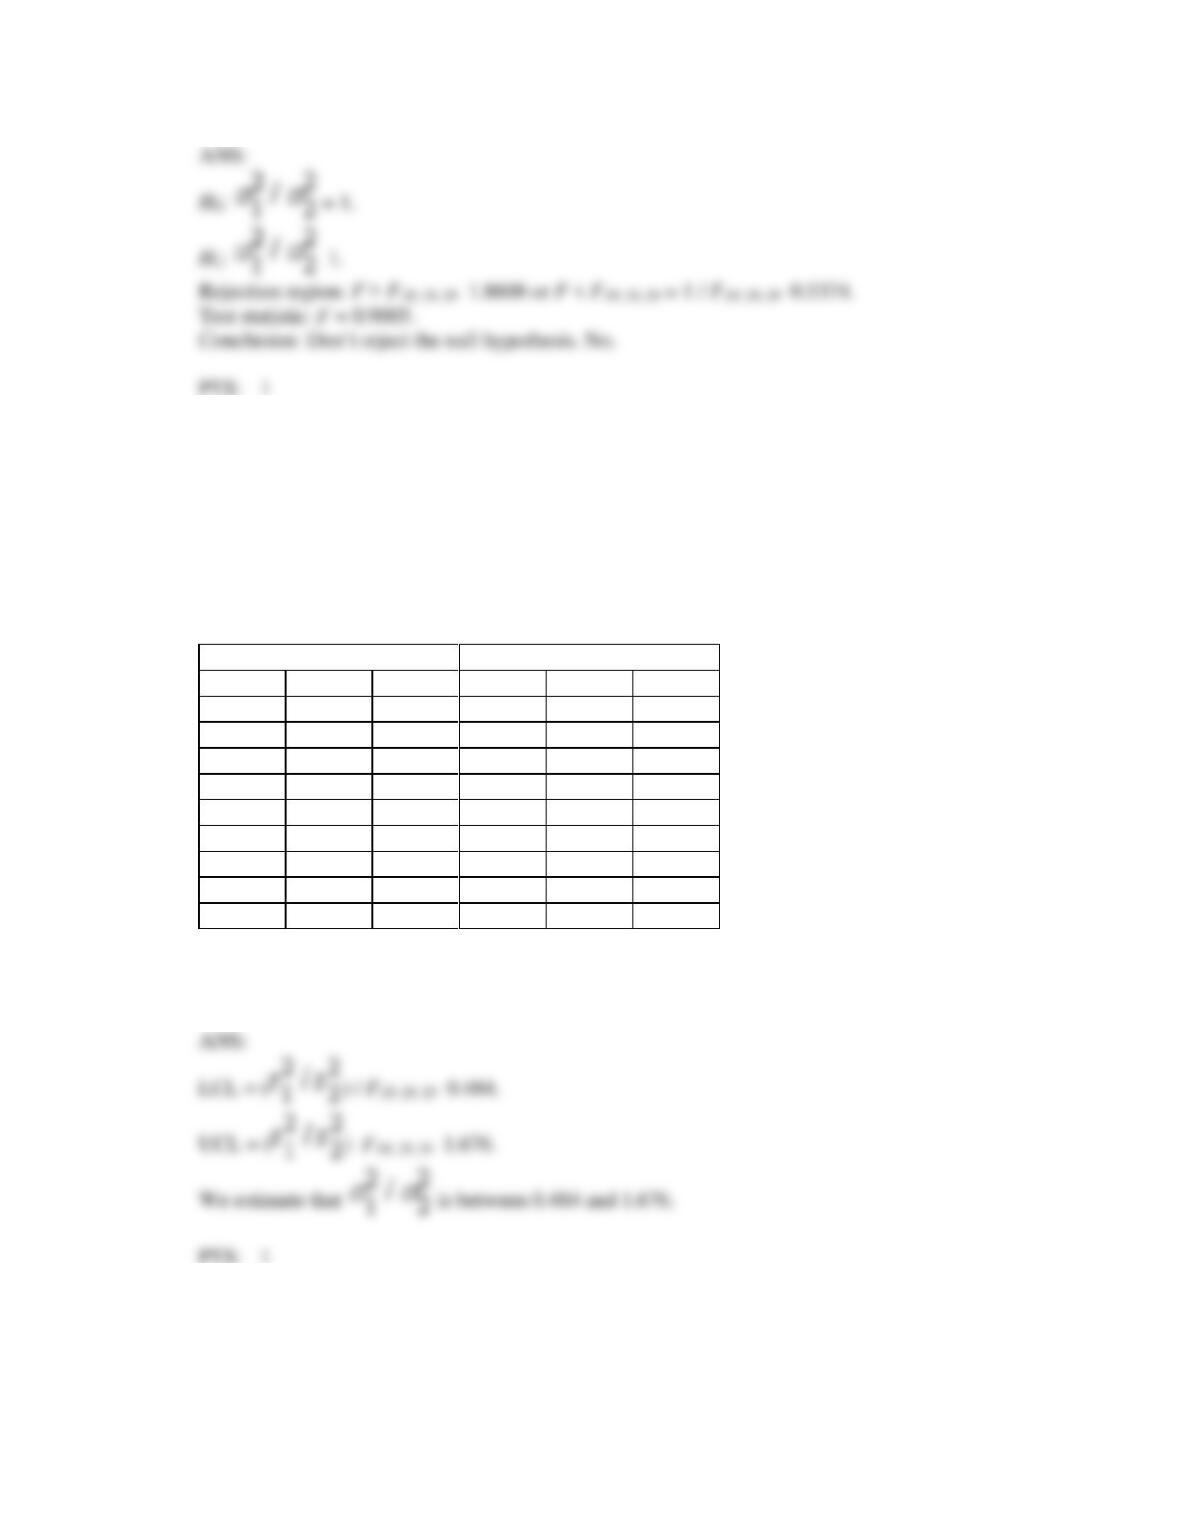
28. Videocassette recorder (VCR) tapes are designed so that users can repeatedly record new material over
old material. However, after a number of re-recordings the tape begins to deteriorate. A VCR tape
manufacturer is experimenting with a new technology, which hopefully will produce longer-lasting
tapes. Thirty of the old-style tapes and 30 utilising the new technology were used in an experiment.
The tapes were used to record and re-record programs until they began to deteriorate. The number of
re-recordings is assumed to be normally distributed. It is generally accepted that the number of
re-recordings should exceed 55. Any tapes that do not meet this criterion are considered to be
unacceptable. The number of re-recordings were observed and shown in the accompanying table.
Old-style tapes
New-technology tapes
60
61
48
68
70
58
51
46
66
74
72
69
66
63
61
77
73
49
73
55
71
59
66
61
71
49
76
52
58
59
47
56
55
66
51
49
60
62
64
62
59
57
52
51
63
51
56
66
64
68
52
50
55
76
47
55
58
63
68
78
Determine whether these data are sufficient to infer at the 10% significance level that the two
population variances differ.
29. Videocassette recorder (VCR) tapes are designed so that users can repeatedly record new material over
old material. However, after a number of re-recordings the tape begins to deteriorate. A VCR tape
manufacturer is experimenting with a new technology, which hopefully will produce longer-lasting
tapes. Thirty of the old-style tapes and 30 utilising the new technology were used in an experiment.
The tapes were used to record and re-record programs until they began to deteriorate. The number of
re-recordings is assumed to be normally distributed. It is generally accepted that the number of re-
recordings should exceed 55. Any tapes that do not meet this criterion are considered to be
unacceptable. The number of re-recordings were observed and shown in the accompanying table.
Old-style tapes
New-technology tapes
60
61
48
68
70
58
51
46
66
74
72
69
66
63
61
77
73
49
73
55
71
59
66
61
71
49
76
52
58
59
47
56
55
66
51
49
60
62
64
62
59
57
52
51
63
51
56
66
64
68
52
50
55
76
47
55
58
63
68
78
Estimate with 90% confidence the ratio of the variances of the number of re-recordings of the two
types of tape, and briefly describe what the interval estimate tells you.

30. Videocassette recorder (VCR) tapes are designed so that users can repeatedly record new material over
old material. However, after a number of re-recordings the tape begins to deteriorate. A VCR tape
manufacturer is experimenting with a new technology, which hopefully will produce longer-lasting
tapes. Thirty of the old-style tapes and 30 utilising the new technology were used in an experiment.
The tapes were used to record and re-record programs until they began to deteriorate. The number of
re-recordings is assumed to be normally distributed. It is generally accepted that the number of re-
recordings should exceed 55. Any tapes that do not meet this criterion are considered to be
unacceptable. The number of re-recordings were observed and shown in the accompanying table.
Old-style tapes
New-technology tapes
60
61
48
68
70
58
51
46
66
74
72
69
66
63
61
77
73
49
73
55
71
59
66
61
71
49
76
52
58
59
47
56
55
66
51
49
60
62
64
62
59
57
52
51
63
51
56
66
64
68
52
50
55
76
47
55
58
63
68
78
Can we conclude at the 10% significance level that the new tapes last longer than the old tapes?
31. Videocassette recorder (VCR) tapes are designed so that users can repeatedly record new material over
old material. However, after a number of re-recordings the tape begins to deteriorate. A VCR tape
manufacturer is experimenting with a new technology, which hopefully will produce longer-lasting
tapes. Thirty of the old-style tapes and 30 utilising the new technology were used in an experiment.
The tapes were used to record and re-record programs until they began to deteriorate. The number of
re-recordings is assumed to be normally distributed. It is generally accepted that the number of re-
recordings should exceed 55. Any tapes that do not meet this criterion are considered to be
unacceptable. The number of re-recordings were observed and shown in the accompanying table.
Old-style tapes
New-technology tapes
60
61
48
68
70
58
51
46
66
74
72
69
66
63
61
77
73
49
73
55
71
59
66
61
71
49
76
52
58
59
47
56
55
66
51
49
60
62
64
62
59
57
52
51
63
51
56
66
64
68
52
50
55
76

47
55
58
63
68
78
Estimate with 90% confidence the difference in the mean number of re-recordings between the old and
new tapes.
32. Videocassette recorder (VCR) tapes are designed so that users can repeatedly record new material over
old material. However, after a number of re-recordings the tape begins to deteriorate. A VCR tape
manufacturer is experimenting with a new technology, which hopefully will produce longer-lasting
tapes. Thirty of the old-style tapes and 30 utilising the new technology were used in an experiment.
The tapes were used to record and re-record programs until they began to deteriorate. The number of
re-recordings is assumed to be normally distributed. It is generally accepted that the number of re-
recordings should exceed 55. Any tapes that do not meet this criterion are considered to be
unacceptable. The number of re-recordings were observed and shown in the accompanying table.
Old-style tapes
New-technology tapes
60
61
48
68
70
58
51
46
66
74
72
69
66
63
61
77
73
49
73
55
71
59
66
61
71
49
76
52
58
59
47
56
55
66
51
49
60
62
64
62
59
57
52
51
63
51
56
66
64
68
52
50
55
76
47
55
58
63
68
78
Can we conclude at the 10% significance level that the mean number of re-recordings of the new tapes
is at least 55?
33. Videocassette recorder (VCR) tapes are designed so that users can repeatedly record new material over
old material. However, after a number of re-recordings the tape begins to deteriorate. A VCR tape
manufacturer is experimenting with a new technology, which hopefully will produce longer-lasting
tapes. Thirty of the old-style tapes and 30 utilising the new technology were used in an experiment.
The tapes were used to record and re-record programs until they began to deteriorate. The number of
re-recordings is assumed to be normally distributed. It is generally accepted that the number of re-
recordings should exceed 55. Any tapes that do not meet this criterion are considered to be
unacceptable. The number of re-recordings were observed and shown in the accompanying table.

Old-style tapes
New-technology tapes
60
61
48
68
70
58
51
46
66
74
72
69
66
63
61
77
73
49
73
55
71
59
66
61
71
49
76
52
58
59
47
56
55
66
51
49
60
62
64
62
59
57
52
51
63
51
56
66
64
68
52
50
55
76
47
55
58
63
68
78
Estimate with 90% confidence the mean number of re-recordings of the new tapes.
34. Videocassette recorder (VCR) tapes are designed so that users can repeatedly record new material over
old material. However, after a number of re-recordings the tape begins to deteriorate. A VCR tape
manufacturer is experimenting with a new technology, which hopefully will produce longer-lasting
tapes. Thirty of the old-style tapes and 30 utilising the new technology were used in an experiment.
The tapes were used to record and re-record programs until they began to deteriorate. The number of
re-recordings is assumed to be normally distributed. It is generally accepted that the number of re-
recordings should exceed 55. Any tapes that do not meet this criterion are considered to be
unacceptable. The number of re-recordings were observed and shown in the accompanying table.
Old-style tapes
New-technology tapes
60
61
48
68
70
58
51
46
66
74
72
69
66
63
61
77
73
49
73
55
71
59
66
61
71
49
76
52
58
59
47
56
55
66
51
49
60
62
64
62
59
57
52
51
63
51
56
66
64
68
52
50
55
76
47
55
58
63
68
78
a. Do the data allow us to infer at the 10% significance level that the new-technology tapes are
superior to the old-style tapes in terms of the number of unacceptable tapes?
b. Find the p-value of the test in a. and explain how to use it to test the hypotheses.

35. Videocassette recorder (VCR) tapes are designed so that users can repeatedly record new material over
old material. However, after a number of re-recordings the tape begins to deteriorate. A VCR tape
manufacturer is experimenting with a new technology, which hopefully will produce longer-lasting
tapes. Thirty of the old-style tapes and 30 utilising the new technology were used in an experiment.
The tapes were used to record and re-record programs until they began to deteriorate. The number of
re-recordings is assumed to be normally distributed. It is generally accepted that the number of re-
recordings should exceed 55. Any tapes that do not meet this criterion are considered to be
unacceptable. The number of re-recordings were observed and shown in the accompanying table.
Old-style tapes
New-technology tapes
60
61
48
68
70
58
51
46
66
74
72
69
66
63
61
77
73
49
73
55
71
59
66
61
71
49
76
52
58
59
47
56
55
66
51
49
60
62
64
62
59
57
52
51
63
51
56
66
64
68
52
50
55
76
47
55
58
63
68
78
Estimate with 90% confidence the difference in the proportions of unacceptable tapes between the old
and new tapes.
36. Videocassette recorder (VCR) tapes are designed so that users can repeatedly record new material over
old material. However, after a number of re-recordings the tape begins to deteriorate. A VCR tape
manufacturer is experimenting with a new technology, which hopefully will produce longer-lasting
tapes. Thirty of the old-style tapes and 30 utilising the new technology were used in an experiment.
The tapes were used to record and re-record programs until they began to deteriorate. The number of
re-recordings is assumed to be normally distributed. It is generally accepted that the number of re-
recordings should exceed 55. Any tapes that do not meet this criterion are considered to be
unacceptable. The number of re-recordings were observed and shown in the accompanying table.
Old-style tapes
New-technology tapes
60
61
48
68
70
58
51
46
66
74
72
69
66
63
61
77
73
49
73
55
71
59
66
61
71
49
76
52
58
59
47
56
55
66
51
49
60
62
64
62
59
57
52
51
63
51
56
66
64
68
52
50
55
76

47
55
58
63
68
78
a. Can we infer at the 10% significance level that the number of re-recordings of the old tapes is
more consistent than the number of re-recordings of the new tapes?
b. Do the data allow us to infer at the 10% significance level that the proportion of unacceptable old
tapes exceeds 20%?
c. Find the p-value of the test.
37. Videocassette recorder (VCR) tapes are designed so that users can repeatedly record new material over
old material. However, after a number of re-recordings the tape begins to deteriorate. A VCR tape
manufacturer is experimenting with a new technology, which hopefully will produce longer-lasting
tapes. Thirty of the old-style tapes and 30 utilising the new technology were used in an experiment.
The tapes were used to record and re-record programs until they began to deteriorate. The number of
re-recordings is assumed to be normally distributed. It is generally accepted that the number of re-
recordings should exceed 55. Any tapes that do not meet this criterion are considered to be
unacceptable. The number of re-recordings were observed and shown in the accompanying table.
Old-style tapes
New-technology tapes
60
61
48
68
70
58
51
46
66
74
72
69
66
63
61
77
73
49
73
55
71
59
66
61
71
49
76
52
58
59
47
56
55
66
51
49
60
62
64
62
59
57
52
51
63
51
56
66
64
68
52
50
55
76
47
55
58
63
68
78
Estimate with 90% confidence the proportion of unacceptable old tapes, and briefly describe what this
interval estimate tells you.
38. Videocassette recorder (VCR) tapes are designed so that users can repeatedly record new material over
old material. However, after a number of re-recordings the tape begins to deteriorate. A VCR tape
manufacturer is experimenting with a new technology, which hopefully will produce longer-lasting
tapes. Thirty of the old-style tapes and 30 utilising the new technology were used in an experiment.
The tapes were used to record and re-record programs until they began to deteriorate. The number of
re-recordings is assumed to be normally distributed. It is generally accepted that the number of re-
recordings should exceed 55. Any tapes that do not meet this criterion are considered to be
unacceptable. The number of re-recordings were observed and shown in the accompanying table.
Old-style tapes
New-technology tapes
60
61
48
68
70
58
51
46
66
74
72
69
66
63
61
77
73
49
73
55
71
59
66
61
71
49
76
52
58
59
47
56
55
66
51
49
60
62
64
62
59
57
52
51
63
51
56
66
64
68
52
50
55
76
47
55
58
63
68
78
a. Do the data allow us to infer at the 10% significance level that the proportion of unacceptable new
tapes is less than 20%?
b. Can we infer at the 10% significance level that the variance of the number of re-recordings of the
new tape is less than 100?

39. Videocassette recorder (VCR) tapes are designed so that users can repeatedly record new material over
old material. However, after a number of re-recordings the tape begins to deteriorate. A VCR tape
manufacturer is experimenting with a new technology, which hopefully will produce longer-lasting
tapes. Thirty of the old-style tapes and 30 utilising the new technology were used in an experiment.
The tapes were used to record and re-record programs until they began to deteriorate. The number of
re-recordings is assumed to be normally distributed. It is generally accepted that the number of re-
recordings should exceed 55. Any tapes that do not meet this criterion are considered to be
unacceptable. The number of re-recordings were observed and shown in the accompanying table.
Old-style tapes
New-technology tapes
60
61
48
68
70
58
51
46
66
74
72
69
66
63
61
77
73
49
73
55
71
59
66
61
71
49
76
52
58
59
47
56
55
66
51
49
60
62
64
62
59
57
52
51
63
51
56
66
64
68
52
50
55
76
47
55
58
63
68
78
Estimate with 90% confidence the population variance of the number of re-recordings of the new tape.